GLOBAL SAM MANAGEMENT UPDATE - Summary of Findings - unite for children
←
→
Page content transcription
If your browser does not render page correctly, please read the page content below
SePtember 2013

GLOBAL SAM
MANAGEMENT UPDATE
Summary of Findings
NutritioN SectioN, Program DiviSioN
uNiceF NY

unite for
children

Contents                                                                             2

      Acknowledgements                                 3

      Acronyms                                         4

1.0   Introduction                                     5

2.0   Harmonized Terminology                           5

3.0   Methodology                                      6

4.0   Response Rate & Data Limitations                 7

5.0   Main Findings of the 2012
      Global SAM Management Update                     8

      5.1 Summary Of Findings                          8

      5.2 Number Of Countries Implementing Services    9

      5.3 National Reporting Rates                    11

      5.4 Burden Of Malnutrition                      12

      5.5 SaM admissions                              12

      5.6 Quality Of SaM Treatment                    13

      5.7 Coverage: Geographical & Treatment          15

      5.8 Bottlenecks To Scale Up                     16

      5.9 Integration Into Health Services            16

6.0   Conclusion & Way Forward                        17

                                                           UNICEF Global SAM Management Update 2013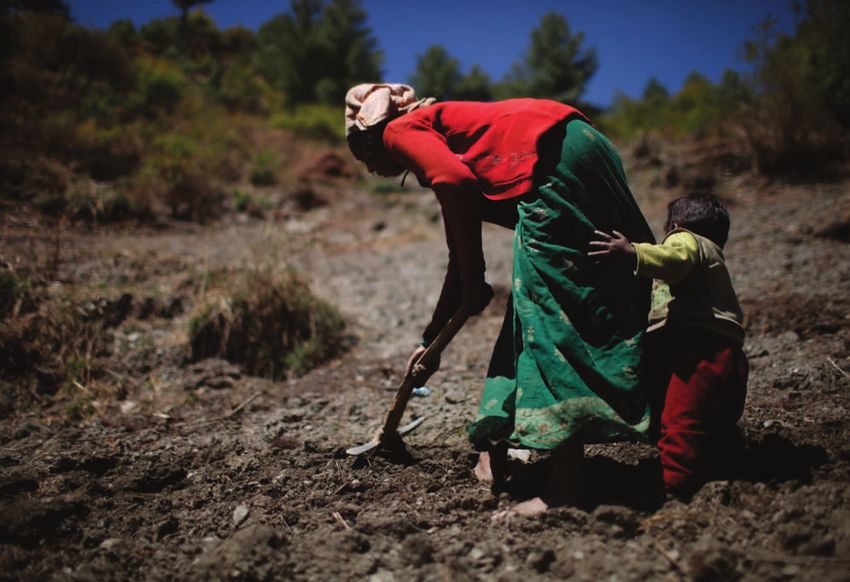
Acknowledgements                                                                                                    3

                                                                                               A woman holds her malnourished child at a
                                                                                               UNICEF-supported therapeutic feeding centre
                                                                                               in Chagoua Dispensary, N'Djamena (Chad)

                                                                                                                                             © UNICEF/NYHQ2012-0288/Holt
We would like to thank the UNICEF health and nutrition staff working at the country level, and UNICEF Regional Advisers
for their input and patience throughout this exercise. Thanks to our colleagues at UNICEF HQ in New York and at UNICEF
Supply Division in Copenhagen. Thanks also to Valid International for their support.

We wish to especially recognize the NGOs and staff at the state, regional and provincial Ministry of Health divisions who are
working to improve nutrition programming and the treatment of acute malnutrition every day.

Finally, acknowledgement goes to the children and their families in need of SAM treatment ─whom we seek every day to
serve better.

                                                                                                UNICEF Global SAM Management Update 2013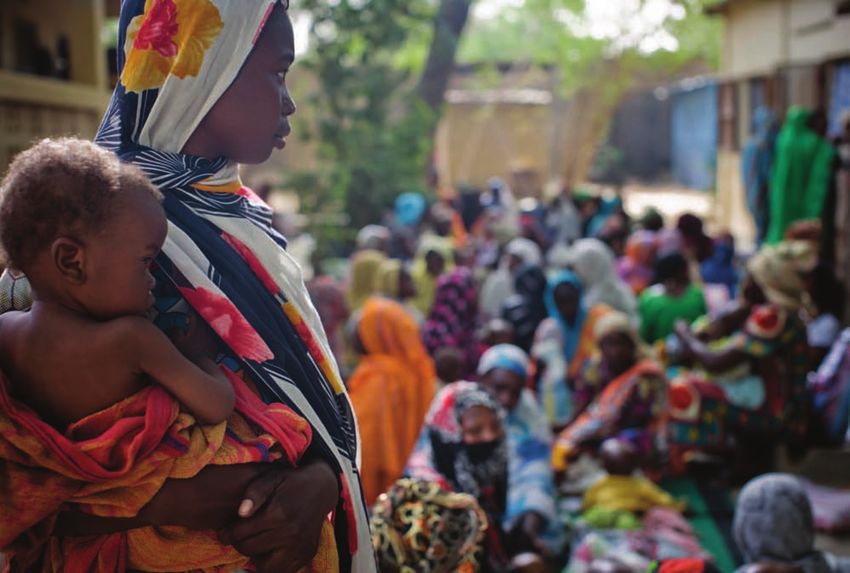
Acronyms                                                                               4

   CO   Country Office
  CTC   Community based Therapeutic Care
CMAM    Community-based Management of Acute Malnutrition
EAPRO   East Asia and Pacific Regional Office (UNICEF)
ESARO   East and Southern Africa Regional Office (UNICEF)
 HMIS   Health Management Information System
  HQ    Head Quarters
 MENA   Middle East and North Africa (UNICEF)
  MoH   Ministry of Health
 ROSA   Regional Office for South Asia (UNICEF)
 RUTF   Ready to Use Therapeutic Food
  SAM   Severe Acute Malnutrition
TACRO   The Americas and the Caribbean Regional Office (UNICEF)
WCARO   Western and Central African Regional Office (UNICEF)
 WHO    World Health Organisation

                                                               UNICEF Global SAM Management Update 2013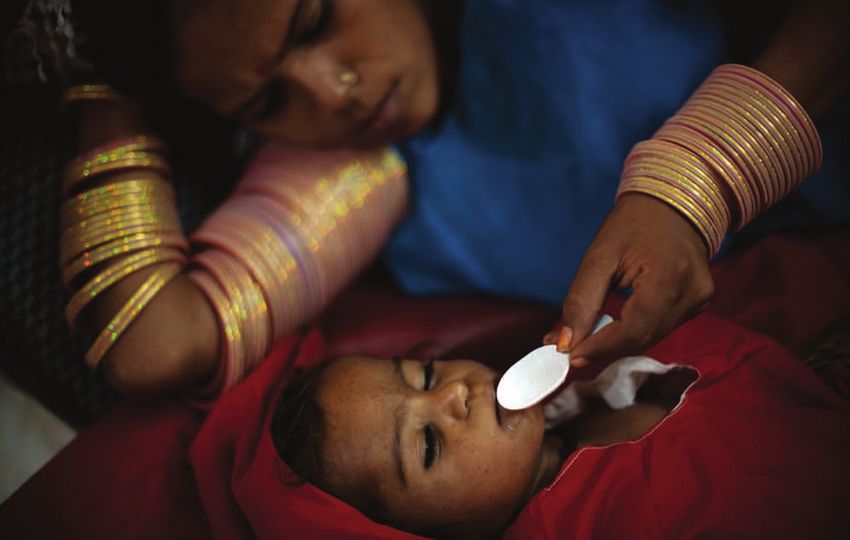
1.0 Introduction                                                                                                                          5

T
     he management of severe acute malnutrition (SAM) is critical for child survival and is a key component of the scaling up
     nutrition framework for addressing undernutrition. UNICEF is a leading organization in the scaled-up implementation of
     community-based management of acute malnutrition and provides technical support and capacity-building for ministries
of health and NGOs involved in treating children with SAM. Globally, UNICEF remains the main procurer of Ready to Use
Therapeutic Food (RUTF), procuring approximately 80 per cent of global needs, besides therapeutic milk (F-75, F100) and
ReSoMal, which are essential for SAM treatment.

A significant component of UNICEF’s work is monitoring and evaluation to demonstrate coverage and quality. An initial mapping
of countries supported by UNICEF in the area of community based management of severe acute malnutrition was conducted in
2010, using 2009 data. The review assessed Community-based Management of Acute Malnutrition1 (CMAM) programming
with a focus on SAM treatment. This was followed by the 2011 ‘Global SAM Treatment Update’, an effort to capture and
analyse key SAM treatment data to obtain a global snapshot of the status of SAM services in 2011 and gain a better under-
standing of the progress made by the programme during the year. In 2012, UNICEF worked with NGO partner Valid Interna-
tional to develop a web-based data collection and reporting system. The objective was to build on previous efforts to gather
baseline data related to SAM management at the national level, to be synthesized and reported at regional and global levels.

This report summarizes the key findings from the 2012 Global SAM Management Update, including comparisons between the
2009 and 2011 data that help measure progress. In addition, this report outlines the way forward on global SAM management
reporting and identifies areas around nutrition information that require strengthening.

                                                                                                                                                         © UNICEF/NYHQ2009-0895/Sokol

      A woman, her child behind her, uses a pickaxe to work
      a field in Sawa Khola Village, Mugu District (Nepal)

1
    Also known as Integrated Management of Acute Malnutrition (IMAM) or Community-based Therapeutic Care (CTC).

                                                                                                                  UNICEF Global SAM Management Update 2013
2.0 Harmonized Terminology                                                                                                                                                   6

T
        he emergency responses to the 2011 nutrition crisis in the Horn of Africa and the 2012 food security and nutrition
        emergency in the Sahel highlighted inconsistencies in the way the number of malnourished children was calculated
        and communicated by different countries. In an effort to improve UNICEF’s accuracy and consistency, the Nutrition in
Emergencies Unit undertook a standardization of the process. Different formulas were reviewed; external experts, senior
nutrition advisers and managers in UNICEF, the World Food Programme (WFP) and the World Health Organization (WHO)
were consulted; and UNICEF Country offices (COs) participated in webinars to understand the changes and implications for
each country. The three main areas where discrepancies were identified were calculations for the incidence of SAM, the burden
of malnutrition and the coverage of SAM treatment. The following standardizations for these three calculations were proposed:

l iNciDeNce oF Sam

An estimate of the incidence of SAM may be calculated using the formula below. It is important to note, however, that there
are two caveats to be considered, which urge caution in the calculation of potential caseloads using this estimate:
❱❱ The mean duration of a SaM episode is not easy to estimate and may vary from setting to setting.
❱❱ The method relies on an assumption of constant incidence. This assumption is unlikely to be true for a condition
   such as SaM, which is usually seasonal as it is strongly associated with infection and food availability.

                                            incidence = Prevalence/average duration of disease

A common estimate of the average duration of an untreated SAM episode is 7.5 months (Garenne et al. 2009).2 Using this
to estimate incidence over one year (i.e., 12 months) yields:3

                                             incidence = Prevalence × 12/7.5 = Prevalence × 1.6

1.6 is therefore the incidence correction factor for the calculation of incidence from a given prevalence.

l burDeN oF malNutritioN

The burden of SAM is defined as an estimation of the total number of SAM cases in a population over a specific period (i.e.,
prevalent cases + incident cases in the year). The burden is estimated through calculation of SAM prevalence within the
6 - 59 month population (either nationally or within a defined geographic area) with incidence correction factor as follows:

                                 burden = Population 6-59m x [Prevalence + (Prevalence x 1.6)]4
                                   Or simplified to: burden= Population 6-59m x Prevalence x 2.6

To clarify further, the above is the total of the below:
❱❱ Prevalent cases = prevalence SaM x population 6-59m
❱❱ Incident cases = prevalence SaM x population 6-59m x 1.6 (where 1.6 is a correction factor which gives incidence
    as factor of prevalence)

l coverage oF Sam treatmeNt

The 2012 Global SAM Management Update offers guidance for calculating the treatment coverage as follows:

                                    Number of Sam children 6-59m admitted in 2012
                          6 - 59m population x prevalence of Sam x incidence of Sam (i.e., burden)

As outlined in the annex Report "The State of Global SAM Management Coverage 2012", an accurate calculation of the
burden can be problematic, which has an impact on the calculation of treatment coverage.

2
  This should be lower in countries with expanded programmes.
3
  If actual incidence multiplication factor is known, then this can be used in place of the 1.6 in all calculations, noting that it will impact the figures obtained.
4
  The incidence is the proportion of new cases of SAM out of the total population of children under five that occur over a specific time period ─ Incidence = Prevalence/average duration
of disease. A common estimate of the average duration of an untreated SAM episode is 7.5 months. Using this to estimate incidence over one year (i.e., 12 months) yields: 12/7.5 = 1.6.

                                                                                                                                               UNICEF Global SAM Management Update 2013
3.0 Methodology                                                                                                                                               7

l Data iNPut

Building on the Excel-based 2010 Global Mapping Review and the 2011 Global SAM Treatment Update, the methodology for
2012 was amended with the aim of improving the quality of responses. An online input data capture system was developed,
modelled on the Excel questionnaire, with the following characteristics:

❱❱ an external site but linked to the UNICEF identity management                                              ❱❱ Restricted data input through usage of drop
   system to ensure security and UNICEF-staff-only access                                                        down menus and restriction of text inputs
❱❱ Submission restrictions to ensure complete forms are submitted                                             ❱❱ Pop-up guidance for each question

The original questionnaire,5 based on the WHO health systems framework, was expanded to capture a wider range of
information and modified to increase the specificity of both the qualitative information (general SAM service programme
background/context, country objective, bottlenecks) and quantitative information (burden, target, cases admitted, prevalence,
incidence, coverage and performance indicators) being requested.

Questions were divided into five sections:
1 Country Profile: situation at the national level (not UNICEF perspective alone) including scale-up objectives for
  management of SAM/country classification
2 Quality & Impact: report uptake (indicating reliability of data), outcome indicators, geographical & treatment coverage
3 Integration: Integration of SAM services into the health system apparatus
4 Bottlenecks: Impediments to maintaining and scaling up programmes
5 iYcF & micronutrient data (new areas)

To ensure greater quality of data input, the data capture questionnaire was improved from previous years in 3 important ways:
❱❱ The questions were refined, based on an analysis of answers received from previous years’ data collection.
❱❱ Data input was restricted through the wide use of drop-down menus etc.
❱❱ Guidance (developed in pop-up form) for each question in the system was strengthened and expanded.
   In conjunction, Headquarters (HQ) conducted five webinars, one for each region, to clarify terminology and
   definitions and strengthen the capacity of staff to fill the system.

A total of 74 countries received the online questionnaire via email for completion. The targeted countries were those on the
Supply Division Supplies Forecast list (indicating the countries that were procuring therapeutic feeding supplies), as well as
countries targeted for previous exercises and those known to have SAM services.

l Data collatioN & rePortiNg

For the 2012 data, all responses were collated in an online database (developed in MySQL) that was linked to the data capture
system. On the front end, a reporting output system was developed to capture four key data output components:

❱❱ Data submission progress, demonstrating which countries ❱❱ Bottleneck analysis (qualitative text)
   had started filling in and completed the system              ❱❱ Data table (in Excel), generated through the download
❱❱ Key indicators, pre-selected and outlined in graphs & tables    function that allowed all data to be transmitted in Excel
   (e.g., target and admissions data, performance indicators)      format (either global or country specific)

After data cleaning, specific outputs were selected for this report. In particular, those questions/indicators with reliable, com-
parable data were included for presentation in the final analysis. All individual level country data is available in the database
which has an web-based interface managed by UNICEF.

5
    For any additional documents pertaining to the review, please contact the office of UNICEF New York Nutrition in Emergencies.

                                                                                                                                    UNICEF Global SAM Management Update 2013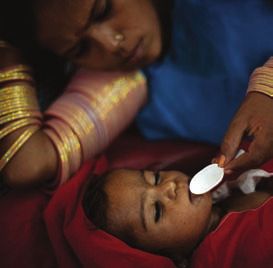
4.0 Response Rate & Data Limitations                                                                                         8

S
      ixty-two of the 74 countries that were sent the online link to the questionnaire submitted responses (compared to 57
      countries in 2011). In addition, the SAM management status and admissions figures were entered by UNICEF HQ for
      three countries - Bolivia, Central African Republic and Lesotho - which had submitted 2012 admissions figures to the
UNICEF Country Office Annual Report exercise, but had not filled in the 2012 Global SAM Management Update. Of the 62
responses received, 60 countries stated that SAM management services were available either though inpatient services,
outpatient services or both. For the purpose of this report, we will use 60 countries as the total number of countries (unless
otherwise indicated).

l Data limitatioNS

While significant efforts were made to standardize terminology and calculation methods across countries to enable cross-
country comparisons, there were still 20 countries that did not follow the suggested guidance for calculating total SAM burden
and treatment coverage. There were different reasons for countries not adopting the suggested guidance, including:

❱❱    In-depth knowledge about a more sensitive and seasonal SaM prevalence within the country
❱❱    a more context-specific or realistic estimation of SaM incidence (no need to use the 1.6 correction factor)
❱❱    Consensus with MOH and/or nutrition sector or cluster using a previous formula/calculation method
❱❱    Concern that applying the suggested guidance would result in the appearance of weaker performance in reaching
      SaM children

More work is required in many countries to encourage them to use the suggested calculation method and subscribe to the
guidance so as to enhance the comparability of data, as well as the accuracy of their reporting.

For the 2012 exercise, a data quality check phase was completed in cooperation with the specific COs and the regions. A
select number of indicators were identified (burden calculation, reporting rate and treatment coverage) and reviewed for obvious
outliers (erroneous population figures or prevalence figures, or incidence correction factors). Over 30 COs were requested to
clarify or correct responses or add missing data, to improve the reliability, comparability and completeness of the data set.

                                                                                                                                          © UNICEF/NYHQ2009-0824/Ramoneda

     Three-year-old Porhi, who has gastroenteritis and is severely
     malnourished, lies on a bed as her mother gives her water in
     Badin Civil Hospital, in the city of Badin (Pakistan).

                                                                                                   UNICEF Global SAM Management Update 2013
5.0 Main Findings of the 2012 Update                                                                                                                               9

    5.1 Summary of Findings

     TABLE I                 SUMMARy OF SITUATION & EvOLUTION IN 2012 compared with 2011 & 2009
                          The table also includes data from the 2009 mapping exercise and the 2011 SAM questionnaire, as well as the 2012 Global SAM Management Update.

                                                                                 2009                           2011                            2012
                            # COUNTRIES IMPLEMENTING
                            SERvICES FOR SAM                                     536                            61                              607

                            COUNTRy OBjECTIvE                                    No question on country
                            Countrywide (or Expanded)                            objective asked
                            service provision
                            (current or phased)                                                                 34 countries (56%)              39 countries
                            Limited service provision 607                                                       16 countries (26%)              11 countries
                            Pilot                                                                               5 countries (8%)                5 countries

                            CASES ADMITTED
                            TO TREATMENT                                         1,035,771                      1,961,722                       2,662,7128

                            REPORTING RATE
                            % of reports received vs. expected
                            in a given reporting period
                            >75% reporting rate                                  8 countries (15%)10            29 countries (48%)9             25 countries
                            ≤50% reporting rate                                  15 countries (28%)             7 countries (11%)               8 countries
                            [Incomplete/No data provided]                        [20 countries (38%)]           [18 countries (30%)]            [20 countries (33%)]

                            PERFORMANCE INDICATORS
                            Cure rates ≥75%                                      21 countries (40%)             21 countries (34%)              30 countries
                            Defaulter rates 50% treatment coverage                                                                                             19 countries

                            GEOGRAPHICAL COvERAGE12                              No reliable data for intra-
                                                                                 country comparison (as
                            # countries able to provide                          too much variation between
                            information on health facilities                     methods of calculation)        28 countries (48%)              49 countries
                            Mean geographical coverage                                                          33%                             43%

                            PROCUREMENT OF RUTF13                                6,231 MT                       27,000 MT                       32,000 MT

6
  Quoted as 55 in the mapping report (which also covered part of 2010) as Ghana and Honduras started in 2010.
7
  Three countries (Bolivia, Central African Republic and Lesotho) did not submit a response to the Global SAM Update 2012 but were added to this figure since they submitted
SAM admissions data to the UNICEF Country Office Annual Report Data Annex; four other countries (Botswana, Guinea, Lao PDR, and Namibia) are believed to have SAM treat-
ment programmes from data submitted to previous 2011 and/or 2009 mappings, but they also did not submit a response to the Global SAM Update 2012.
8
  This includes SAM admissions from Bolivia, Central African Republic and Lesotho submitted to the 2012 Country Office Annual Reporting, totalling 13,489.
9
  The question in the 2011 exercise was “% of reports received vs. expected annually” rather than “in a given reporting period.”
10
   The question in the 2009 exercise was “% of reports received vs. expected annually” rather than “in a given reporting period.”
11
   Treatment coverage is defined as admissions / burden.
12
   For 2012, geographical coverage is defined as number of Health Facilities with SAM services / total number of Health Facilities.
13
   UNICEF procurement of RUTF represents some 80 per cent of the global supply. UNICEF continues to support the local production of RUTFs and has diversified its own sup-
plier base to include manufacturers in 15 countries: Dominican Republic, Ethiopia, France, Haiti, India, Kenya, Madagascar, Malawi, Mozambique, Niger, Norway, Sierra Leone,
South Africa, Sudan, Tanzania and the United States.

                                                                                                                                      UNICEF Global SAM Management Update 2013
10
5.2 Number of Countries Implementing Services
I
n 2012, 60 countries reported providing SAM treatment services in-country, whether inpatient, outpatient or both. This is
consistent with 2011, when 61 countries were reporting provision of SAM treatment,14 and represents an increase from
2009 when 53 UNICEF COs were reportedly implementing community-based services.15 In 2012, there were three other
countries (Bolivia, Central African Republic and Lesotho) that submitted SAM admissions data to the 2012 UNICEF Country
Office Annual Report Data Annex, but did not submit a response to the 2012 Global SAM Management Update; four other
countries (Botswana, Guinea, Lao PDR and Namibia) are believed to have SAM treatment programmes from data submit-
ted to previous 2011 and/or 2009 mappings, but they also did not submit a response to the 2012 Global SAM Management
Update, despite repeated follow up.
Qualifying the ‘status’ of the availability of SAM treatment services at the national level is important for planning, as well as
improving quality. While past mapping exercises did not capture the differentiation between inpatient and outpatient/commu-
nity-based service provision, the 2012 questionnaire emphasized that not every country is aiming for countrywide scale up
and made an effort to distinguish between different categorizations of programming. Countries were asked about current
status of SAM service provision (inpatient or outpatient) as well as the stage they were in and their objectives in scaling up
services for the management of SAM.
Sixty-two countries filled the system and an additional three countries submitted data to the UNICEF Country Office Annual
Report data annex, and may be categorized in the following manner:
TABLE II STATUS OF SAM TREATMENT SERvICES
STATUS No SAM Inpatient SAM Inpatient &
Services Services Outpatient
SAM Services
No. of Countries 216 7 56
15
There were 55 countries by mid-2010, with Ghana and Honduras starting services and included in the 2009 analysis.
16
Two countries (State of Palestine and Sao Tome and Principe) entered data into the system despite not having management of SAM services.
UNICEF Global SAM Management Update 201311
The definition used to classify country objectives requires strengthening, in particular the clarification of how these objectives
relate to the programme in the immediate term rather than the long term, as well as the differentiation between the objective
as it relates to the scale-up of existing SAM services, the scale-up of Community-based Management of Acute Malnutrition
and so on. The 2012 questionnaire attempted to build on the 2011 exercise and outlined some self-classification categories.
These start to illustrate whether country objectives are countrywide or more localized /seasonal programming. The 62 countries
which filled the system may be categorized as follows:
TABLE III REPORTED SAM SERvICE OBjECTIvE
COUNTRy No Plans Advocacy Pilot & Early Limited Expanded
SAM SERvICE & Planning Implementation Service Service
OBjECTIvE Provision Provision12
5.3 National Reporting Rates
A
slight decline in reporting rates also reflects the attempts in the 2012 exercise to improve the specificity of questions.
In total, 25 countries reported that they had >75 per cent reporting rate (i.e., they received >75 per cent of the required
reports within a given reporting period, whether monthly, quarterly etc.) compared with 29 countries in 2011. For 2012,
countries were asked to give raw numbers for reports expected within a reporting period and reports actually received within
this period. Contrarily, in 2011, countries were asked only to give a reporting percentage rate. While the number of countries
able to report, as well as countries reporting a >75 per cent reporting rate declined from last year, this may reflect the greater
clarity in the wording of the questions. The increased specificity of the data requested for 2012 (asking for raw numbers of
reports expected/received) is more difficult for countries to obtain, therefore the 2012 data can be more useful for indicating
which countries need additional support in improving reporting.
As the reporting rate from 2011 to 2012 was largely similar (as opposed to a marked improvement from 2009 to 2011), what
can be inferred is that the jump in admissions from 2011 to 2012 is not based as heavily as it was from 2009 to 2011 on bet-
ter reporting, but more truly reflects the increased number of admissions. Nevertheless, a high proportion of countries (20)
that provided incomplete or no data on country reporting indicates the need to improve national reporting systems over time.
FIGURE 2 COMPARISON OF REPORTS FOR SAM SERvICES RECEIvED 2011 & 2012
Number of countries by reporting rate: Global
75%
0 10 20 30 40 0 10 20 30 40
NUMBER OF COUNTRIES NUMBER OF COUNTRIES
While the 2012 Global SAM Management Update provides a useful global standardized framework for reporting quality and
much work has gone into harmonizing definitions and terminology, there is no global standardized system for national report-
ing; instead, each country is expected to have standards dictated ideally by their respective ministries of health. Therefore,
intra-country comparisons should be done with caution. More work on improving the quality of reporting at the national level
is needed.
UNICEF Global SAM Management Update 201313
TABLE Iv ESTIMATED 2012 SAM
5.4 Burden of Malnutrition BURDEN By REGION
REGION SAM BURDEN
I
n 2012, 42 countries used the aforementioned guidance to calcu- for 2012
late the burden. There are obvious challenges to the calculation
of this burden figure: updated census data is often unavailable ROSA 21,999,552
to accurately define the population under five in a country; and WCARO 5,353,337
seasonal changes are not reflected using this calculation (i.e., the
ESARO 2,987,674
prevalence is considered stagnant). The utilization of the incidence
correction factor of 1.6 is also problematic as it is not standard EAPRO 2,231,020
across countries, rather an average. MENA 1,865,121
TACRO 255,636
The table to the right provides an estimated overview of the an-
nual different burdens of SAM per region across the 62 countries Total 34,692,340
which filled the 2012 Global SAM Management Update system.
5.5 SaM admissions
I
REPORT ANNUAL ADMISSIONS n total, 2,662,712 cases of children aged 6 - 59 months
TABLE v FOR SAM TREATMENT (2009-2012) with SAM were reportedly admitted for treatment of
SAM in 2012,17 compared with an estimated 1.96 mil-
lion reported in 2011 and just over 1 million in 2009. While
REGION 2009 2011 2012
this increase in reported admissions perhaps reflects
overall improved reporting at national level, it is likely
ESARO 414,412 806,919 890,414
largely indicative of the ongoing expansion of SAM treat-
WCARO 488,366 784,660 1,235,302 ment services. In particular, the Sahel food and nutrition
ROSA 29,116 207,215 258,366 crisis of 2012 produced a huge response from govern-
ments, UNICEF and partners and accounts for most of
MENA 64,124 128,647 217,935
this increase in admissions. Nevertheless, despite strong
TACRO 0 21,660 28,882 progress, the total reported admissions still represents
EAPRO 5,600 12,671 31,813 only a little over 10 per cent of the ~20 million18 expected
SAM cases annually.
Total 1,001,618 1,961,772 2,662,712
The majority of children admitted to community-based
treatment of SAM continue to be in East/Southern and
Central/Western Africa, which have the most countries managing large numbers of children with SAM, due to longer experi-
ence and strong government commitment using community-based approaches to managing acute malnutrition. It is antici-
pated that an increase in numbers treated in Asia will occur as countries within this region - known to have high levels of
SAM - start to adopt this approach.
The number of SAM cases treated per country is not directly comparable given different contexts in terms of context, funding,
and maturity of the SAM management in country. Country admission comparisons should be taken into consideration with
country objective, geographical and treatment coverage and percentage reports received. Similarly, the number of SAM cases
treated regionally is also not directly comparable, for the above reasons.
It is not surprising that the majority of children were treated in Africa - due to the maturity of their SAM management programmes.
However, when a comparison is done between the admissions per region and the estimated SAM burden figures (above) it is
clear that scaling up of management of SAM in South Asia region where the burden is highest could yield significant progress
towards meeting the global burden of SAM cases.
This includes SAM admissions from Bolivia, Central African Republic and Lesotho submitted to the 2012 Country Office Annual Report, totalling 13,489.
17
The Lancet, Volume 374, Issue 9684, pp. 94-96, 11 July 2009. Recent calculations by UNICEF Division of Policy and Strategy have estimated the global number of cases of
18
SAM in the developing world to be 24.8 million; however, this figure requires further verification.
UNICEF Global SAM Management Update 201314
5.6 Quality of SaM Treatment
T
reatment of SAM has three globally agreed upon performance indicators - recovered, defaulted and died - that are
routinely collected at a decentralized level, and the quality of the performance in relation to these indicators refers to
Sphere standards, depending on the context. The 2012 Global SAM Management Update focused on two indicators:
recovered and defaulted. In total, 37 countries were able to report on performance indicator rates:
❱❱ ReCoveRy Rate: In 2012, 30 countries achieved ❱❱ DefaulteR Rate: In 2011, 25 countries achieved
a minimum recovered rate of ≥75 per cent (Sphere a defaulter rate of15
5.7 Coverage - Geographical & Treatment
l geograPhical coverage (defined as the proportion of primary health care facilities in the programme
area that deliver SAM services to the total number of primary health care facilities in the programme area)
Encouragingly, data gathered from 2012 showed a marked increase in the ability of countries to track geographic coverage:
approximately 75 per cent of the 60 countries (49 countries) were able to respond to questions pertaining to geographic
coverage based on the existence of services at the health facility level. This is a clear increase from 2011. For 2012, the
mean geographical coverage is 43 per cent. One issue with this is that although geographic coverage was defined as the
proportion of health facilities offering SAM services in the programme area, it seems that many countries provided national
figures in terms of total health facilities and total number of health facilities offering SAM services. Indeed, the geographic
coverage may in fact then be higher in some countries than reported for this year, as some countries were not aiming to
scale up to countrywide service provision but yet gave a national geographic coverage rate, which included areas of the
country where no health facilities were offering SAM services. A final issue is around how the criteria of ‘delivery of SAM
services’ is being defined to produce the numerator figure. It is clear that stronger guidance on this question is needed: at
the same time, it may be that there is limited knowledge within certain countries of the number of health facilities as well as
the proportion of these offering SAM services within the specific programme area.
A major challenge in determining geographical coverage is that there is still no global consensus on how to measure this,
or which methodologies to use in which setting. One way to strengthen this in future years may be to include another ques-
tion on geographic coverage to provide another reference point for triangulation of data, such as ‘proportion of districts (or
other administrative level) offering SAM services’, which would improve the measurement of the geographical availability
of SAM services.
l treatmeNt coverage (defined as ‘cases treated (admissions) / total burden’)
As mentioned, countries were asked to use the indirect methodology to estimate treatment coverage of SAM at a national
level. While admissions data improved from 2009 and 2011, further clarity on the denominator (total number of SAM cases
in country) is needed to increase accuracy. The overall range of responses on treatment coverage was narrower than in
previous years and of better quality, so some of this data has been included in this report.
While there is a continued need to train, support and guide further in this area and to inform UNICEF’s global support moving
forward, work is already being done at the global level to promote improvements in coverage assessments, by supporting
direct coverage surveys (CSAS, SQUEAC, SLEAC, S3M22) in partnership with Action Contre le Faim-UK and members of
the Coverage Monitoring Network. These surveys provide more precise figures on coverage and the efficacy of services
and there is a push to move from localized surveys to getting an accurate picture of national coverage. Moving forward, the
aim is to strengthen routine data to inform indirect coverage estimates, as well as incorporate coverage survey data into the
system where it is available to provide a more accurate coverage picture.
Finally, countries with more mature SAM management programmes have a better grasp on admissions in previous years
and an understanding of the expected number of children who need to be treated based on trend analysis. In improving
indirect estimates of treatment coverage, UNICEF continues to advocate and support the routine, decentralized collection
of SAM data to build these trend analyses.
22
CSAS: Centric Systematic Area Sampling; SQUEAC: Semi-quantitative Evaluation of Access and Coverage; SLEAC: Simplified LQAS Evaluation of Access and Coverage; S3M:
Simple Spatial Survey Method.
UNICEF Global SAM Management Update 201316
5.8 Bottlenecks to Scale Up
In 2011, COs were asked to record what the major bottlenecks were to scaling up in terms of supply, access, human resources
capacity, integration, funding or other. However, for 2012, three different questions were asked:
❱❱ Describe the three main barriers/bottlenecks to providing quality management of SaM in your country.
❱❱ Describe the three main barriers/bottlenecks to scaling up quality management of SaM in your country.
❱❱ What (if any) support would you like to receive at the regional/global level to address these barriers/bottlenecks?
Whereas for 2011 data some analysis was done to categorize these into commonly cited bottlenecks (e.g., human resources,
supplies, funding), for 2012 the approach was not to analyse this for trends but rather to use this data to inform country-specific
support. The rationale for this approach is as follows:
❱❱ There is little quality control in the answers given: What is meant by input can be the partial view of a particular
staff person rather than bottlenecks commonly identified by UNICEF/partners/government through a formal
process (e.g., UNICEF’s internal monitoring for equity results analysis, MoRES).
❱❱ By the time the bottlenecks are narrowed down into categories, they become too generic to be useful in informing
specific actions to address them. Since many of the bottlenecks cannot be dissociated from the context, it seemed
more appropriate to analyse them alongside country-specific data.
© UNICEF/NYHQ2012-0467/Brandt
Oumou Sy feeds fortified milk (F100) to her severely
malnourished7-month-old son, Kumbaba, at the
UNICEF-supported nutritioncentre in Kaédi Hospital in
the city of Kaédi in the southernGorgol Region (Mauritania)
UNICEF Global SAM Management Update 201317
5.9 Integration into Health Services
I
ntegration of SAM management into national health systems has been expanding the coverage of SAM treatment as
some ministries of health have adopted SAM management as part of the essential health package (not all countries are
aiming for nationwide scale-up as SAM management is not always necessary).
Since a questionnaire regarding integration into health systems has not yet been tested and piloted, this analysis only provides
a summary of countries stating ‘yes’ to the specific questions asked based on the WHO health systems building blocks, to
illustrate if there has been evolution in this area. Questions for the 2011 Global SAM Treatment Update were posed differently
in the 2009 mapping, so a direct comparison cannot be made, apart from a slight increase in the number of countries incor-
porating SAM indicators in the Health Management Information System (HMIS) - 16 countries in 2011 compared with 14 in
2009 - and a greater increase in the inclusion of community-based management of SAM in pre-service training (15 countries
in 2011 compared with 9 in 2009).
As seen in the table below, integration of management of SAM into national systems seems weakest is in the following
areas: (1) allocation of funds for SAM in the annual health sector plan; (2) national curricula for management of SAM; and
(3) RUTF on the essential supplies list. However, there was no obvious correlation found between the levels of treatment or
geographic coverage or number of admissions attained by countries and these particular integration indicators. Nevertheless,
moving forward, what is clear is that more needs to be done to advocate for governments to enhance their commitment and
leadership in the management of SAM.
TABLE vI INTEGRATION INTO HEALTH SySTEMS 2012 (62 countries responded)
NUMBER OF COUNTRIES
yES PARTIALLy NO UNAvAILABLE
Management of SAM
incorporated in MCHN policy 50 9 3 0
Management of SAM
incorporated MCHN
service package 39 16 7 0
Allocated funds for SAM in
annual health sector plan 24 0 35 3
Costed nutrition plan 39 0 23 0
National curricula
for management of SAM 24 0 38 0
Management of SAM
in CHW training 27 21 14 0
RUTF on essential supplies list 21 0 41 0
At least one SAM
indicator in HMIS 41 0 21 0
Direct treatment included
in MoH evaluations 19 0 43 0
SAM screening in
basic health package 24 29 9 0
SAM treatment included
in basic health package 19 31 12 0
UNICEF Global SAM Management Update 20136.0 Conclusion & way forward 18
T
he 2012 Global SAM Management Update illustrates some expansion of SAM treatment in both emergency and
non-emergency settings. More ministries of health are continuing to integrate SAM treatment services into existing
community health programmes. While there is still a long way to go, the nutrition community has a unique opportunity
to raise the profile of acute malnutrition globally, as well as to link to existing frameworks, the Scaling Up Nutrition movement
(SUN), and other initiatives (REACH).
The development of the web-based data collection and analysis mechanism to capture key information related to the man-
agement of SAM at the country level for synthesis at the global and regional level is the first time UNICEF has attempted to
systematically gather nutrition intervention data in this manner. The utility of the system for streamlining the data collection
process has been evident, and moving forward it is hoped that the open reporting output pages will be helpful for UNICEF
staff in tracking progress and easily extracting data for programme improvement, external communication, advocacy and
fundraising. Over time, it is envisaged that key data will be made publicly available annually, possibly through the ChildInfo.
org site (where impact level indicators on child nutrition and health are published), for the general health and nutrition commu-
nity, fulfilling a need at the global level for big picture information on the current situation of the scale-up of and management
of SAM.
In terms of the immediate way forward on this initiative to strengthen SAM management-related information, and nutrition
information more broadly, there are certain key actions being planned:
❱❱ Integrating the UNICEF annual supply forecasting tool into the system: Currently, while harmonized in terms of
timing, the supply forecasting exercise and the 2012 Global SaM Update exercise are two separate data collection
processes. For 2013, it is planned that the supply forecast sheets will be integrated into the online pages so that
this becomes one seamless exercise.
❱❱ Improving the quality of performance indicator reporting and trend analysis: UNICEF and partners are planning to
continue working with countries to improve SaM reporting using a variety of techniques depending on the context
and their appropriateness: national level web-based platforms, SMS systems, HMIS integrated reporting, etc.
UNICEF will convene a meeting in the fourth quarter of 2013 on improving nutrition information with SaM reporting
as one proposed outcome.
❱❱ Integrating coverage survey data: as discussed above, there are significant challenges with calculating treatment
coverage indirectly using the predicted burden. Working with partners, UNICEF will strengthen the capacity of
some countries to undertake coverage surveys in 2013 and will work to integrate this information into the system,
thereby triangulating data for particular countries and giving a more accurate situation of the programme’s success
and coverage.
❱❱ Develop additional modules for micronutrients and infant and young child feeding: Given the success of the 2012
Global SaM Update in terms of capturing global data, there is particular interest in creating additional data
modules for Micronutrients and Infant and Young Child Feeding Programmes, which is crucial to building UNICEF’s
global data management system from a harmonized perspective and lessening the burden of multiple information
requests to countries at different times.
It is important also to continue to standardize and improve information collection, collation, analysis and distribution at the
country level in order to mobilize action to increase the quality and availability of SAM services in both emergency and non-
emergency settings. UNICEF will continue to work on with partners in 2013 and beyond to support countries to strengthen
SAM services as well as promote resource allocation to approaches that will reduce the burden of SAM. Additionally, to sup-
port disaster risk reduction and resilience building efforts, this system will inform improved trend analysis and better national
snapshots related to the burden of SAM in order to better plan and respond. The strengthening of SAM services and greater
resource allocation to this approach will lead to improved protection of the nutritional status of children.
UNICEF Global SAM Management Update 201319
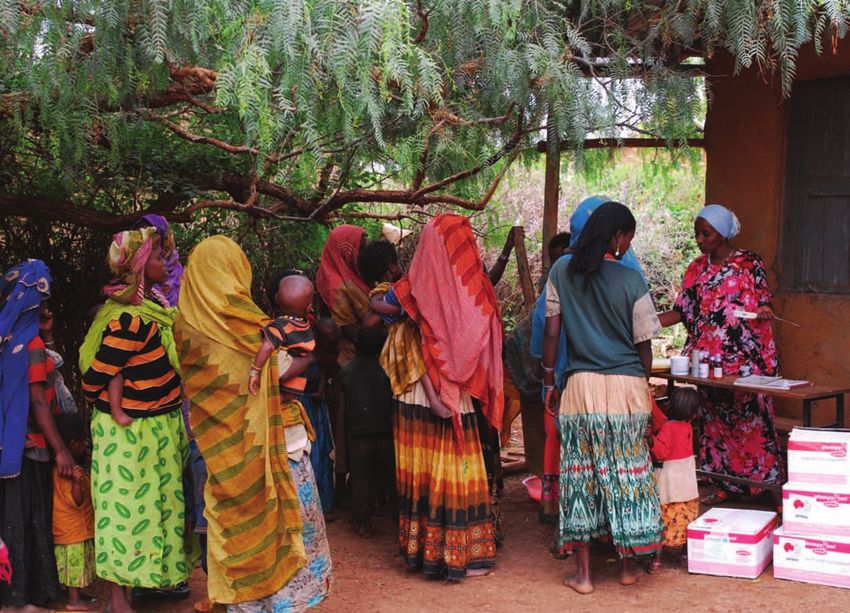
On 11 July, women attend nutrition screenings for their
children, at the health post in Belina Arba Village in
drought-affected Fedis District, in East Hararghe Zone
in Oromiya Region (Ethiopia). Health Extension Worker
LemlemWorku (right) is conducting the screenings as
part of a weekly community-based outpatient therapeutic
feeding programme at the facility.
© UNICEF/NYHQ2011-1246/Getachew
EAPRO ESARO MENA TACRO ROSA WCAR
Cambodia Angola Djibouti Guatemala Afghanistan Benin
DPR Burundi Iraq Haiti Bangladesh Burkina Faso
Indonesia Comoros oPt Honduras Bhutan Cameroon
Lao PRD Eritrea Sudan India Chad
Mongolia Ethiopia Syria 3 Nepal Congo Brazza-
Myanmar Kenya yemen Pakistan ville
Papua Madagascar 6 Sri Lanka Cote d'Ivoire
- New Guinea Malawi DRC
7
Philippines Mozambique Gambia
Timor Leste Rwanda Ghana
vietnam Somalia Guinea Bissau
South Sudan Liberia
10
Swaziland Mali
Tanzania Mainland Mauritania
Uganda Niger
Zambia Nigeria
Zanzibar Senegal
Zimbabwe Sierra Leone
Sao Tome
18 Togo
19
UNICEF Global SAM Management Update 2013SEptEmbEr 2013
GLOBAL SAM
MANAGEMENT UPDATE
Summary of Findings
UNICEF NUtrItIoN, NEw York
unite for
children
DESIGN: ESTELLE KALP
uNiteD NatioNS chilDreN'S FuND
3 uNiteD NatioNS Plaza
New York, NY 10017, uSa
unite for
childrenYou can also read