TRAFFIC AND Market report - ON THE PULSE OF THE NETWORKED SOCIETY

Page created by Matthew Kelley
 
CONTINUE READING
TRAFFIC AND Market report - ON THE PULSE OF THE NETWORKED SOCIETY
TRAFFIC AND
Market report
ON THE PULSE OF THE NETWORKED SOCIETY

June 2012
TRAFFIC AND Market report - ON THE PULSE OF THE NETWORKED SOCIETY
CONTENTS
                                                                                  Mobile subscriptions update             4
                                                                                  Subscriptions outlook                   6
                                                                                  Subscriptions outlook: devices          9

                                                                                  Mobile traffic update                  12
                                                                                  Traffic development                    13

                                                                                  Coverage                               15
                                                                                  Smartphone users: network quality      16
                                                                                  Accelerating mobile content delivery   18

                                                                                  Traffic variations between networks    19
                                                                                  Traffic variations: data plan          23

The contents of this document are based on a number of theoretical dependencies
                                                                                  The signature of humanity              25
and assumptions and Ericsson shall not be bound by or liable for any statement,
representation, undertaking or omission made in this document. Furthermore
Ericsson may at any time change the contents of this document at its sole
discretion and shall not be liable for the consequences of such changes.          Key figures                            27

2 TRAFFIC AND MARKET REPORT JUNE 2012
TRAFFIC AND Market report - ON THE PULSE OF THE NETWORKED SOCIETY
Ericsson Traffic
and Market Report
June 2012

Everything is going mobile. This evolution is driven by video,
cloud-based services, the internet and machine-to-machine
(M2M) connectivity. It changes how people behave and how they
leverage mobility to communicate and to improve their daily lives,
through new and existing services. Users now demand connectivity
anywhere and anytime.                                                            About this report

Important driving forces include new affordable smartphones, and                 Ericsson has performed in-depth data
the many new connected devices on the market. The total number                   traffic measurements since the early
of mobile subscriptions globally (excluding M2M) will reach around               days of mobile broadband from a
9 billion in 2017, of which 5 billion will be for mobile broadband. With         large base of live networks covering
an increased number of subscriptions, evolved devices and 24/7                   all regions of the world.
connectivity to use them, we expect global mobile data traffic to grow
15 times by the end of 2017.                                                     The aim of this report is to
                                                                                 share analysis based on these
Access to the internet is a prerequisite and will drive further build-out        measurements, internal forecasts
of mobile networks. By 2017, an astonishing 85 percent of the world’s            and other relevant studies to provide
population will be covered by WCDMA/HSPA networks.                               insights into the current traffic and
                                                                                 market trends.
In today’s competitive markets, it is crucial to ensure best user
experience and provide differentiation. A recent consumer study shows            We will continue to share traffic and
that network coverage and speed are the most important factors for               market data, along with our analysis,
satisfaction with mobile services.                                               on a regular basis.

We invite you to share our enthusiasm in the insights this data offers.          Publisher: Douglas Gilstrap,
We hope you find it engaging and valuable.                                       Senior Vice President and
                                                                                 Head of Strategy, Ericsson

TRAFFIC                          12      SMARTPHONES                      16   STUDY                                19
Mobile data traffic                       Coverage and data                      Video represents
will grow 15 times                        speed drive customer                   the largest data
by 2017.                                  satisfaction.                          traffic volume.

                                                                                     JUNE 2012 TRAFFIC AND MARKET REPORT 3
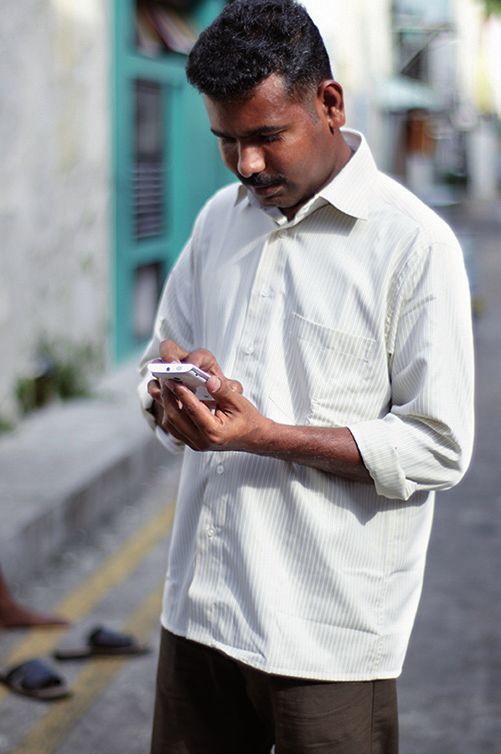
TRAFFIC AND Market report - ON THE PULSE OF THE NETWORKED SOCIETY
Mobile
subscriptions update
Figure 1: Subscriptions by region, Q1 2012
                                                                                                Net additions
                                                                                                                                                                             6.2
                                                                                                                                                                             Billion
                                                                                                                (millio
                                                                                                                       n)
                                                                                        2.3         5.9                                                                       total mobile
                                                                                                                               9.9                                            subscriptions
                                                                                                Mobile subs
                                                         18                                                   cripti
                                                                                                                     ons
                                                                                                                         (   mil
                                                                                                                                 li o
                                                                                 3 30                       5 40                        n)

                                                                                          ica     Western
                                                                                   h Amer
                                                                               Nort                         Euro
                                                                                                                pe
                                                     0
                                                65                 er
                                                                     ica                                                            Ce
                                                                                                                                      nt
                                                              Am                                                                        ra

                                                                                                                                                     60
                                                                                                                                          l
                                                         in

                                                                                                                                                        0
                                                                                                                                             &
                                                  t
                                                La

                                                                                                                                              Ea
                                                                                                                                                 s
                                                                                                                                                 te
                                                                                                                                                  nEr
                                                                                                                                                     uro

                                                                                                                                                                               39
                                                                                                                                                        pe
               30

                         6 80

                                  Africa

                                                                                                                                                             China

                                                                                                                                                                     1,000
                                          ast
                                     dle E
                           2 60

                                  Mid
                     6.3

                                                     C

                                                                PA
                                                              fA
                                                           sto
                                                         e                 R                                               Ind
                                                                                                                      ia
                                                        60
                                                     1,1                                                                           90
                                                                                                                               0
                                                                                                                                                  25

     170
                                                              29

       million

         net additions                                                             Source: Ericsson (June 2012)
         Q1 2012

 Figure 1

Mobile subscription figures are estimates as of Q1 2012. Mobile net                              The estimate of mobile net additions has been made based on
additions are estimates during Q1 2012. APAC = Asia Pacific.                                     historic information from external sources and regulatory and operator
                                                                                                 reports, combined with Ericsson analysis. Historical data may be
                                                                                                 revised when operators report updated figures.

4 TRAFFIC AND MARKET REPORT JUNE 2012
TRAFFIC AND Market report - ON THE PULSE OF THE NETWORKED SOCIETY
>	Global mobile penetration reached 87 percent                                   >	All WCDMA networks deployed worldwide have
    in Q1 2012 and mobile subscriptions now total                                     been upgraded with HSPA. Around 75 percent
    around 6.2 billion. However, the actual number of                                 of the HSPA networks worldwide have been
    subscribers is around 4.2 billion, since many have                                upgraded to a peak speed of 7.2 Mbps or above
    several subscriptions.                                                            and around 40 percent have been upgraded to
                                                                                      21 Mbps.
>	India and China accounted for approximately
   40 percent of the estimated 170 million net                                     >	Around 15 percent of HSPA networks now have
   additions during Q1 2012, adding around 25 and                                     speeds up to 42 Mbps in whole or parts of the
   40 million subscriptions respectively.                                             network following a wave of upgrades. Today, we
                                                                                      are already seeing evolutionary steps towards
>	Brazil (+10 million), Indonesia (+9 million), and                                  increasing speeds to well over a 100 Mbps.
   Bangladesh (+5 million) follow in terms of net
   additions.

>	Mobile subscriptions have grown around                                          Figure 2: Percentage of WCDMA networks upgraded to HSPA
                                                                                             and to 7.2, 21 and 42 Mbps respectively
   12 percent year-on-year and 3 percent
   quarter-on-quarter.
                                                                                       100
                                                                                                                                Source: Ericsson and
>	Mobile broadband subscriptions1 have grown                                                                                   GSA (Q1 2012)
   around 60 percent year-on-year and have reached                                      80

   1.1 billion.
                                                                                        60

>	There is continued strong momentum for                                          %
   smartphone uptake in all regions. Approximately                                      40

   35-40 percent of all mobile phones sold in Q1
   were smartphones, compared to around 30                                              20

   percent for the full year 2011. Only around
   10-15 percent of the worldwide installed base of                                      0
                                                                                             HSPA       HSPA 7.2      HSPA 21        HSPA 42
   subscriptions use smartphones, which means that
   there is considerable room for further uptake.

Figure 3: Mobile subscriptions penetration in Q1 2012

                 Western Europe 131%
       Central & Eastern Europe 125%
                    Latin America 109%
                      Middle East 101%
                   North America        93%
    APAC excluding China & India        91%
                             China      75%
                              India     73%
                             Africa     63%
                                                 Source: Ericsson (June 2012)

1
    Mobile broadband is defined as CDMA2000 EV-DO, HSPA, LTE, Mobile WiMAX and TD-SCDMA.

       Subscriptions vs subscribers                                             PCs/tablets and for mobile phones. In addition,
                                                                                it takes time before inactive subscriptions are
       There is a large difference between the number                           removed from operator databases. Consequently,
       of subscriptions and subscribers. This is due                            subscription penetration can easily reach above
       to the fact that many subscribers have several                           100 percent, which is the case in many countries
       subscriptions. Reasons for this could include                            today. It should however be noted that in some
       users lowering their traffic cost by using optimized                     developing regions, it is common for several people
       subscriptions for different types of calls, maximizing                   to share one subscription, having for example
       coverage, having different subscriptions for mobile                      a family or village phone.

                                                                                                           JUNE 2012 TRAFFIC AND MARKET REPORT 5
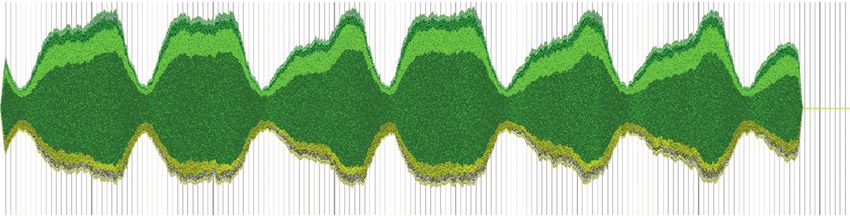
TRAFFIC AND Market report - ON THE PULSE OF THE NETWORKED SOCIETY
SUBSCRIPTIONS
OUTLOOK
Subscriptions development –                    Figure 4: Fixed and mobile subscriptions 2008-2017
fixed and mobile                                                        9,000
                                                                                 Source: Ericsson (June 2012)
By the end of 2011, total mobile
subscriptions reached around                                            8,000
6 billion and are expected to reach
around 9 billion by the end of 2017.                                    7,000
M2M will add to this figure.
                                                                        6,000
The number of mobile broadband
                                        Subscriptions/lines (million)

subscriptions reached close to
1 billion, and is predicted to reach                                    5,000

5 billion in 2017.
                                                                        4,000

      ~5
                                                                        3,000

      Billion                                                           2,000

         mobile broadband
                                                                        1,000
         subscriptions by
         the end of 2017
                                                                           0
                                                                                 2008 2009 2010 2011 2012 2013 2014 2015 2016 2017

PC and tablet mobile subscriptions                                              Mobile subscriptions            Mobile broadband      Mobile PCs/tablets
are increasing and are expected                                                 Fixed VoIP                      Fixed broadband      Fixed narrowband voice
to grow from around 200 million in
2011 and almost close the gap with                                              ‘Mobile broadband subscriptions’ is a sub-segment of
the number of fixed broadband                                                   ‘Mobile subscriptions’. ‘Mobile PCs/tablets’ is a sub-segment
subscriptions by 2017, totaling                                                 of ‘Mobile broadband subscriptions’.
around 650 million.

The number of fixed PSTN voice
subscriptions will continue
its downward trend as users                                             Users per fixed subscription
increasingly switch to mobile
                                                                        The number of fixed broadband users is at least three times
and VoIP substitutions.
                                                                        the number of fixed broadband connections, due to multiple
                                                                        usage in households, enterprises and public access spots.
                                                                        This is the opposite to the mobile phone situation, where
                                                                        subscription numbers exceed user numbers. In the latter
                                                                        years of the forecasting period, it is likely that the usage trend
                                                                        for mobile PCs will be similar to fixed broadband usage today,
                                                                        with several users per subscription. This is especially the case
                                                                        in developing markets where mobile access will be the main
Mobile PC: laptop or desktop PC                                         source of internet connection.
devices with built in 3G modem or
external USB dongle.

6 TRAFFIC AND MARKET REPORT JUNE 2012
TRAFFIC AND Market report - ON THE PULSE OF THE NETWORKED SOCIETY
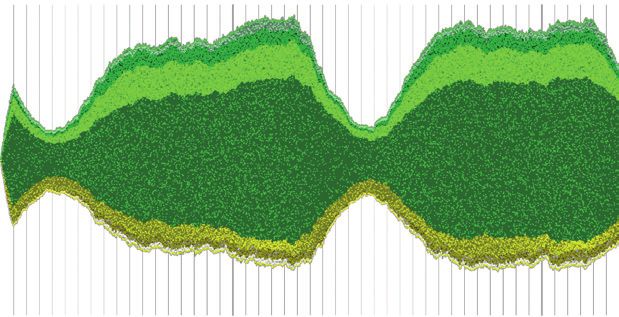
Mobile technology                           Figure 5: Mobile subscriptions by technology, 2008-2017

Figure 5 illustrates reported                                               10,000
                                                                                        Source: Ericsson (June 2012)
                                                                                                                                                                 LTE
mobile subscriptions by                                                      9,000                                                                               WCDMA/HSPA
technology. In this graph,                                                                                                                                       GSM/EDGE
                                         Reported subscriptions (million)

                                                                             8,000
subscriptions are defined by                                                                                                                                     TD-SCDMA
                                                                             7,000
the most advanced technology                                                                                                                                     CDMA
that the mobile phone and the                                                6,000
                                                                                                                                                                 Other
network are capable of.                                                      5,000

                                                                             4,000
GSM/EDGE will continue to
                                                                             3,000
lead in terms of subscription
numbers until the latter years                                               2,000
of the forecast period, despite                                              1,000
rapid HSPA subscriptions
                                                                                 0
growth today. This is                                                                2008   2009      2010     2011    2012   2013   2014   2015   2016   2017
because new low-end users
entering networks in growing
markets will likely use the
cheapest mobile phones
and subscriptions available.
In addition, it takes time to
                                                                                                             ~9
                                                                                                             Billion
upgrade the installed base of
phones. However, the rapid                                                                                     mobile
migration to more advanced                                                                                     subscriptions by
technologies in developed                                                                                      the end of 2017
countries means global GSM/
EDGE subscription numbers
will decline after 2012.
                                            Figure 6: Mobile subscriptions by region, 2008-2017
LTE is currently being deployed                                             10,000                                                                               LA
and built-out in all regions and                                                        Source: Ericsson (June 2012)
                                                                                                                                                                 NA
                                                                             9,000
will be used by around one
                                                                                                                                                                 APAC
                                   Reported subscriptions (million)

billion subscribers. These will                                              8,000
                                                                                                                                                                 CEMA
represent the high-end share                                                 7,000
                                                                                                                                                                 WE
of the total subscriber base                                                 6,000
by 2017.
                                                                             5,000

Regional growth                                                              4,000

                                                                             3,000
Figure 6 illustrates mobile
subscriptions in each region                                                 2,000

up until the end of 2017 and                                                 1,000
is characterized by steady                                                       0
growth. This is especially                                                           2008   2009      2010     2011    2012   2013   2014   2015   2016   2017
evident in the Asia Pacific
region where there are many
developing nations with strong
population and GDP growth.

                                                                                                                                       JUNE 2012 TRAFFIC AND MARKET REPORT 7
Regional technology maturity            Figure 7: Mobile subscriptions by technology and region 2011

By looking at each region and               100
                                                                                                                    LTE
comparing subscriptions in each                                                                                     WCDMA/HSPA
radio technology, it is easy to                                                                                     GSM/EDGE
                                             80
see the different maturity levels                                                                                   TD-SCDMA
between regions. Less mature                                                                                        CDMA
regions are dominated by 2G                  60                                                                     Other
technologies, like GSM/EDGE,

                                        %
while more mature regions like                                                                                  Source: Ericsson
Western Europe are dominated                 40
                                                                                                                (June 2012)

by HSPA. In North America,
LTE subscriptions have been
growing since 2011 and the                   20
region now has the majority of
global LTE subscriptions.
                                              0

North America is characterized                       NA           WE           APAC          LA        CEMA

by early growth in LTE, making
LTE, HSPA and CDMA of
approximately equal size in
2017, with GSM/EDGE no
longer present. The fast growth
in LTE subscriptions is driven
by the CDMA operators’ early            Figure 8: Mobile subscriptions by technology and region 2017
commitment to migrating to the              100
                                                                                                                    LTE
newer technology. Overall North
                                                                                                                    WCDMA/HSPA
American subscription growth is
                                                                                                                    GSM/EDGE
based on multiple subscriptions              80
                                                                                                                    TD-SCDMA
per individual – for example,
                                                                                                                    CDMA
adding a tablet – rather than
population growth.                           60                                                                     Other
                                        %

                                                                                                                Source: Ericsson
Latin America has a large GSM/                                                                                  (June 2012)
                                             40
EDGE subscriber base, which
will reach its maximum during
2012. The strong growth in
                                             20
subscriptions in this region will
be driven by GDP development.
In 2017, WCDMA/HSPA will                      0
be the dominant technology;                          NA           WE           APAC          LA        CEMA
however GSM/EDGE will still
have a significant presence.

As a mature market, Western Europe will show little                    plateau in 2012. Markets like Japan and Korea will
subscriptions growth in the years to come. What                        take up LTE subscriptions very early compared to
growth there is will come from an increasing number of                 late uptake in less developed countries. China will
connected devices. Subscriptions that have GSM/EDGE                    add substantial numbers in the latter years. LTE
as the highest technology are declining as end users are               subscriptions will cover both FDD and TDD.
upgrading their phone to more advanced HSPA models.
In 2017, LTE is expected to have penetrated around 25                  Central and Eastern Europe, the Middle East and
percent of the subscriptions base in Western Europe.                   Africa (CEMA) shows strong subscriptions growth
                                                                       driven by population and GDP growth. HSPA will
The Asia Pacific market will see a massive increase                    grow significantly, while LTE will be limited and take
in subscriptions. Leading up to 2017, 1.5 billion new                  place in the latter years. The CEMA region is diverse,
subscriptions will be added, driven by GDP and                         with mature countries showing patterns similar to
population growth. Almost half of subscriptions will                   Western Europe, whereas most African countries will
be GSM/EDGE at the end of the period, reaching a                       have completely different patterns.

8 TRAFFIC AND MARKET REPORT JUNE 2012
subscriptions
outlook: devices
Smartphones                                 Figure 9: Smartphones, PCs and tablets subscriptions with cellular connection, 2008-2017

Total smartphone subscriptions                                         4,000
                                                                                                                                           Mobile PCs
                                                                                 Source: Ericsson (June 2012)*                             and tablets
reached around 700 million in 2011 and
                                                                       3,500
are expected to reach around 3 billion                                                                                                     Smartphones
in 2017.                                    Subscriptions (millions)   3,000

Ericsson has identified several                                        2,500
smartphone operating systems that, on
average, are associated with high traffic                              2,000

volumes. These are referred to as High
                                                                       1,500
Traffic smartphones (HT smartphones).
HT smartphones are defined as a                                        1,000
subset of open-OS phones
(e.g. iPhone, Android & Windows).                                       500
These devices typically generate
5-10 times more traffic than low-traffic                                  0

devices. It is estimated that the HT                                            2008 2009 2010 2011 2012 2013 2014 2015 2016 2017

share reached around 50 percent at the                                         *Smartphone forecast from 2011.
end of 2011, and will represent the vast
majority in 2017.

Factors such as screen size, year of
device release and popularity among
high-end users have a stronger                                                 ~3
                                                                               Billion
correlation with the behavior of active
users generating more than 1 MB                                                 smartphone
of traffic per day on average. They                                             subscriptions by
therefore have a stronger effect on                                             the end of 2017
median traffic than the OS.

Data-heavy devices
Ericsson estimates that the total
subscriptions of data-heavy devices
will grow from around 850 million by
the end of 2011 to around 3.8 billion
in 2017. This includes smartphones,
mobile PCs and tablets with cellular
connectivity.

                                                                                                                 JUNE 2012 TRAFFIC AND MARKET REPORT 9
Mobile PC and tablet                              Figure 10: Mobile PCs and their share of subscriptions 2017
subscriptions                                             100
                                                                                                Wi-Fi/Ethernet PCs
In 2017, around one third of the
                                                                                                3G/4G PC with embedded
installed base of mobile PCs                                                                    modem, no subscription
                                                           80
is estimated to have a 3G/4G                                                                    3G/4G PC with embedded
subscription: the remaining will use                                                            modem, with subscription
Wi-Fi or ethernet. Some mobile                             60                                   3G/4G dongles
PCs with 3G/4G capability do not                                                                + PC with subscription

                                                      %
have an active mobile subscription.                                                        Source: Ericsson (June 2012)

                                                           40
At the same time, only around half
of tablets are expected to have
a 3G/4G modem built in. Some                               20
of those will not have an active
subscription. Note that in the traffic
measurements presented later                                0

in this report, only traffic on
3G networks is included, not
Wi-Fi traffic.
                                                  Figure 11: Tablets and their share of subscriptions 2017

Mobile broadband                                          100                                   Wi-Fi tablets
                                                                                                3G/4G tablets without
The Ericsson term mobile                                                                        subscriptions
broadband is defined by the                                80                                   3G/4G tablets with
device’s radio standard, and the                                                                subscriptions
prerequisite that the same standard                                                        Source: Ericsson (June 2012)
is available in a live network. This is                    60
a good measure for understanding
                                                      %

the uptake of new technologies
and it is easy to track.                                   40

Figure 12 illustrates mobile
                                                           20
broadband subscriptions, split
by region at the end of 2011. It
highlights the large share held by                          0
Asia Pacific and North America.

Figure 13 shows global mobile                     Figure 12: Mobile broadband subscriptions by region, 2011
broadband subscriptions
development. The majority of
                                                                                                                APAC
devices are, and will continue
                                                                                                                NA
to be, mobile phones. Mobile
broadband will gain a larger share                                                                              WE

of total broadband subscriptions                                                                                CEMA

in many markets, complementing                                                                                  LA

xDSL in certain segments and
                                                                                                          Source: Ericsson (June 2012)
replacing it in others. Mobile
broadband also includes some
feature phones, but this share is
decreasing over time.

 Mobile broadband

Mobile broadband is defined as CDMA2000 EV-DO, HSPA, LTE, Mobile WiMAX and TD-SCDMA. It includes mobile PCs,
tablets and mobile phones, both smartphones and feature phones. The vast majority is mobile phones.

10 TRAFFIC AND MARKET REPORT JUNE 2012
Figure 13: Mobile broadband subscriptions, 2008-2017

                           6,000
                                   Source: Ericsson (June 2012)
                           5,000

                           4,500

                           4,000
Subscriptions (millions)

                           3,500

                           3,000

                           2,500

                           2,000

                           1,500

                           1,000

                            500

                              0
                                    2008          2009            2010   2011   2012   2013      2014     2015    2016     2017

                                                                                              technology development expectations, documents
                            Forecast methodology                                              such as industry analyst reports, on a national or
                            Ericsson performs forecasts on a regular basis                    regional level, together with internal assumptions
                            to support internal decisions and planning as                     and analysis.
                            well as market communication. The subscription
                            and traffic forecast baseline in this report are                  Note that a large part of data traffic is generated
                            based on historical data from various sources,                    by a limited number of users in each device
                            validated with Ericsson internal data, including                  category. These users may considerably change
                            extensive measurements in customer networks.                      their usage if operators implement data volume
                            Future development is estimated based on                          caps or other traffic management schemes.
                            macroeconomic trends, user trends (researched                     Measures like this could significantly impact the
                            by Ericsson ConsumerLab), market maturity,                        traffic forecast.

                                                                                                                         JUNE 2012 TRAFFIC AND MARKET REPORT 11
Mobile traffic
update
Global traffic in mobile networks                       Figure 14: Global total traffic in mobile networks, 2007-2012

Figure 14 shows the total monthly traffic                                                                            800
                                                                                                                           Source: Ericsson (2012)
split for voice and data. It depicts a                                                                                                                                      Voice    Data
stable trend of data traffic growth with                                                                             700
some seasonal variations. Mobile data                   Total (uplink + downlink) monthly traffic (PetaByte/month)
subscriptions grow strongly, and drive
the growth in data traffic along with a                                                                              600

continuous increase in the average data
volumes per subscription.                                                                                            500

Mobile voice traffic continues to grow                                                                               400
at a steady rate mainly driven by new
subscriptions in Asia Pacific and Middle
East & Africa.                                                                                                       300

It should be noted that there are big                                                                                200
differences in traffic levels between
markets, regions and operators.
                                                                                                                     100
These measurements have been
performed by Ericsson over several                                                                                     0
years using a large base of live
networks that together cover all regions                                                                                   Q1 Q2 Q3 Q4 Q1 Q2 Q3 Q4 Q1 Q2 Q3 Q4 Q1 Q2 Q3 Q4 Q1 Q2 Q3 Q4 Q1
                                                                                                                           07 07 07 07 08 08 08 08 09 09 09 09 10 10 10 10 11 11 11 11 12
of the world. They form a representative
base for calculating world total traffic in
mobile networks2.

             2x
               mobile Data traffic
               almost doubled between
               Q1 2011 and Q1 2012

       >	Data traffic almost doubled
          between Q1 2011 and Q1 2012
       >	The quarterly growth between Q4
          2011 and Q1 2012 was 19%

2
    Traffic from 2G and 3G – does not include DVB-H, Wi-Fi, and Mobile WiMax.

12 TRAFFIC AND MARKET REPORT JUNE 2012
15x
Traffic                                                                                                                                   Mobile data

development
                                                                                                                                          traffic will
                                                                                                                                          grow ~15 times by
                                                                                                                                          the end of 2017

Traffic outlook                               Figure 15: Global mobile traffic: voice and data, 2010-2017

Overall mobile data is expected                                          10,000                                                                      Data:
                                                                                  Source: Ericsson (June 2012)
                                                                                                                                                     mobile PCs/tablets
to have almost doubled during
                                                                                                                                                     Data:
2011. Mobile PCs dominate traffic                                                                                                                    mobile phones
                                                                          8,000
in most mobile networks today,                                                                                                                       Voice
                                            Monthly PetaBytes (1015 B)

but smartphone traffic is growing
faster, due to high growth in                                             6,000
subscriptions. In the latter years,
data traffic will be split fairly equally
between mobile phones and                                                 4,000
mobile PCs and tablets.

Accessing the internet from mobile                                        2,000
devices will drive mobile traffic
development. Mobile data traffic
is expected to grow with a CAGR                                              0
of around 60 percent (2011-2017),                                                 2010      2011       2012      2013   2014   2015    2016   2017

driven mainly by video. This entails
growth of around 15 times by the
                                              Figure 16: Smartphone and mobile PC traffic per month and subscription 2011 and 2017
end of 2017.
                                                                            10                                                                       Smartphones
                                                                                  Source: Ericsson (June 2012)
Traffic per subscriber partly relates                                                                                                                Mobile PCs
to the screen size of the user’s
individual device. On average, a                                             8

mobile PC generates approximately
                                              GB/month/subscription

four times more traffic than a
                                                                             6
HT smartphone. By the end of
2011, an average mobile PC
generated approximately 2 GB per
                                                                             4
month versus 500 MB per month
produced by HT smartphones. An
average smartphone generates                                                 2
around half of the volume of an HT
smartphone. By the end of 2017, it
is estimated that a mobile PC will                                           0
generate 8 GB per month, and a                                                                  2011                            2017
smartphone just above 1 GB.
                                              Traffic refers to aggregated traffic in mobile access networks. DVB-H and Mobile WiMax
Note that there are large                     or Wi-Fi traffic have not been included. M2M traffic is not included.
differences between user patterns
on different networks, markets and
user types. See results from live
network measurements covering                                             Data revenues
different types of devices, OS and                                        Mobile data revenue continues to increase while exhibiting
regions on page 19.                                                       considerable variations. On average it represents around 35
                                                                          percent of mobile operator service revenue. This figure includes
                                                                          SMS revenues, however the main bulk of the increase is generated
                                                                          from data traffic.

                                                                                                                               JUNE 2012 TRAFFIC AND MARKET REPORT 13
Regional mobile traffic variations       Figure 17: Mobile traffic by region and type, 2011

By looking at each region in figure             100                                                             Data: mobile PCs/tablets
17 and comparing the traffic                                                                                    Data: mobile phones
generated from different device                                                                                 Voice
                                                 80
types, it is easy to see the diverse
maturity levels between regions.                                                                          Source: Ericsson (June 2012)
In 2011, regions with high voice
                                                 60
usage per subscription, such as
Asia Pacific and North America,
                                           %

had a high share of the total traffic.           40
North America and Western Europe
have a significantly larger share
of total traffic volume than their               20
subscription numbers alone would
imply, due to the high penetration
of 3G/4G networks, as well as that                0
of PCs, smartphones and tablets.                        NA        LA       WE        CEMA     APAC
The Asia Pacific region has the
largest amount of generated traffic
in absolute volumes.                     Figure 18: Mobile traffic by region, 2011

Voice traffic growth will remain
at a steady level, whereas data                                                                  APAC
traffic will increase strongly. By                                                               NA
2017, voice traffic volumes will be                                                              WE
very small compared to data traffic                                                              CEMA
volumes in all regions. As seen in                                                               LA
figure 18 and 19, Asia Pacific is
expected to increase its share of                                                             Source: Ericsson (June 2012)

global volume from around one
third today to almost 50 percent
in 2017.

                                         Figure 19: Mobile traffic by region, 2017

       20x
                                                                                                  APAC
                                                                                                  NA
                                                                                                  WE
           Mobile data traffic                                                                    CEMA
           for smartphones                                                                        LA
           will grow ~20 times
           by the end of 2017                                                                 Source: Ericsson (June 2012)

14 TRAFFIC AND MARKET REPORT JUNE 2012
85%
Coverage                                                                                                                                      WCDMA/HSPA
                                                                                                                                              population
                                                                                                                                              coverage in 2017

Coverage of the world’s mobile                     Figure 20: Technology coverage, 2011 and 2017
networks is constantly increasing as                                      100
more base stations are deployed. GSM/                                                    >90%
                                                                                                                                     Source: Ericsson (2012)

EDGE technology has by far the widest                                           >85%                            85%

reach and today covers more than                                           80                                                                                  Rural
85 percent of the world’s population.

                                                                                                                                                                          World population distribution
                                                  % population coverage

Geographically, only rural areas remain
to be covered by GSM/EDGE.                                                 60                                                                          55%
                                                                                                                                    50%     >50%
                                                                                                    >45%                                                       Sub-
WCDMA/HSPA covered over                                                                                                                                        urban
45 percent of the population by the                                        40

end of 2011, but is now accessible by
50 percent. There are more densely
                                                                           20                                                                                  Urban
populated areas lacking WCDMA/HSPA
coverage. Further build-out of WCDMA/                                                                                    5%
                                                                                                                                                               Metro
HSPA coverage will be driven by the                                         0
availability of affordable smartphones                                          2011     2017       2011       2017      2011    2017       2011       2017
and the surge in mobile broadband
services and faster speeds, as well as                                          GSM/EDGE           WCDMA/HSPA                 LTE               CDMA

regulator requirements to connect the
unconnected. By 2017, an estimated 85              Figure 21: Traffic generation per area, 2017
                                                                                                                                     Source: Ericsson (2012)
percent of the world’s population will                                    100                                                                                     Rural
have the opportunity to access
                                                                                                                                                                  Suburban
the internet using WCDMA/HSPA
                                                                           80                                                                                     Urban
networks3.
                                                                                                                                                                  Metro
                                                  % population

Today, the combined 2G and 3G                                              60

population coverage for CDMA is
estimated to be above 50 percent.                                          40
CDMA coverage is expected to grow
slightly since most large CDMA                                             20
operators have announced a migration
plan to LTE.
                                                                            0
                                                                                             Estimated 2017                                  Estimated
LTE rollout                                                                            world population distribution                         2017 traffic

Several major operators have                       * Metro: > 4,000 people/sq km                                       Urban: 1,000-4,000 people/sq km
                                                   Suburban: 300-1,000 people/sq km                                    Rural: < 300 people/sq km
started LTE deployments, but in
terms of population coverage there
is a long way to go. In February,             Effects of urbanization
LTE was estimated to cover 325
                                              Urbanization is a major global trend. Figure 21 shows that by 2017, over
million people globally. In five
                                              30 percent of the world’s population are expected to live in metro and
years, it is expected that LTE will
                                              urban areas. These areas represent less than 1 percent of the Earth’s
cover around 50 percent of the
                                              total land area, yet are set to generate around 60 percent of mobile traffic
population.
                                              by 2017.

                                              In these areas, heterogeneous networks will complement macro network
3
 The figure refers to population coverage     improvements, serving the traffic and providing good coverage and high
of each technology. Other factors, such as
access to devices, are also needed in order   quality user experience. In less-densely populated areas the focus will be
to utilize the technology.                    on building cost-effective coverage and capacity.

                                                                                                                                JUNE 2012 TRAFFIC AND MARKET REPORT 15
Smartphone users:
Network quality
The growth of smartphones has been tremendous.
40 percent of the world’s smartphone users access
internet and apps even before getting out of bed.                Study background
Once out of bed, internet and apps are used almost               Ericsson’s ConsumerLab has performed a
constantly, peaking during the daily commute with                smartphone user network satisfaction survey
70 percent usage.                                                in two mature mobile broadband markets with
                                                                 different characteristics:
Smartphone users are developing new internet                     the Netherlands and Finland.
access habits at a tremendous speed in many
new localities and we have studied their evolving                The survey was administered online and the
perception of network quality. 51 percent of                     sample size was 1,000 3G smartphone users
smartphone users are very satisfied with their                   aged 18-69 per country who use
operator’s network and only 3 percent are outright               apps or access the internet more than
dissatisfied, leaving almost half in a position where            once a week.
their satisfaction could easily be improved.

          47%                                              Figure 22: Experience of smartphone usage problems
                                                                  40
                                                                       Source: Ericsson
              perceive a slow network                                  ConsumerLab (2012)
              to be the most common                               35
              cause of smartphone
              internet usage issues                               30

                                                                  25
There is intensive smartphone use during
                                                                  20
                                                             %

commuting, yet at the same time, features such as
subways and tunnels create obstacles to internet
                                                                  15
access. It may come as no surprise therefore, that
around half of all smartphone users experience                    10
internet access issues on a weekly basis, according
to our recent Ericsson ConsumerLab study.                          5

                                                                   0
When issues do occur they are perceived to be
irritating, and the frequency of the issues is in itself                   Daily            Weekly   Less often   Never

a cause of frustration for some. Medium to high
network satisfaction levels indicate that users accept
some issues today, but also expect improvements in
the near future.

16 TRAFFIC AND MARKET REPORT JUNE 2012
User perceptions                                        Figure 23: Responsibility for internet access problems

Ericsson’s new smartphone user network satisfaction             50
                                                                                                                       Netherlands
study in Finland and the Netherlands indicates that                                                                    Finland
as users are maturing, they have stronger opinions
                                                                40
on what causes different issues. There is therefore a                                                          Source: Ericsson
greater focus on improving factors which affect the                                                            ConsumerLab (2012)

user experience.                                                30

A slow mobile network is perceived to be the most
                                                         %
common cause to smartphone usage issues, stated                 20
by 47 percent of the sample, or more specific per
country, 56 percent in Finland and 37 percent in the
Netherlands.                                                    10

Users also perceive the network to be the main
contributor to internet access problems. One third of            0
Finnish smartphone users and 47 percent of Dutch                       Carrier   Application Handset      Content      Don’t know
                                                                                  provider manufacturer   provider
smartphone users hold the carrier responsible for
internet connectivity problems.

Coverage and data speed drive satisfaction                           A competitive advantage can
Coverage where people need it and a fast and                         be generated by improving
reliable connection to the internet are “must haves”
for smartphone users and are the strongest drivers                   consumer network satisfaction
of satisfaction. This reflects the need to constantly
be connected and to have a positive smartphone
                                                        Figure 24: Correlation between satisfaction with features
experience.                                                         and overall satisfaction

Providing an excellent network with great coverage             0.6
                                                                                                                       Netherlands
and data speed where apps run smoothly, is                                                                             Finland
essential to satisfying users and standing out from            0.5
the competition.                                                                                               Source: Ericsson
                                                                                                               ConsumerLab (2012)

                                                               0.4
Satisfied users make recommendations
Whereas half of all users are very satisfied with
                                                               0.3
their carriers, there is an opportunity to generate
competitive advantage by improving consumer
network satisfaction for users who experience                  0.2

internet access issues. If problems occur more
than once a week, then overall satisfaction with the           0.1
network significantly declines. Analysis shows that
highly satisfied subscribers will generate good word
                                                                 0
of mouth, so this may be a worthwhile opportunity.
                                                                     3G mobile  High      Price     Clarity      Data    Content
                                                                      network speed 3G    plan     of voice   allowance and apps
                                                                      coverage mobile                calls               available
                                                                               network

                                                                                         JUNE 2012 TRAFFIC AND MARKET REPORT 17
Accelerating
                                                                                                                                      Accelerated
                                                                                                                                      content
                                                                                                                                      loads up to

mobile content                                                                                                                                70%faster

delivery
As content delivery over mobile networks is rapidly                                         One way of enhancing the user experience is to
growing, it is becoming increasingly important to                                           accelerate content delivery through a combination
secure quality of experience end-to-end, from the                                           of internet optimization and mobile prioritization.
content server across the fixed internet, and the
mobile network to the mobile device.                                                        The effect of this is threefold; it provides shorter
                                                                                            average page load times, a more consistent user
Coverage and speed are the biggest drivers of                                               experience and page load failures are largely
network satisfaction (see page 17). Improving                                               avoided. Being able to provide a consistently good
these will have the most positive impact on user                                            user experience has a direct effect on a content
satisfaction and improve both the operator and the                                          provider’s business value through increased
content provider’s business. For a content provider, a                                      conversion rates and brand perception.
one second delay in page load time can result in lost
conversions4, fewer page views and a decrease in                                            Figure 25 shows measurements from a commercial
customer satisfaction.                                                                      mobile broadband (HSPA) network. The dark blue line
                                                                                            represents page load times for content downloaded
                                                                                            from a content provider’s web server (origin) to a
                                                                                            mobile device, and the light blue line shows page
                                                                                            load times for the same content when the delivery is
Content                                                                         Device
 server                                                                                     accelerated end-to-end. Page load times for
                                                                                            non-accelerated content varies greatly over the five
                                                                                            day period due to variation in radio network load,
                                                                                            while the accelerated content is less affected. Page
                          Internet acceleration        Mobile prioritization
                                                                                            load times are, for the accelerated content, shorter
                                                                                            on average and a more consistent experience is
                                                                                            provided. In this measurement, the accelerated
                                  QoE measured and secured end-to-end
                                                                                            content downloads up to 70 percent faster.
                       Quality of Experience is secured end-to-end through a
                       combination of content acceleration through the fixed                4
                                                                                             The conversion rate is the ratio of visitors who convert
                       internet and content prioritization in the mobile network.
                                                                                            website visits into desired actions e.g. purchase of product.

Figure 25: Page load time with/without end-to-end acceleration

                  60
                                                                                                                                    Source: Ericsson & Akamai (2012)
                         –– With Mobile Cloud Accelerator
                  50     –– Without Mobile Cloud Accelerator

                  40
 Page load time

                  30

                  20

                  10

                  0
                                  Day 1                         Day 2                    Day 3                      Day 4                         Day 5

18 TRAFFIC AND MARKET REPORT JUNE 2012
Traffic variations
between networks
     Traffic pattern analysis
     New devices and applications affect mobile networks. Having a deep and up-to-date knowledge of the
     traffic characteristics of different devices and applications is important when designing, testing and
     managing mobile networks. Ericsson regularly performs detailed traffic measurements in all major regions
     of the world. The measurements in this section were made in a selected number of live commercial
     WCDMA/HSPA networks in Asia, Europe and the Americas.

Variations observed in mobile traffic patterns are                       >	The overall quality of the network, speed
dependent on many, often interacting, factors.                              and latency.
Some of the most significant ones are:
                                                                         >	Price plans and penetration of fixed broadband
>	The data plan (price and allowance) affects user                         networks. When the primary access to the internet
   behavior. Low prices drive up user numbers and                           is via mobile access it drives usage upwards.
   a larger data allowance typically drives higher
   volume per user.                                                      Ericsson traffic
>	Video often represents the largest share of total                     measurements show that
   traffic. The availability of video content in the
   respective market has a major impact on traffic
                                                                         there is no typical network
   patterns in all networks. Common examples                             In the coming sections traffic characteristics are
   are Video On Demand services, such as Netflix                         examined one factor at a time. These measurements
   and Hulu, as well as a multitude of TV channels                       clearly show that there are major differences between
   (typically local to the market) available free on                     the networks depending on these factors.
   the internet.

>	Device type, screen size and resolution.

> T
   raffic management – this is regulated by each
  country’s authorities, however, it also represents
  a strategic decision for the operator. For example,
  operators can manage P2P file sharing in different
  ways by either allowing it, forcing it to low traffic
  hours, or not allowing it.

 Traffic variation figures
                                                                             Largest average value, measured in one of the networks

The results show that there is a big difference between the individual       Average value of the measured networks’ average values
networks measured in this chapter. The graphs therefore reflect this
broad spread of data by showing the average values of the different
measured networks.                                                           Smallest average value, measured in one of the networks

                                                                                                 JUNE 2012 TRAFFIC AND MARKET REPORT 19
Traffic variations – devices                Figure 26: Penetration and share of total mobile traffic volume
                                                        per device in different networks, measured in bytes
There are major differences in how
much traffic various devices generate in               100
different mobile networks.                                   Source: Ericsson (2011, 2012)                                                Device
                                                                                                                                          penetration
                                                       80
Figure 26 shows penetration and share                                                                                                     Traffic
of total traffic volume for different                                                                                                     volume
                                                                                                                                          shares
device types (see legend at the                        60

bottom of the page for information
                                            %

on how to read the graph). In some                     40
European networks, traffic from
mobile PCs dominate, while in North                    20
America smartphone traffic is typically
predominant. The penetration of
                                                        0
mobile PCs differs between around                              3G router        Mobile PC      Tablet     Mobile phone     M2M
1-16 percent in the measured
networks. Mobile PCs users create
approximately 8-88 percent of total
traffic in the measured networks. One       Figure 27: Average monthly mobile traffic volume per
                                                        subscription and device in different networks
reason for the variation is the different
focus operators have had on PC and
smartphone segments. Operators that                     18
                                                             Source: Ericsson (2011, 2012)
launched mobile broadband early,                        16
typically successful in selling dongle
                                                        14
subscriptions, often have a large share
of PC subscribers. In some markets                      12

it is still the dominant segment due to
                                            GB/month

                                                        10
late proliferation of smartphones and a
general strategy to target households                    8

with DSL replacement offerings.                          6

Figure 27 shows the spread of average                    4

monthly data traffic per subscription                    2
and device type in the different
                                                         0
measured networks. The largest spread                          3G router         Mobile PC     Tablet      Mobile phone     M2M
can be observed in 3G routers (1-16 GB
per month). For PCs, the variation is
also large (1-7 GB per month) followed      3G router: WLAN router with built-in HSPA Tablet: portable tablet computers with
by tablets (300-1600 MB per month) and      uplink interface rather than a connection to touch screen display (e.g. iPad, Galaxy Tab).
                                            a fixed network.                             Mobile phone: any mobile phone, including
mobile phones (30-230 MB per month).
                                            Mobile PC: laptop or desktop PC              both smartphones and feature phones.
                                            devices with built in 3G modem or            M2M: machine to machine devices
The observed M2M traffic is very            external USB dongle.                         (e.g. vehicle tracking, fleet management,
small, with an average volume                                                                     security surveillance, remote monitoring).
below 10 MB per subscription in all
measured networks. The M2M share                                                 Largest average value, measured in one of the networks
of mobile networks often include low
data applications such as security                                               Average value of the measured networks’ average values
surveillance, fleet management, and
Point Of Sale terminals.
                                                                                 Smallest average value, measured in one of the networks

20 TRAFFIC AND MARKET REPORT JUNE 2012
Traffic variations – mobile phone           Figure 28: Average monthly traffic volume per subscription for different mobile
                                                        phone operating systems in different networks
operating systems
Figure 28 shows the spread in average                               1,600
                                                                            Source: Ericsson (2011, 2012)
traffic volume per subscription between                             1,400
measured networks. iPhone5 and
                                                                    1,200
                                            MB/month/subscription
Android smartphones represent the
largest traffic volumes per subscription.                           1,000
One reason for the wide spread is
                                                                     800
the difference in data plans offered
to the users (see page 23). Android                                  600

models have a greater variance due                                   400
to a larger diversity of device models.
In networks where high-end models                                    200

dominate, average usage on Android                                     0
devices can exceed average iPhone                                             iPhone       Android           Windows      Symbian     Blackberry   Feature
                                                                                          smartphone        smartphone   smartphone   smartphone    phone
usage. However, when operators focus
on the low-end Android segment the
average usage is usually smaller than
for iPhones.                                Figure 29: Penetration and share of total mobile phone traffic volume for
                                                        different operating systems in different networks, measured in bytes

There are large differences between                                  100
traffic volume of phones with                                               Source: Ericsson (2011, 2012)                                                    Operating
different versions of Windows OS,                                                                                                                            System
                                                                      80                                                                                     penetration
hence average values might increase
                                                                                                                                                             Traffic
significantly in the future when Windows                                                                                                                     volume
                                                                      60
8 becomes dominant.                                                                                                                                          shares
                                             %

Figure 29 shows penetration and                                       40

share of total traffic volume for the
different mobile phone OS types.                                      20
iPhones represent, on average, nearly
50 percent of the total mobile phone                                    0
traffic in the measured networks. The                                         iPhone       Android           Windows      Symbian     Blackberry   Feature
reason is the relatively high average                                                     smartphone        smartphone   smartphone   smartphone    phone

usage per subscription coupled with
high penetration. The variance between
measured networks is high, ranging
from a few percent to nearly 80 percent
of the total traffic volume for iPhones.

5
    The iPhone OS is called iOS.

                                                                                                Largest average value, measured in one of the networks

                                                                                                Average value of the measured networks’ average values

                                                                                                Smallest average value, measured in one of the networks

                                                                                                                           JUNE 2012 TRAFFIC AND MARKET REPORT 21
Traffic variations – applications                                                                 There are also large differences between networks
                                                                                                  and regions regarding P2P file sharing. Explanations
Figure 30 shows average monthly traffic volume
                                                                                                  include cultural differences, availability of other
per subscriber for mobile PC devices and how it
                                                                                                  content distribution types and legal constraints.
varies between the measured operators in Asia and
                                                                                                  Differences between data plans and traffic
Europe. HTTP video represents the largest volume
                                                                                                  management functions implemented by operators
per subscriber. There are differences in how HTTP
                                                                                                  can have an effect.
video applications behave and load the networks.
Applications like Hulu and Netflix use adaptive bit                                               Video represents the largest
rates, which means they use as much bandwidth as
possible in order to maintain the highest possible                                                data traffic volume
quality at any given moment. YouTube and some
                                                                                                  P2P file sharing is typically used by rather small
similar applications use the bit rate that the user
                                                                                                  groups of users, but can account for a large share of
selects, starting by default at the lowest possible
                                                                                                  the total traffic volume. These measurements were
bit rate.
                                                                                                  made in mobile networks, but P2P file sharing is
                                                                                                  more prevalent on fixed networks, where speeds are
The biggest difference between Europe and Asia
                                                                                                  normally higher and data plans less restrictive.
is in the usage of peer-to-peer (P2P) TV, which has
become a common form of TV distribution in some
Asian countries.

Figure 30: A
            verage monthly mobile application traffic volume per subscription
           for mobile PC, in different networks

                        2,000
                                Source: Ericsson (2011, 2012)                                          Europe
                                                                                                       Asia
                        1,500
MB/month/subscription

                        1,000

                         500

                           0
                                  Web browsing           HTTP video   P2P TV   P2P file sharing

                                                                                                      Largest average value, measured in one of the networks

                                                                                                      Average value of the measured networks’ average values

                                                                                                      Smallest average value, measured in one of the networks

         Video definition

Both HTTP video and P2P TV are types of online video where the user watches the film while it is being downloaded (streamed). In the case of
P2P file sharing the user first downloads the entire file, most often a movie, and watches it offline. Examples of applications that use HTTP are
YouTube, Hulu, Netflix, and BBC iPlayer. An example of P2P TV is PPStream.

22 TRAFFIC AND MARKET REPORT JUNE 2012
Traffic variations:
 data plan
 As described in the previous section, there are                                                 What is often overlooked is that a high volume user
 several factors which have an impact on traffic                                                 will tend to switch to the newest device model upon
 patterns. Data plans are one of the most important.                                             its release. Therefore this increase in usage can be
 This section focuses on the measureable effects                                                 attributed to both the new device and the subscriber
 relating to data plans in a selected mature                                                     segment it has attracted.
 3G network.
                                                                                                 It is not uncommon for average usage to decrease
 Variations by phone model and data plan                                                         over time for any given device model, as proliferation
                                                                                                 in the market increases and more regular users
 Figure 31 shows how the average monthly volume
                                                                                                 transfer to the device. Usage patterns are also
 per subscription varies by data plan as well as by
                                                                                                 related to the data plan that comes with a device.
 mobile phone model for a specific brand.
                                                                                                 Figure 31 shows that the traffic generated from an
                                                                                                 existing mobile phone model can be higher than
 When a new device is released, there are sometimes
                                                                                                 that of a brand new one, due to differences in the
 dramatic headlines in the media focusing on the
                                                                                                 subscriber’s data plan. The user’s choice of specific
 enormous increase in usage that some new devices
                                                                                                 phone model can also be dependent on the voice
 seem to generate.
                                                                                                 plan. As a result, the proliferation of different devices
                                                                                                 is also dependent on the voice plan connected to the
                                                                                                 device at the point of sale.

 The data plan is one of the most
 important factors determining
 level of traffic usage

 Figure 31: A
             verage monthly traffic volume per data plan
            per smartphone model, from the same vendor

                        800                                                         500 MB
                              Source: Ericsson (2011, 2012)
                                                                                        2 GB
                                                                                    data plan
                        700                                                         1 GB

                        600                                                         2 GB
                                                                                        1 GB
                                                                                    data plan

                                                                                    data plan
MB/month/subscription

                        500                                                             500 MB
                        400

                        300

                        200

                        100

                          0
                              Model A         Model B         Model C    Model D
                              released        released        released   released
                                2008            2009            2010       2011

                                                                                                                       JUNE 2012 TRAFFIC AND MARKET REPORT 23
Traffic variations by application and data plan                                              Both web browsing and P2P file sharing usage
                                                                                                remain fairly constant within the same data plan
   Figure 32 shows the variation of a subscriber’s
                                                                                                between Q1 and Q4, while online video has increased
   average monthly traffic volume for different
                                                                                                dramatically. The explanation for this can be found
   applications for mobile PC devices. It is measured
                                                                                                by looking at time spent online against the amount
   at two different occasions during 2011 in one
                                                                                                of data generated in a specific time period. There are
   selected network.
                                                                                                limitations on the time an individual can spend on
                                                                                                each application. With low bandwidth applications,
   Video traffic is still increasing                                                            such as web browsing, this limitation quickly becomes
                                                                                                visible within the package data allowance.
   As an example, a user on a data plan of around
   15 GB consumed on average 2.3 GB per month of
                                                                                                Therefore, we observe a saturation of traffic from that
   online video in Q1, while in Q4 this figure was
                                                                                                type of application. Video has yet to reach its peak.
   3.5 GB per month.
                                                                                                An example of this is online video with higher bit rates
                                                                                                becoming available from YouTube. Another reason
   The monthly subscriber traffic from applications
                                                                                                is that improved video quality, and increased screen
   such as online video and web browsing both reach
                                                                                                sizes facilitate looking at longer clips or watching for a
   saturation points, although at different levels. At the
                                                                                                longer time. The increasing availability of content also
   same time, P2P file sharing keeps increasing with the
                                                                                                has an impact.
   monthly data plan allowance.

   Figure 32: Average monthly traffic volume per application, per subscription, as a function of data plan

                        5
                                Source: Ericsson (2011, 2012)

                        4
GB/month/subscription

                        3

                        2

                        1

                        0

                            0                             5            10                      15                  20                        25

                                                                       User monthly data plan (GB)

                                                HTTP video (2011 Q1)             Web browsing (2011 Q1)                 P2P file sharing (2011 Q1)

                                                HTTP video (2011 Q4)             Web browsing (2011 Q4)                 P2P file sharing (2011 Q4)

                            In these measurements, the majority of users are on medium data plans between 2-5 GB/month.
                            In Q4 higher data plans were available.

   24 TRAFFIC AND MARKET REPORT JUNE 2012
In co-operation with

The signature
of humanity
                                                           The top 9 categories in descending order are video
                                                           playback, web browsing, file sharing, file download,
     INTRODUCING MIT                                       social networking, media playback, software update,
     The MIT Senseable City Lab studies                    audio playback and email.
     the relationship between cities, new
     technologies and people. The Lab draws                From the 12 datasets provided, 8 were selected that
     on diverse fields to deliver research and             spanned at least 7 consecutive days, and displayed
     applications that empower citizens to make            the aggregated traffic consumption from this period.
     choices and create a more liveable urban
     condition. Carlo Ratti is the Director of the         Each graph follows a classic stacked area chart.
     Senseable City Lab, Pedro Cruz PhD Visiting           The height aligns with symmetrical categories; other
     Student and Prudence Robinson Partner                 applications stack alternatively above or below (figure
     Strategist and Research Fellow.                       A). This primitive visualization style is adequate for
                                                           this concrete type of data since it visually depicts
                                                           a flow, resulting in an almost asymmetrical form. A
                                                           different color is assigned to each category with the
                                                           following stacking order shown in figure B.
Pedro Cruz, Prudence Robinson, Carlo Ratti
                                                           Figure B: Application stacking order
Global data from cell phone networks provides
unprecedented glimpses into the fabric of society
and pulse of our planet. The MIT Senseable City
Lab received 12 anonymous datasets from Ericsson               Audio playback
corresponding to 12 networks from 3 different                  Media playback
continents and consisting of 33 GB of data. These
                                                               File download
sets refer to data traffic over the networks and
consist of connection time per user, amount of traffic         Web browsing
consumed during that period and, where available,              Video playback
the software used and the type of activity.
                                                               File sharing
The Senseable City Lab studied how data is                     Social networking
consumed over these networks, while establishing               Software update
a time-based narrative. Additionally, the inclusion
                                                               Email
of the activity type shows how the traffic is used.

Figure A: Single operator in Asia

              SAT                   SUN      MON         TUE                  WED                 THU                FRI

                                                                                     JUNE 2012 TRAFFIC AND MARKET REPORT 25
In co-operation with

The noon and midnight of each day are             Figure C: Traffic consumption profiles of Northern Europe
marked with a sun and moon respectively,          (top) and South America (bottom)
as well as the corresponding week day.                   WED         THU          FRI        SAT         SUN         MON            TUE

Each vertical line marks one hour as seen
in figures C and D.

Figure C has highly distinguishable features
where the differences between the maxima
and minima hours are clearly noticeable. It
is also interesting to observe how the main
categories of traffic oscillate; video playback          THU         FRI          SAT        SUN         MON         TUE            WED

and web browsing are good examples
of this. Software updates can generate
considerable traffic at night. The traffic
profiles do not undergo major changes
during weekends.

The graphs consist of dots of varying
brightness. Each dot represents 200 users,
consuming traffic of a certain category
                                                  Figure D: Close-up of a specific network showing differences in texture density
at that moment. This approach enables a
comparison to be made between the ratio of                                      SAT                                        SUN

connected users and the traffic consumed
per category over time. This is clearly shown
in figure D.

It can be argued that the density of web
browsing is higher than the density of file
sharing which is higher than the density of
video playback. This means, for example,
that a user consuming video playback
consumes more in quantity than a web
browsing user.

The final artifact visualizes the consumption
patterns of all 8 networks combined. The
scale has been modified in order to maintain
legibility, each dot represents 800 users
and the vertical consumption scale has            Figure E: Stacked area chart of collated networks
been quadrupled. When the distinctive
consumption patterns of each artifact are
merged, their differences dissolve and
create a cyclical pattern that demonstrates
an almost constant periodicity in time and
volume: the signature of humanity.

26 TRAFFIC AND MARKET REPORT JUNE 2012
Key figures

Mobile subscription essentials                             2011         2012           2017          CAGR 2011-2017            Unit
Worldwide mobile subscriptions                             6,000        6,700         8,900                  7%
      – Smartphone subscriptions                            700         1,000         3,100                  30%
		          – HT smartphones                                350				                                                          millions
      – Mobile PC & tablet subscriptions                    200          250           650                  25%
     – Mobile broadband subscriptions                      1,000        1,400         5,100                 30%

Mobile traffic essentials                                  2011         2012          2017           CAGR 2011-2017            Unit
     – Monthly traffic/smartphone                           250          350          1,100                 30%
            – Monthly traffic/HT smartphone                 450
     – Monthly traffic/PC                                  2,000        2,500         8,000                 25%             MB/month
     – Monthly traffic/tablet                               650          850          3,200                 30%
Monthly traffic/fixed broadband connection                 35,000      50,000        140,000                25%

Traffic growth		 Multiplier 2011-2017		                                                              CAGR 2011-2017
All mobile data		                                                        15		                               60%
     – Smartphones		                                                     20		                               65%
     – PC		                                                              10		                               50%
     – Tablets		                                                         75		                               100%
Fixed broadband		                                                         5		                               30%

 Glossary

2G: 2nd generation mobile networks                                  M2M: Machine-to-Machine
3G: 3rd generation mobile networks                                  MB: MegaByte
APAC: Asia Pacific                                                  Mbps: Megabits per second
CAGR: Compound Annual Growth Rate                                   Mobile PC: (See page 6)
CDMA: Code Division Multiple Access                                 NA: North America
CEMA: Central and Eastern Europe, Middle East and Africa            OS: Operating System
DSL: Digital Subscriber Line                                        P2P: Peer-to-Peer
EDGE: Enhanced Data Rates for GSM Evolution                         PetaByte: 1015 Bytes
GB: GigaByte                                                        PSTN: Public Switched Telephone Network
GDP: Gross Domestic Product                                         TD-SCDMA: Time Division Synchronous Code Division Multiple Access
GSM: Global System for Mobile Communications                        VoIP: Voice over IP (Internet Protocol)
HSPA: High Speed Packet Access                                      WCDMA: Wideband Code Division Multiple Access
HT: High Traffic                                                    WE: Western Europe
LA: Latin America                                                   xDSL: Various technologies for DSL
LTE: Long-Term Evolution

                                                                                                 JUNE 2012 TRAFFIC AND MARKET REPORT 27
Ericsson is the world’s leading provider of communications
technology and services. We are enabling the Networked Society
with efficient real-time solutions that allow us all to study, work and
live our lives more freely, in sustainable societies around the world.

Our offering comprises services, software and infrastructure within
Information and Communications Technology for telecom operators
and other industries. Today more than 40 percent of the world’s
mobile traffic goes through Ericsson networks and we support
customers’ networks servicing more than 2.5 billion subscribers.

We operate in 180 countries and employ more than 100,000
people. Founded in 1876, Ericsson is headquartered in Stockholm,
Sweden. In 2011 the company’s net sales were SEK 226.9 billion
(USD 35.0 billion). Ericsson is listed on NASDAQ OMX, Stockholm
and NASDAQ, New York stock exchanges.

The content of this document is subject to revision without
notice due to continued progress in methodology, design and
manufacturing. Ericsson shall have no liability for any error or
damage of any kind resulting from the use of this document.

Ericsson
SE-126 25 Stockholm, Sweden
Telephone +46 10 719 00 00                                                198/287 01-FGB 101 220
Fax +46 8 18 40 85                                                                     Revision B
www.ericsson.com                                                              © Ericsson AB 2012
You can also read