Pneumonia and Diarrhea Progress Report 2014
←
→
Page content transcription
If your browser does not render page correctly, please read the page content below
Pneumonia and Diarrhea
                                             Progress Report 2014

                           EXECUTIVE SUMMARY
                           Over the past decade and a half since 2000,                                                               Despite major reductions
                           significant gains have been made in the reduction                                                       in pneumonia and diarrhea
                           of pneumonia and diarrhea mortality in children
                           worldwide. Between 2000 and 2013, the global
                                                                                                                                  mortality globally, progress in
                           health community succeeded in decreasing the                                                           the highest-burden countries
                           number of deaths due to pneumonia and diarrhea                                                             remains fairly stagnant.
                           in children under the age of five years by 44%
                                                                                                                                    Introduction and scale-up
                           and 54%, respectively.1 However, reductions in
                           annual child mortality rates for pneumonia and                                                          of proven interventions that
                           diarrhea, the leading killers of children under five,                                                    protect, prevent, and treat
                           have continued to be only modest. According to                                                        pneumonia and diarrhea need
                           the latest child mortality estimates (published in
                           2014 for the year 2013), pneumonia and diarrhea
                                                                                                                                   to be accelerated to ensure
                           caused over 1.5 million under-five child deaths,                                                         that every child, no matter
                           respectively accounting for 15% and 9% of the 6.3                                                       what life circumstances he/
                           million under-five deaths that occurred globally in
                                                                                                                                  she is born into, will have the
                           2013, compared to 1.6 million deaths in 2012.1
                           This means that every 20 seconds, a mother and                                                          chance to celebrate his/her
                           father lose their young child to one of these deadly,                                                           fifth birthday.
                           but preventable diseases.

                           As in previous years, the burden of child pneu-
                           monia and diarrhea mortality continues to be most                                           interventions outlined in the Global Action Plan
                           heavily concentrated in just a few countries. The                                           for the Prevention and Control of Pneumonia and
                           15 countries with the greatest number of under-five                                         Diarrhea (GAPPD) relative to GAPPD coverage
                           child deaths from pneumonia and diarrhea in 2013                                            targets, where data are available. The coverage
                           bore 71% of the global burden of child deaths from                                          targets for indicators included in this report are 90%
                           these two diseases in spite of accounting for only                                          for vaccinations; 90% for access to pneumonia and
                           56% of the world’s under five year old population.2                                         diarrhea treatments, which include treatment by a
  International Vaccine
                           This Pneumonia and Diarrhea Progress Report                                                 health care provider, antibiotics, oral rehydration salts
  Access Center (IVAC)
                           evaluates the progress of these 15 highest-                                                 (ORS), and zinc supplements; and 50% for exclusive
Johns Hopkins Bloomberg    burden countries in implementing high-impact                                                breastfeeding during a child’s first six months of life.3
 School of Public Health
Rangos Bldg, Suite 600
 855 N. Wolfe Street       1. UNICEF. (2014). Committing to Child Survival: A Promise Renewed. Progress Report 2014. Retrieved from http://files.unicef.org/publications/files/APR_2014_
 Baltimore, MD 21205          web_15Sept14.pdf
                           2. Liu, L., Oza, S., Hogan, D., Perin, J., Rudan, I., Lawn, J. E., Cousens, S., Mathers, C., Black, R. E. (2014). Global, regional, and national causes of child mortality in
  www.jhsph.edu/ivac          2000-13, with projections to inform post-2015 priorities: an updated systematic analysis. Lancet. Retrieved from http://www.jhsph.edu/departments/internationalhealth/
                              centers-and-institutes/institute-for-international-programs/projects/mcee-child-cause-of-deathestimates. html
                           3. WHO/UNICEF. (2013). Ending Preventable Child Deaths from Pneumonia and Diarrhoea by 2025. The Integrated Global Action Plan for Pneumonia and Diarrhea
                              (GAPPD). Retrieved from http://www.unicef.org/media/files/Final_GAPPD_main_Report-_EN-8_April_2013.pdf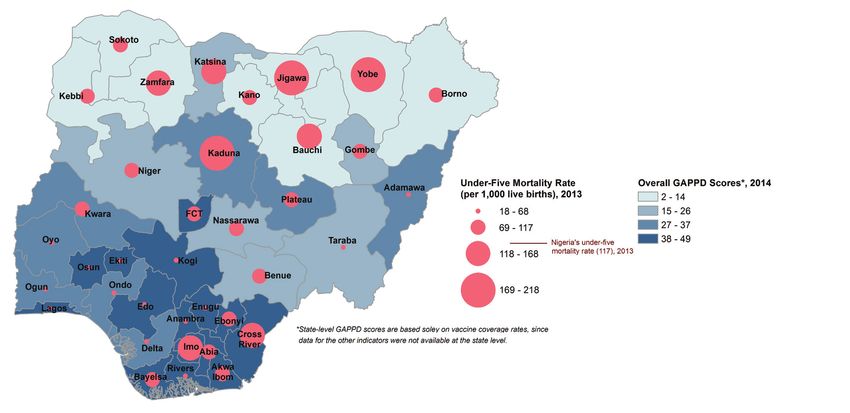
Each year, progress of the 15 highest-burden countries are assessed                                                vital interventions for every child and dedicate the necessary resources
through GAPPD scores, developed by the International Vaccine Access                                                to ensure that no child dies of preventable pneumonia and diarrhea.
Center (IVAC) of the Johns Hopkins Bloomberg School of Public Health.
GAPPD scores are derived from an average of countries’ coverage levels
across 10 key GAPPD indicators for which data are available. This                                                  INTRODUCTION
year’s GAPPD scoring includes all the indicators from 2013, with the
addition of supplemental zinc coverage in under-five children with diar-                                           Between 1990 and 2013, the under-five child mortality rate has
rhea. Based on the latest available data, very limited progress was made                                           decreased by half, which translates to approximately 17,000 lives
between 2013 and 2014 in the use of proven pneumonia and diar-                                                     saved per day, a tremendous achievement in the global public
rhea interventions in the 15 countries with the highest-burden of child                                            health community.1 During the past 13 years alone (from 2000
mortality from those diseases (India, Nigeria, Pakistan, the Democratic                                            to 2013), child deaths from pneumonia and diarrhea have also
Republic of the Congo, Ethiopia, Angola, China, Afghanistan, Indonesia,                                            halved.1 Yet, pneumonia and diarrhea continue to be the leading
Kenya, Sudan, Bangladesh, Niger, Chad, and Uganda). Because zinc                                                   causes of death in under-five children, together claiming the lives of
coverage in the 15 countries was generally very low, the addition of                                               more than 1.5 million children in a single year (2013).2 Of the 1.5
this indicator to the GAPPD scoring in 2014 reduced countries' overall                                             million child lives lost to pneumonia and diarrhea, a disproportionate
GAPPD scores and GAPPD-Diarrhea scores, complicating comparisons                                                   fraction (71%) occurred in just 15 countries,2 despite the fact that
with 2013 scores. Nevertheless, overall GAPPD scores improved no                                                   only 56% of the world’s under-five children live in these countries.5
more than 7% for any single country in 2014. India and Nigeria, the two
countries with the greatest number of child pneumonia and diarrhea                                                 This 2014 edition of the Pneumonia and Diarrhea Progress Report is
deaths, continue to have low GAPPD scores (32% and 29%, respec-                                                    the fifth annual progress report published by the International Vaccine
tively), although Nigeria achieved a 7% gain from the previous year,                                               Access Center (IVAC) of the Johns Hopkins Bloomberg School
even with the inclusion of zinc coverage in the score.                                                             of Public Health for World Pneumonia Day and the second IVAC
                                                                                                                   progress report to evaluate pneumonia and diarrhea interventions
Low GAPPD scores among the 15 countries can be attributed to a                                                     as an integrated approach. Expanding upon the diarrhea evaluation
combination of factors, including delayed or lack of introduction of                                               component, which was incorporated into the progress reports starting
pneumococcal conjugate vaccine (PCV) and rotavirus vaccine and                                                     last year, the 2014 Pneumonia and Diarrhea Progress Report now
poor coverage of pneumonia and diarrhea treatment interventions.                                                   includes data on zinc coverage in under-five children with diarrhea,
Even in countries that have introduced Haemophilus influenzae                                                      another key intervention for diarrhea outlined in GAPPD.3
type B (Hib) vaccine, PCV, and/or rotavirus vaccine in recent years,
scale-up of these vaccination programs has been quite slow and a                                                   This report provides the latest updates on countries’ implementation
sizeable proportion of the under-five population living in these coun-                                             of evidence-based pneumonia and diarrhea interventions recom-
tries still lacks access to these lifesaving vaccines.                                                             mended for universal adoption by the World Health Organization
                                                                                                                   (WHO) and the United Nations Children’s Fund (UNICEF) in the
There are still limitations in data that potentially mask critical gaps                                            Global Action Plan for Prevention and Control of Pneumonia and
in access to prevention and treatment or, on the contrary, underrep-                                               Diarrhea (GAPPD), and reports on their coverage levels relative to
resent the progress that countries have truly made simply because                                                  the GAPPD coverage targets. GAPPD lays out an integrated strategy
there are no data to quantify such improvements. However, countries                                                for ending preventable deaths due to pneumonia and diarrhea
are beginning to take steps to measure their own progress. India, for                                              through the widespread use of existing interventions with demon-
example, has initiated plans to fill information gaps and evaluate avail-                                          strated impact, within a broader framework of protecting child health,
able data at the district and block levels in high-burden states, which                                            preventing children from becoming sick from pneumonia and diar-
will guide actions that can drive forward real progress. In addition to                                            rhea, and appropriately treating affected children.3
coverage estimates of interventions, India is also looking at important
process indicators to measure how well the system that delivers these                                              The specific coverage targets for the measured interventions
interventions is performing. Nigeria, as well, is moving to implement                                              included in this report as prescribed by GAPPD are:
score card measurements of system indicators at the subnational
level. It will be important for other countries to follow a similar path,                                          • 90% coverage for each of the following vaccines: pertussis,
implementing monitoring at local levels to ensure that progress is being                                             measles, Haemophilus influenzae type B (Hib), pneumococcal,
made. Particularly in countries with great subnational disparities, local                                            and rotavirus vaccines;
monitoring is essential to identifying areas and populations of high                                               • 90% treatment access for children with pneumonia, including
risk for morbidity and mortality and matching targeted interventions to                                              care by an appropriate health care provider and antibiotics;
those high-risk groups. As the world nears the 2015 deadline for the                                               • 90% coverage of treatment with oral rehydration salts (ORS) and
Millennium Development Goal (MDG) 4 of reducing child mortality by                                                   zinc supplements for children with diarrhea; and
two-thirds since 1990,4 it is absolutely crucial that stakeholders and                                             • 50% rate of exclusive breastfeeding within the first six months of a
advocates at all levels continue the global push for equitable access to                                             child’s life.

4. WHO. (2013). MDG 4: Reduce child mortality. Retrieved from http://www.who.int/topics/millennium_development_goals/child_mortality/en/
5. UN Population Division. (2013). World Population Prospects: The 2012 Revision. Retrieved from http://esa.un.org/unpd/wpp/Excel-Data/population.htm

2 | Pneumonia and Diarrhea Progress Report • 2014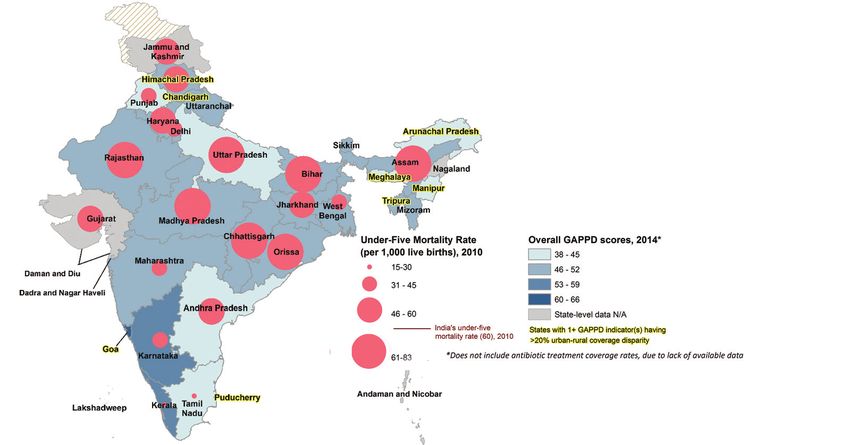
INTERPRETING GAPPD INTERVENTION SCORES
       Because of methodological limitations, GAPPD intervention scores should be interpreted cautiously with several key considerations
       in mind. First, annual data are unavailable for some interventions in some countries, and thus these parameters are not included in
       their score. This limits the ability to compare countries with varying degrees of available data. Second, WHO/UNICEF estimates of
       vaccine coverage are updated annually, based on the latest country reported figures and survey data, which may or may not reflect
       the true coverage levels for the most recent coverage year. Breastfeeding and treatment coverage rates are also not always updated
       on an annual basis. GAPPD scores are calculated from the latest available data within the last 10 years, which are not necessarily
       data from the past year. As a result, reference years may vary across different indicators and countries. For example, the refer-
       ence year ranged from 2005 to 2013 for the exclusive breastfeeding indicator and from 2005 to 2014 for pneumonia and diarrhea
       treatment coverage rates, whereas vaccine coverage rates were data from 2013. From year to year, there may be updated figures
       for some indicators, but not all. Thus, it is possible that in the absence of updated data for some indicators, the progress made
       by countries may appear more stalled than it really is. When interpreting GAPPD scores, it is also important to note that scores
       calculated for countries with more available (and recent) data offer a more accurate assessment of countries’ performance against
       GAPPD targets, since missing data values are excluded from the average and could potentially skew the scores if the actual value
       is significantly higher or lower than the other values included in the scoring. These scores should be treated as estimates to assess
       countries’ performance, which can inform programming and motivate policy making in high-burden countries.

GAPPD INTERVENTION SCORING                                                 children with suspected pneumonia; and exclusive breatsfeeding in
                                                                           the first six months. GAPPD-Diarrhea scores take into account fewer
To measure and demonstrate countries’ progress over time, GAPPD            indicators (5): measles and rotavirus vaccine coverage, ORS and zinc
intervention scores are calculated for each country, taking into           treatment for children with diarrhea, and exclusive breastfeeding in
account the coverage across key GAPPD interventions, and compared          the first six months.
to GAPPD coverage targets. A total of ten coverage indicators are
included in the overall GAPPD intervention scores, reported as a           In this 2014 Pneumonia and Diarrhea Progress Report, coverage
summary percent coverage, which are determined by averaging                of zinc treatment for children with diarrhea has been added to the
the coverage rates for all indicators where data are available. The        calculation of GAPPD intervention scores. Treatment with zinc can
ten indicators include coverage rates for the third dose of pertussis      lower childhood diarrhea mortality by over 20% and thus is a critical
vaccine (as measured by DTP3), measles-containing vaccine (MCV),           component of diarrhea treatment.3 However, zinc treatment has
third dose of Hib vaccine, third dose of pneumococcal vaccine, and         often been underreported due to sparse data availability. In light of
last dose of rotavirus vaccine (individually reported); access to an       available zinc coverage data in 12 of the 15 countries highlighted in
appropriate health care provider and antibiotic treatment for children     this report, this indicator is now included in the GAPPD intervention
with suspected pneumonia; treatment with oral rehydration salts            scoring. Because of this, countries' GAPPD-Diarrhea score from last
(ORS) and zinc supplements for children with diarrhea; and exclu-          year is not directly comparable to this year's score.
sive breastfeeding for a child’s first six months.3 The overall GAPPD
scores are a reflection of countries’ progress in implementing proven      GAPPD scores do not take into account all possible pneumonia and
interventions against pneumonia and diarrhea, including those that         diarrhea interventions that are known to be effective in reducing the
impact only one of the two diseases as well as those that impact both.     burden of these childhood diseases. Rather, they focus on ten core
GAPPD-Pneumonia and GAPPD-Diarrhea scores, which are respec-               GAPPD interventions for which measurable coverage targets were
tively calculated based on pneumonia-specific and diarrhea-specific        set and for which coverage data are publicly available.
interventions only, are also provided to allow a more in-depth evalu-
ation of countries’ areas of strength and weakness in preventing and       KEY FINDINGS: GAPPD PACKAGE COVERAGE
treating pneumonia and diarrhea.
                                                                           Between 2013 and 2014, the countries with the greatest number
GAPPD-Pneumonia scores average coverage levels for seven indica-           of child deaths due to pneumonia and diarrhea largely remained
tors: pertusssis, measles, Hib, and pneumococcal conjugate vaccines;       the same, with a few exceptions. Sudan, Bangladesh, and Chad are
care by an appropriate care provider and antibiotic treatment for          countries that were not among the top 15 highest-burden countries

                                                     International Vaccine Access Center (IVAC) • Johns Hopkins Bloomberg School of Public Health | 3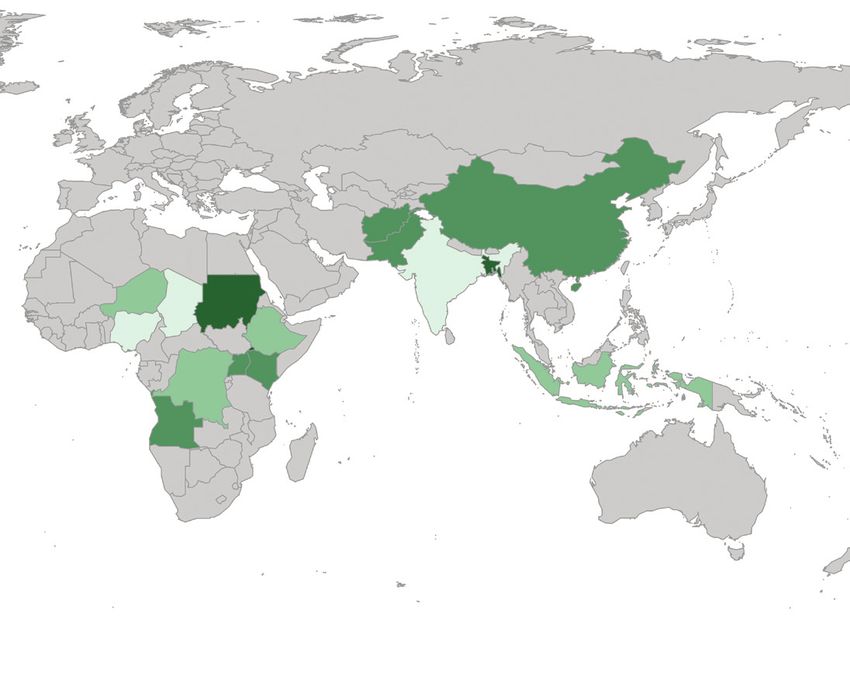
in 2013, but now are, thereby removing Tanzania, Mali, and Burkina                                                 In all other countries, GAPPD-Diarrhea scores either remained the
Faso from the 15-country 2014 ranks of child pneumonia and diar-                                                   same (China) or decreased, with the greatest decrease observed
rhea mortality.6                                                                                                   in Pakistan (-12%), again likely influenced by low zinc coverage
                                                                                                                   in the 2014 score. In all 15 countries, GAPPD-Pneumonia scores
In the current 15 countries with the largest burden of pneumonia and                                               were higher than GAPPD-Diarrhea scores. This is in part due to
diarrhea child deaths, overall GAPPD intervention scores ranged from                                               delayed rotavirus vaccine introduction in 14 of the 15 countries and
23% (Chad) to 63% (Sudan). (See Fig. 1a and 1b.) This indicates                                                    generally lower diarrhea treatment rates, especially the use of zinc,
no major improvement in scores since 2013, as last year’s scores                                                   compared to pneumonia treatment rates.
were 22% (Nigeria) on the lower end and 57% (Kenya) on the higher
end, although 2014 scores now include zinc coverage, which is low.
GAPPD-Pneumonia and GAPPD-Diarrhea scores also varied widely
across the 15 countries, ranging from 31%-66% and 15%-57%
respectively (Fig. 1c). Whether looking at overall GAPPD, GAPPD-
Pneumonia, or GAPPD-Diarrhea scores, Sudan achieved the highest
and Chad achieved the lowest scores among the 15 focus countries.
Notably, Sudan is also the only country of the 15 profiled in this report
to have introduced both PCV and rotavirus vaccine by 2013. India
and Nigeria, the two countries with the greatest absolute burden of
child pneumonia and diarrhea deaths continue to score on the lower
end of the scale (32% and 29%, respectively), although Nigeria
achieved a 7% gain in its overall GAPPD score from 2013 to 2014.
Neither India nor Nigeria has introduced PCV and rotavirus vaccine,
but both have plans to introduce rotavirus vaccine within the next few
years, and Nigeria is due to introduce PCV before the end of this year.
                                                                                                                                                                           FIGURE 1a: Overall GAPPD scores
                                                                                                                                                                           for the 15 highest mortality burden
Even with the addition of zinc coverage in 2014 scores, four coun-                                                                                                         countries, 2014.
tries – Nigeria, Ethiopia, Angola, and Indonesia – showed slight
improvements (ranging from 2%-7%) in their overall GAPPD scores,
one country (China) showed no change, and seven countries (India,
Pakistan, Democratic Republic of Congo, Afghanistan, Kenya, Niger,
and Uganda) had 1%-7% drops in their scores. Nigeria had the                                                       If all ten minimum GAPPD coverage targets had been met, overall
largest increase in overall GAPPD scores since last year, with larger                                              GAPPD intervention scores would have been at least 86%, but none
gains on the pneumonia intervention side (+12%), compared to the                                                   of the 15 countries were even close to reaching that threshold.
diarrhea side (+3%), which might be influenced by the addition of                                                  Similarly, no country met all of the pneumonia- and diarrhea-
zinc coverage in the 2014 score. In some countries, mixed progress                                                 related coverage targets to achieve the target GAPPD-Pneumonia
on the pneumonia and diarrhea fronts was observed. For instance,                                                   and GAPPD-Diarrhea intervention scores of 84% and 82%. Only
India increased its GAPPD-Pneumonia score by 3%, but its GAPPD-                                                    7 of the 15 countries met at least 1 of the 10 GAPPD coverage
Diarrhea score fell by 8%, also due to the addition of zinc coverage                                               targets, whereas the 8 other countries failed to meet even a single
to the GAPPD scoring. Likewise, Ethiopia made gains in its GAPPD-                                                  coverage target. Bangladesh was the country that reached the most
Pneumonia score (+10%), but those gains were largely offset by the                                                 GAPPD coverage targets (4), including those for exclusive breast-
decrease in its GAPPD-Diarrhea score (-8%). In the case of Kenya                                                   feeding and pertussis, measles, and Hib vaccine coverage.
and Niger, both their GAPPD-Pneumonia and GAPPD-Diarrhea scores
fell, resulting in a 7% and 4% loss in both of their overall GAPPD                                                 KEY FINDINGS: PREVENTION THROUGH
scores, respectively. Changes in GAPPD scores between 2013 and                                                     VACCINATION
2014 should be interpreted with consideration of country-specific zinc
coverage rates, which were added to this year's score.                                                             Child vaccinations have been long known to be one of the best
                                                                                                                   public health investments because of their effectiveness in
Focusing on pneumonia interventions alone, countries showing                                                       preventing the incidence of disease, reducing the severity of
improved 2014 GAPPD-Pneumonia scores compared to 2013 are                                                          disease, and preventing mortality. Beyond morbidity and mortality,
India, Nigeria, Pakistan, Ethiopia, Angola, China, Afghanistan, and                                                there has also been increasing recognition for the broader value
Indonesia. These improvements were rather modest, with gains of                                                    of vaccines, which include their potential impact on social and
as little as 1% (Angola, China, and Afghanistan) and as high as 10%                                                cognitive development, educational achievement, and economic
(Ethiopia). On the other hand, only two countries – Nigeria (+3%)                                                  prospects.7 Positive impacts made in these areas as a result of child
and Uganda (+5%) – had gains in their GAPPD-Diarrhea scores.                                                       vaccinations would translate to similar improvements and gains on
6. International Vaccine Access Center (IVAC) at Johns Hopkins Bloomberg School of Public Health. (2013). Pneumonia and Diarrhea Progress Report 2013. Retrieved from http://www.jhsph.edu/research/centers-andinstitutes/ ivac/
   resources/IVAC-2013-Pneumonia-Diarrhea-Progress-Report.pdf
7. Gavi. (n.d.) Value of vaccination. Retrieved from http://www.gavi.org/about/value/

4 | Pneumonia and Diarrhea Progress Report • 2014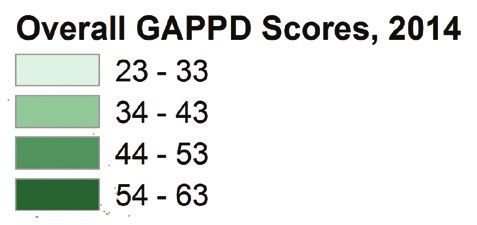
the family, community, national, and global levels. While studies are Thus, vaccine introduction in 70% of countries does not translate to
still being done to further quantify the broader value of vaccines, it is 70% of the world’s children having access to the vaccine.
clear that vaccines have a wide range of both personal and societal
benefits that extend beyond child health and survival. In some countries, such as Nigeria, Ethiopia, and Indonesia, there were
modest increases in coverage rates for pertussis, measles, and Hib
For the prevention of pneumonia, several vaccines are available vaccines, whereas in other countries, such as the Democratic Republic
and recommended for universal adoption; these include pertussis, of the Congo, China, Bangladesh, and Uganda, no change in coverage
measles, Hib, and pneumococcal vaccines. For diarrhea, rotavirus rates across the three vaccines was observed.10 Vaccination coverage
vaccine provides the best line of protection against rotavirus infec- increases in Nigeria reflect a recovery from a stock-out of diphtheria-
tion, which is the leading cause of diarrhea deaths worldwide.8 pertussis-tetanus (DTP) vaccine and the continued roll out of pentava-
Remarkable progress has been made in the introduction of these life- lent vaccine, and in Indonesia, the increase reflects the introduction of
saving vaccines globally, evident in the accelerated rate of uptake in Hib-containing pentavalent vaccine. In Bangladesh, coverage rates for
recent years, particularly in low-income countries. For Hib vaccine*, pertussis, measles, and Hib vaccines were sustained above the 90%
it took 20 years since its first introduction in any country to reach targets. India, the country with the greatest number of child deaths
its introduction in 70% of low-income countries, whereas PCV and from pneumonia and diarrhea, continues to struggle with improving
rotavirus vaccines are projected to take 15 and 11 years, respectively.9 rates of basic childhood immunizations. No improvements were seen in
Despite the unprecedented pace of introduction, countries that have India’s pertussis and measles coverage, and the rollout of Hib (pentava-
introduced these new vaccines have shown relatively slow progress in lent) vaccine in select states, which began at the end of 2011, only
achieving high levels of vaccine coverage. Of the 15 countries assessed achieved 20% national coverage by 2013. In 2014, additional states
in this report, the number that met the 90% coverage target for each have introduced pentavalent vaccine, but the rollout is not expected
vaccine was four for pertussis (Angola, China, Sudan, and Bangladesh), to be complete until 2015, four years after the first state introduction.
four for measles (Angola, China, Kenya, and Bangladesh), and three This illustrates that especially in large countries, introduction is only the
for Hib (Angola, Sudan, and Bangladesh); no countries met this target first step toward universal access to vaccines; to achieve widespread
for PCV or rotavirus vaccine. Moreover, countries that have lagged in coverage, phased introductions require acceleration, particularly in
vaccine introduction are often larger countries with large birth cohorts. states with a high burden of disease.
FIGURE 1b: Overall GAPPD Intervention Scores, 2014
100
90 Overall GAPPD Target 86%
FIGURE 1b: 2014 GAPPD
80
intervention scores for
70 63 countries shown from left
58 to right in increasing order
60 50 50
47 45 47 of child pneumonia and
50 44
39 38 37 38 diarrhea mortality.
40 32 29
30 23 Note: Not all countries
have data for all nine
20
interventions. See Table 1
10 for more details.
0
Pakistan
Ethiopia
Chad
India
Indonesia
Sudan
Afghanistan
Bangladesh
Uganda
Angola
Niger
Kenya
China
Democratic Republic
of the Congo
Nigeria
n Countries with no missing data value
n Countries with 1 missing data value
n Countries with 4 missing data values
*Introduction dates for Hib vaccine presented in this report refer specifically to Hib conjugate vaccines introduced into infant programs, not to all Hib-containing vaccines targeted at any child age group.Global Vaccine Introduction
Report, September 2014. Retrieved from http://www.jhsph.edu/research/centers-and-institutes/ivac/vims/
8. Munos, M. K., Fischer Walker, C. L.., & Black, R. E. (2010). The effect of rotavirus vaccine on diarrhoea mortality. International Journal of Epidemiology, 39, 156-162. doi: 10.1093/ije/dyq022
9. International Vaccine Access Center (IVAC) at Johns Hopkins Bloomberg School of Public Health. (2014). Vaccine Information Management System (VIMS). Data as of Nov 2014.
10. WHO/UNICEF. (2014, July). WHO/UNICEF Estimates of National Immunization Coverage (WUENIC) for 1980-2013, as of July 2014. Retrieved from http://www.who.int/immunization/monitoring_surveillance/data/en/
International Vaccine Access Center (IVAC) • Johns Hopkins Bloomberg School of Public Health | 5
FIGURE 1c: GAPPD–Pneumonia and Diarrhea Intervention Scores, 2014
100
GAPPD – Pneumonia and Diarrhea Scores
90 GAPPD Pneumonia Target 84%
80
GAPPD Diarrhea Target 80% 66 66
70 65 61
61 59
60 57 57 55
52 51
50 42 47 48
42 57 FIGURE 1c: 2014 GAPPD‐
37 33
40 34 33 33 38 Pneumonia and GAPPD‐
31
30 29 28 28 28 29 Diarrhea intervention scores
23
for countries shown from
20 15
left to right in increasing
10 order of child pneumonia
0 and diarrhea mortality.
Pakistan
Ethiopia
India
Chad
Indonesia
Sudan
Afghanistan
Bangladesh
Uganda
Angola
Kenya
Niger
China
Democratic Republic
of the Congo
Nigeria
n GAPPD–Pneumonia Intervention Score
n GAPPD–Diarrhea Intervention Score
INDIA’S DEVELOPMENT OF STATE- AND DISTRICT-LEVEL SCORE CARDS, ADAPTED
FROM IVAC’S PNEUMONIA & DIARRHEA PROGRESS REPORT
In September 2014, India’s Ministry of Health & Family Welfare, along with representatives from high pneumonia and diarrhea burden
states and districts, WHO, UNICEF, and other stakeholders came together to propose and develop the Integrated Action Plan for
Pneumonia and Diarrhea (IAPPD). This includes a framework for monitoring selected high-burden state- and district-level progress in
achieving GAPPD targets via “score cards” and ensuring accountability in the implementation of corrective actions following regular
reviews of the score cards. As a starting point, the annual IVAC Pneumonia & Diarrhea Progress Report formed the basis for a GAPPD
intervention score that has been adapted to the needs of the Indian states and districts. Discussions are underway to finalize a score
card responsive to the needs of Indian stakeholders and incorporates additional coverage and process indicators (e.g., measures of
human resources, planning, commodities available, measures of information management, coordination, and social mobilization).
To ensure meaningful assessment of progress while also maintaining the score cards’ simplicity and applicability, the score cards will
examine a minimal number of indicators, using existing data collection systems at the start and supplementing with rapid assessments
to fill data gaps. The concept of subnational score cards was conceived as a targeted effort to address child mortality in high priority
districts within Bihar, Madhya Pradesh, Rajasthan, and Uttar Pradesh, four large states in India with high child mortality. However,
these score cards can easily be adapted for further use in other states and districts across India.
6 | Pneumonia and Diarrhea Progress Report • 2014In Pakistan and Niger, coverage rates fell across the board (for The two currently licensed rotavirus vaccines were approved for use
pertussis, measles, and Hib). Although Pakistan made great strides in 2006 and are now making their way onto national agendas, with
in increasing its PCV coverage (from 0% in 2012 to 66% in 2013), more than one-third of the world’s countries having access to the
its coverage for three of the other vaccines (pertussis, measles, and vaccine.9 Five of the countries with the highest diarrhea mortality
Hib) fell, with the largest drop observed in measles coverage (-22%). (Ethiopia, Angola, Kenya, Sudan, and Niger) have introduced the
Political unrest in countries can certainly disrupt access to primary vaccine, most commonly in late 2013 and 2014. Six more countries
health care services, but decreases in basic immunization coverage (India, Nigeria, Pakistan, Afghanistan, Bangladesh, and Uganda) are
rates, especially for the third dose of DTP (DTP3), may also indicate planning to introduce within the next few years, while four countries
that countries lack the public health infrastructures needed to effec- remain undecided. Decision making on rotavirus vaccine introduction
tively deliver vaccines. Whether improvements are needed in supply is notably lagged in Asia, where the vaccine has only been introduced
management, cold chain capacity, health worker training, outreach, in 20% of all countries in the region, compared to 47% of countries
or in the demand by parents for vaccines, these represent opportuni- in African countries.9 Introductions may be delayed due to a number
ties for countries to strengthen their routine immunization systems. of factors, including the perceived lack of adequate disease burden
Particularly when countries are making gains in the coverage of new data, logistical challenges, supply shortages, barriers to vaccine
vaccines (such as PCV) yet are seeing decreases in basic DTP3 acceptance, competing health priorities, and country preference
coverage rates (as is the case in Pakistan), it is important to assess for an indigenously produced vaccine. A locally produced rotavirus
where strains and bottlenecks in the current system might exist and vaccine has now been licensed in India and inclusion of a rotavirus
whether additional injections per visit are playing a role. With the vaccine in the Indian Universal Immunization Programme (UIP) has
addition of inactivated polio vaccine (IPV) to the routine immunization recently been announced. While emerging market suppliers play
schedule of all countries in the coming months, the ability to manage an important role in shaping the vaccine market and supporting
and sustain multiple injections at a visit is critical. The ability of the sustainability, it is critical that countries address the burden of pneu-
immunization program to support the growing list of highly effec- monia and diarrhea disease with the level of urgency it deserves,
tive vaccines is a priority concern for most of the 15 countries, as which includes using available vaccines until indigenous vaccines
evidenced by the fact that all (except Angola and China) have applied with demonstrated efficacy and safety are approved for public use.
for and either received or been approved for health system strength-
ening support from Gavi, The Vaccine Alliance.11
KEY FINDINGS: PROTECTION
Although Hib vaccine initially faced significant delays in introduc-
tions in the developing world, it has now reached all 73 Gavi eligible The benefits of breastfeeding are well established in the scientific
and graduating countries.9 All countries featured in this report, literature. Exclusive breastfeeding is especially important in the
except for China, have introduced the vaccine into the public sector first six months of a child’s life, as it confers a wide range of health
as part of a national immunization schedule. China is believed to benefits both in the short and long term. Exclusive breastfeeding
have widespread coverage of Hib vaccine in the private market;12 during this critical window in a child’s life results in improved nutri-
however, the precise coverage rate through private market use is tional status, which protects children from becoming ill with and
unknown. The countries with low Hib vaccine coverage in 2013 are dying from common childhood diseases, such as pneumonia and
largely those that have introduced the vaccine very recently, starting diarrhea.3,13 Undernutrition in children compromises their immune
with a regional or phased introduction, including India (2011), system’s ability to fight infections, thus putting them at greater risk of
Nigeria (2012), and Indonesia (2013).9 Chad has persistently low adverse outcomes, including death.1 In fact, undernutrition contrib-
Hib immunization coverage (48%), despite this vaccine being utes to over 45% of the global burden of disease in children under
included in the country’s immunization schedule since 2008.9 five years of age.14 Provided in this report are rates of exclusive
breastfeeding in the first six months of a child’s life for the most
PCV, now nearly fifteen years from the initial introduction in the U.S., recent year of available data, which varies by country (from 2005
has only reached 9 of the 15 highest pneumonia mortality burden to 2013). These figures may not be representative of the current
countries to date, albeit with two additional countries planning to exclusive breastfeeding levels in the country, especially if the most
introduce by the end of 2014.9 The four remaining countries (India, recently available data are now many years outdated. However, they
China, Indonesia, and Chad) have yet to make a decision regarding do indicate what is currently known about exclusive breastfeeding
PCV introduction. Even among those countries that have introduced levels based on the latest surveys reporting on such practices.
PCV by 2013, coverage levels remain low, with no single country
having coverage exceeding 75%.
11. Gavi, The Vaccine Alliance. (2014, June). Countries approved for support. Retrieved from http://www.gavi.org/results/countries-approved-for-support/
12. International Vaccine Access Center (IVAC), Johns Hopkins Bloomberg School of Public Health. (2014). Vaccine Information Management System (VIMS) Global Vaccine Introduction Report, September 2014. Retrieved from
http://www.jhsph.edu/research/centers-and-institutes/ivac/vims/
13. Bhutta, Z. A. et al. (2013). Interventions to address deaths from childhood pneumonia and diarrhoea equitably: what works and at what cost? The Lancet, 381 (9875), 1417-1429. doi:10.1016/S0140-6736(13)60648-0
14. Black, R. E., Victora, C. G., Bhutta, Z. A., Christian, P., de Onis, M., Ezzati, M., … the Maternal and Child Nutrition Study Group. (2013). Maternal and child undernutrition and overweight in low-income and middle-income
countries. The Lancet, 382(9890), 427-451. doi:10.1016/S0140-6736(13)60937-X
International Vaccine Access Center (IVAC) • Johns Hopkins Bloomberg School of Public Health | 7TABLE 1: Current levels of coverage for interventions that prevent (vaccination), protect (exclusive breastfeeding), and treat (access to care, antibiotic
treatment, ORS, and zinc) pneumonia and diarrhea in the 15 countries with the most child pneumonia and diarrhea deaths
Global Mortality Pneumonia Vaccine Coverage (%)
Rank in & Diarrhea
Pneumonia & Deaths in Hib3 20132
Country Pertussis PCV 20132 Rota 20132
Diarrhea Deaths Children Under Measles (Year Introduced)
in Children 5 Years (in (DTP3) (Year Introduced) & (Year Introduced) &
20132 & Vaccine Use
Under 51 1000s) 20131 20132 Vaccine Use Status Vaccine Use Status
Status
0
20 0
1 India 318 72 74 Non-GAVI
(2011) No Decision
introduction planned
0 0
46
2 Nigeria 197 58 59 Approved by GAVI Gavi application
(2011)
for assistance under review
0
66
3 Pakistan 109 72 61 72 Plan to apply for
(2012)
GAVI support
Democratic
26 0
4 Republic 83 72 73 72
(2011) No Decision
of the Congo
63 0
5 Ethiopia 53 72 62 72
(2011) (Nov 2013)
9 0
6 Angola 49 93 91 93
(Jun 2013) (Apr 2014)
Private market 0 0
7 China 41 99 99
coverage No Decision No Decision
0
0
8 Afghanistan 33 71 75 71 Plans to apply for
(Dec 2013)
GAVI support
4 0 0
9 Indonesia 30 85 84
(Aug 2013) No Decision No Decision
75 0
10 Kenya 29 76 93 83
(2011) (Jul 2014)
30 80
11 Sudan* 28 93 85 93
(Aug 2013) (2011)
0 0
12 Bangladesh* 26 97 93 97 Approved by GAVI Plans to apply for
for assistance GAVI support
0 0
13 Niger 25 70 67 70
(Aug 2014) (Aug 2014)
0 0
14 Chad* 24 48 59 48
No Decision No decision
0
0
15 Uganda 24 78 82 78 Plans to apply for
(Apr 2013)
GAVI support
*Not profiled in the 2013 Pneumonia & Diarrhea Progress Report; was not among the top 15 countries with the highest number of child pneumonia and diarrhea deaths in the previous year.
Sources:
1. Liu, L., Oza, S., Hogan, D., Perin, J., Rudan, I., Lawn, J. E., Cousens, S., Mathers, C., Black, R. E. (2014). Global, regional, and national causes of child mortality in 2000-13, with projections to inform post-2015 priorities:
an updated systematic analysis. Lancet. Retrieved from http://www.jhsph.edu/departments/international-health/centers-and-institutes/institute-for-international-programs/projects/mcee-child-cause-of-death-estimates.html
2. WHO/UNICEF. WHO/UNICEF National Immunization Coverage Estimates. Data as of 30 Jul 2014. Retrieved from http://www.who.int/immunization/monitoring_surveillance/data/en/
3. UNICEF. Global databases 2013 based on MICS, DHS and, other national household surveys. Retrieved from http://data.unicef.org/child-health/pneumonia
8 | Pneumonia and Diarrhea Progress Report • 2014Global % of Children under 5 years 2014 2014 2014
with suspected pneumonia % of Children
Mortality Rank % of Children % Exclusive Overall GAPPD- GAPPD-KEY FINDINGS: EXCLUSIVE BREASTFEEDING will become lost opportunities to prevent child mortality, whether the
opportunities were present before or after the children became ill.
Establishing good child health and nutrition through exclusive
breastfeeding is an inexpensive and effective way of protecting
children against pneumonia and diarrhea. Despite the mounting PNEUMONIA TREATMENT: CARE BY
evidence to support exclusive breastfeeding, fewer than 4 in 10 APPROPRIATE HEALTH CARE PROVIDER AND
children worldwide are exclusively breastfed during their first six ANTIBIOTICS
months of life.1 Least developed countries tend to have higher rates
of exclusive breastfeeding (48%) compared to the global average Access to pneumonia care and treatment is measured by the
(39%), but overall rates remain stubbornly low. percentage of under-five children with suspected pneumonia who
are taken to an appropriate health care provider and the percentage
For the 15 countries profiled in this report, exclusive breastfeeding rates that are treated with antibiotics. These figures are provided for
ranged from 3% in Chad to 64% in Bangladesh. (See Fig. 2.) Ethiopia, the latest year of available data, ranging from 2005 to 2012 for
Bangladesh, and Uganda were the only three countries to meet the 50% care-seeking behavior and from 2006 to 2012 for antibiotic treat-
GAPPD target for exclusive breastfeeding. Interestingly, in Chad, where ment. (Niger’s antibiotic coverage rate was excluded because their
the rate of exclusive breastfeeding is extremely low (3%), the percentage estimate was not within the last 10 years; its most recently available
of children between 12-15 months who receive continued breastfeeding data on antibiotic coverage are actually from 1992.) When inter-
at one year is actually quite high (88%).15 In countries with similar preting data, consideration should be given to the limitations in the
patterns, it is possible that even though breastfeeding is well accepted data collection methodology as we have found some data to not be
and widely practiced, physical barriers or longstanding cultural norms consistent with expected results. Nonetheless, the data can provide
may prevent mothers from withholding other foods and fluids during the important information about trends, but as has been observed in
child’s first six months of life. For example, because of the hot tempera- many places, survey replies may not be reflective of true behavior.
tures in Chad, mothers feed their children other fluids besides breast
milk in attempts to keep them hydrated.16 Reasons for low adherence to For both indicators of pneumonia treatment, all 15 countries failed to
global recommendations for exclusive breastfeeding likely vary by country meet the 90% GAPPD coverage targets (Fig. 3). The coverage rates
and should be examined more closely to develop tailored strategies for for care by a health care provider were as low as 26% (Chad) and
improving exclusive breastfeeding rates in each country. as high as 79% (Uganda), while the rates for antibiotic treatment
ranged even more widely, from 7% (Ethiopia) to 71% (Bangladesh).
In 7 of the 15 countries, rates of care by a health care provider were
KEY FINDINGS: TREATMENT higher than those of antibiotic treatment and in 6 of the countries,
the reverse was true. Rates of pneumonia treatment coverage may
In addition to employing protective and preventive measures against be low in countries because pneumonia may not be detected and
pneumonia and diarrhea, appropriate treatment is another key aspect diagnosed.17 Communities may lack either the proper training or
of the prevention and care continuum. Neglect of any of these areas diagnostic tools to detect pneumonia and classify its etiology, both of
FIGURE 2: Exclusive Breastfeeding in the First 6 Months of Life (2005–2013)
100
FIGURE 2: Levels of exclusive
% Exclusive Breastfeeding in the First 6 Months of Life
90
80 breastfeeding for infants in
64 62 the first 6 months of life in the
70
53 15 countries with the highest
60 GAPPD Target 50%
46 burden of child pneumonia
50 42 41
38 and diarrhea mortality,
40 37 32
28 23 2005‐2013 (based on most
30
17 recent data year available).
20 11
3 Sources: UNICEF. Infant and
10 N/A Young Child Feeding (IYCF)
0 2014. Retrieved from http://
Pakistan
Ethiopia
India
Chad
Indonesia
Sudan
Afghanistan
Bangladesh
Uganda
Angola
Kenya
Niger
China
Democratic Republic
of the Congo
Nigeria
data.unicef.org/nutrition/
iycf; ICF International. The
DHS Program STATcompiler.
Retrieved from http://www.
statcompiler.com
15. UNICEF. (2014). Multiple Indicator Cluster Surveys / MICS5 – Chad 2010. Retrieved from http://www.childinfo.org/mics5_surveys.html
16. UNICEF. (2010, August). A successful start in life: Improving breastfeeding in West and Central Africa. Retrieved from http://www.unicef.org/cotedivoire/wcaro_improving_breastfeeding_en.pdf
17. Were, W., & Qazi, S. (2014). The context and key problems of pneumonia diagnosis in low resource settings [PowerPoint slides]. Retrieved from http://www.malariaconsortium.org/userfiles/file/Were_Qazi-%20Diagnosis%20pneu-
monia%20slides.pdf
10 | Pneumonia and Diarrhea Progress Report • 2014which are important for providers to determine the appropriate course countries having 10% or less of children with diarrhea receiving zinc
of action. Furthermore, the field of pneumonia treatment is rapidly treatment. Bangladesh achieved by a substantial degree the highest
evolving with new scientific evidence emerging about the need, type, zinc coverage rate among the group of 15 countries, at 41%. This
and course of antibiotic treatment, especially in the era of routine use may be in part due to a practice of packaging zinc in combination with
of Hib and pneumococcal vaccines, which will largely prevent the two ORS to assure provision of both interventions simultaneously. Overall,
pathogens most commonly associated with pneumonia mortality. The diarrhea treatment rates in the 15 highest-burden countries continue
remaining pathogens, many of which are viral, and the appropriate- to be well below the GAPPD target (90%), with zinc coverage being
ness of antibiotic treatment are the subject of active evaluation and drastically lower than ORS coverage. These gaps in treatment reveal
guideline revisions. the extent of work that remains to be done, but they also represent the
opportunities to move the needle in pneumonia and diarrhea preven-
tion and control. Further research in these high-burden countries are
DIARRHEA TREATMENT: TREATMENT WITH needed to assess factors that contribute to low pneumonia and diarrhea
ORAL REHYDRATION SALTS (ORS) AND ZINC treatment coverage rates on the national and subnational levels. With
more country-specific information, decision makers will be better
Coverage levels for diarrhea treatment, as indicated by the equipped to make evidence-informed programmatic and policy deci-
percentage of under-five children with diarrhea who receive ORS sions to close existing gaps in coverage.
treatment and the percentage of under-five children who receive
zinc supplements, are reported for the most recent year for which
data are available. These reference years range from 2005 to 2013 SUBNATIONAL PROGRESS IN THE TWO
for ORS coverage and from 2005 to 2014 for zinc coverage. HIGHEST-BURDEN COUNTRIES –
INDIA AND NIGERIA
Data on ORS coverage were available for 13 of the 15 countries. Of
these 13, the majority had ORS coverage levels below 50%, with the This report evaluates the progress made by countries in imple-
exception of Afghanistan (53%) and Bangladesh (78%). For zinc menting GAPPD recommended interventions. With the limitations
coverage, rates were even more depressed, with 11 of the 12 reporting of data that have been aggregated at the country level, we fully
FIGURE 3 — Levels of treatment coverage for children with suspected pneumonia and diarrhea
(access to an appropriate health care provider, antibiotic treatment, ORS, and zinc), 2005-2014.
100
GAPPD Target 90%
90
80
% of Children Under 5 Years of Age
70
60
50
40
30
20
10
N/A N/A N/A
0
Pakistan
Ethiopia
Chad
India
Indonesia
Sudan
Afghanistan
Bangladesh
Uganda
Angola
Niger
Kenya
China
Democratic Republic
of the Congo
Nigeria
n Taken to an Appropriate Health Care Provider (2005–1012) n % of Childrenrecognize that there may be heterogeneity in coverage levels within as coverage of preventive and treatment measures, underscore the
countries and believe that that is likely the case in large countries. importance of monitoring and evaluating subnational data to identify
To assess the potential disparities in coverage and progress that may opportunities to close existing gaps in care.
exist sub-nationally, this report delved into coverage data for two
of the highest mortality burden countries (India and Nigeria) and
calculated their state-level GAPPD scores. GAPPD SCORES FOR NIGERIA AT THE STATE
LEVEL
GAPPD SCORES FOR INDIA AT THE STATE GAPPD intervention scores for Nigeria, by state, could only be calcu-
LEVEL lated based on vaccine coverage rates, as state-level coverage data
for the other GAPPD interventions were not available due to small
Twenty-seven states in India, for which relatively recent coverage data sample sizes.18 When calculated based on this limited set of data,
(2012-2013) were publicly available, were included in this subna- Nigeria’s state GAPPD scores ranged from 2% (Kebbi and Sokoto) to
tional analysis. Calculation of state GAPPD scores did not include 49% (Ekiti). As many as 7 states had below 10% GAPPD scores and
coverage levels for antibiotic treatment for children with pneumonia 15 had scores above 40%.
due to the unavailability of such data at the state level. Additionally,
the indicator used to assess zinc coverage in Indian states was the Geographic patterns in GAPPD scores by state are also notable,
percentage of children with diarrhea receiving zinc along with ORS with southern states generally scoring higher and having lower child
because coverage data on supplemental zinc by itself were not avail- mortality rates than northern states (see Fig. 5). This pattern of states
able in the survey sources. At the state level, coverage of zinc with with higher GAPPD scores having lower child mortality rates, with a few
ORS between 2012 and 2013 ranged from 26%-96%; however, the exceptions, is consistent with the pattern in India. Data on coverage
most recent zinc coverage estimates for India at the national level was disparities within each state were not available for Nigeria, however,
from 2005-2006, which was significantly lower (0.3%). This suggests as they were for India. National data on urban-rural vaccine coverage
that India has likely increased its zinc coverage since 2005, but due nonetheless revealed large disparities – a 37% disparity in pentavalent
to the lack of more recent national-level data, its GAPPD scores could (DTP-Hib-HepB) vaccine coverage and a 31% disparity in measles
not reflect the extent of its progress. vaccine coverage. Urban-rural disparities were also observed in some of
the treatment coverage values, although the differences were relatively
For the 27 states in India that were evaluated, GAPPD scores widely smaller (10-17%). (See Fig. 6.) Beyond spatially-based disparities,
varied by state (Fig. 4), but all were above the country’s overall GAPPD wealth disparities also existed in Nigeria. Between the lowest and
score (32%). This could be in part due to the exclusion of antibiotic highest wealth quintiles in Nigeria, there were stunning levels of dispari-
coverage data at the state level because of the lack of data, while the ties that spanned multiple GAPPD indicators – 73% in pentavalent
national coverage rate was relatively low (13%), according to the most vaccine coverage, 65% in measles vaccine coverage, 37% in access to
recent estimates. In addition, state-level zinc and ORS coverage rates treatment by a health care provider for children with suspected pneu-
(reported more recently) were much higher than the national rate monia, and 33% in ORS treatment in children with diarrhea.
reported in 2005-2006. In the top performing state (Goa), the GAPPD
score (66%) was nearly double the score of Meghalaya (38%), the
lowest performing state in the sample assessed. Furthermore, eight SUSTAINING MOMENTUM IN CHILD HEALTH
states in India showed large (>20%) coverage disparities between POST-2015
urban and rural populations within state borders for at least one of the
GAPPD interventions. Of these, urban coverage rates were consistently As the countdown to 2015 is in the final stretches, the next set of chal-
greater than rural coverage rates. These disparities were seen in both lenges facing the global health community post-2015 will be to maintain
the prevention and treatment type interventions. the gains of the past two decades and accelerate the momentum as we
continue to work towards the elimination of all preventable child deaths.
As seen in Fig. 4, states with lower overall GAPPD scores tended It is time we move beyond counting introductions and partial implemen-
to have higher rates of under-five mortality, compared to those tations of key interventions, and strive for universal scale-up and optimi-
with higher GAPPD scores, although that was not the case for all zation of these interventions. This will require great effort and innovation
states. These deviations may be due to causes of child mortality to establish quality data collection and monitoring systems that will allow
other than pneumonia and diarrhea, which are not factored into those on the ground to quickly identify access gaps in vulnerable and
GAPPD scoring. Furthermore, under-five mortality rates at the state hard-to-reach populations. In doing so, we will finally be able to work
level ranged from 15 to 83 per 1,000 live births, with 7 of the 20 towards achieving a world where equity in access to lifesaving measures
states with available data having child mortality rates above the exists between countries, within countries, and between different
national average. Such disparities in child health outcomes, as well groups of people, whether it is by gender, wealth, religion, or ethnicity.
18. ICF International. (2014, June). Nigeria Demographic and Health Survey 2013. Retrieved from http://www.population.gov.ng/images/ndhs_data/ndhs_2013/2013_ndhs_final_report.pdf
12 | Pneumonia and Diarrhea Progress Report • 2014FIGURE 4: Overall GAPPD scores, relative to child mortality, for states in India, 2014
Sources: India Ministry of Health and Family Welfare. (2014). District
Level Household and Facility Survey-4. State Fact Sheet. (2012-
2013). Retrieved from https://nrhm-mis.nic.in/SitePages/DLHS-4.
aspx; Government of India, Ministry of Home Affairs - Office of the
Registrar General & Census Commissioner. (n.d.) Annual Health
Survey 2012-13 Fact Sheet. Retrieved from http://www.censusindia.
gov.in/vital_statistics/AHSBulletins/AHS_Factsheets_2012_13.html;
Government of India, Ministry of Home Affairs. (2011). Census
2011 – Primary Census Abstract Data Tables (India & States/UT –
District Level) [Data File]. Retrieved from http://www.censusindia.gov.
in/2011census/population_enumeration.html
Photo Credit: Adrian Brooks
Note: Under-five mortality rates were not available for all states, and thus
are only shown for states with available data.
FIGURE 5: Overall GAPPD scores, relative to child
mortality, for states in Nigeria, 2014
Source: ICF International. (2014, June). Nigeria Demographic and Health Survey 2013. Retrieved from
http://www.population.gov.ng/images/ndhs_data/ndhs_2013/2013_ndhs_final_report.pdf; Nigeria National
Bureau of Statistics, 2013. Retrieved from nigeria.prognoz.com
International Vaccine Access Center (IVAC) • Johns Hopkins Bloomberg School of Public Health | 13FIGURE 6: 2013 Levels of GAPPD Intervention Coverage by Wealth Quintile in Nigeria
FIGURE 6: 2013 Levels of
% of >5 Children with diarrhea
receiving zinc supplements GAPPD intervention coverage,
by wealth quintiles in Nigeria.
Data on exclusive breast-
% ofENDNOTES
UNICEF. (2014). Committing to Child Survival: A Promise Renewed. Progress Report 2014. Retrieved from http://files.unicef.org/publications/
1
files/APR_2014_web_15Sept14.pdf
Liu, L., Oza, S., Hogan, D., Perin, J., Rudan, I., Lawn, J. E., Cousens, S., Mathers, C., Black, R. E. (2014). Global, regional, and national
2
causes of child mortality in 2000-13, with projections to inform post-2015 priorities: an updated systematic analysis. Lancet. Retrieved
from http://www.jhsph.edu/departments/international-health/centers-and-institutes/institute-for-international-programs/projects/mcee-child-
cause-of-death-estimates.html
WHO/UNICEF. (2013). Ending Preventable Child Deaths from Pneumonia and Diarrhoea by 2025. The Integrated Global Action Plan for
3
Pneumonia and Diarrhea (GAPPD). Retrieved from www.unicef.org/media/files/Final_GAPPD_main_Report-_EN-8_April_2013.pdf
WHO. (2013). MDG 4: Reduce child mortality. Retrieved from http://www.who.int/topics/millennium_development_goals/child_mortality/
4
en/"http://www.who.int/topics/millennium_development_goals/child_mortality/en/
UN Population Division. (2013). World Population Prospects: The 2012 Revision. Retrieved from http://esa.un.org/unpd/wpp/Excel-Data/
5
population.htm"http://esa.un.org/unpd/wpp/Excel-Data/population.htm
International Vaccine Access Center (IVAC) at Johns Hopkins Bloomberg School of Public Health. (2013). Pneumonia and Diarrhea Progress
6
Report 2013. Retrieved from http://www.jhsph.edu/research/centers-and-institutes/ivac/resources/IVAC-2013-Pneumonia-Diarrhea-
Progress-Report.pdf
Gavi. (n.d.) Value of vaccination. Retrieved from http://www.gavi.org/about/value/
7
Munos, M. K., Fischer Walker, C. L.., & Black, R. E. (2010). The effect of rotavirus vaccine on diarrhoea mortality. International Journal of
8
Epidemiology, 39, 156-162. doi: 10.1093/ije/dyq022
International Vaccine Access Center (IVAC) at Johns Hopkins Bloomberg School of Public Health. Vaccine Information Management System
9
(VIMS). Data as of Oct 2014.
10
WHO/UNICEF. (2014, July). WHO/UNICEF Estimates of National Immunization Coverage for 1980-2013, as of July 2014. Retrieved from
http://www.who.int/immunization/monitoring_surveillance/data/en/
11
Gavi, The Vaccine Alliance. (2014, June). Countries approved for support. Retrieved from http://www.gavi.org/results/
countries-approved-for-support/
12
International Vaccine Access Center (IVAC), Johns Hopkins Bloomberg School of Public Health. (2014). Vaccine Information Management
System (VIMS) Global Vaccine Introduction Report, September 2014. Retrieved from http://jhsph.edu/research/centers-and-institutes/ivac/
vims/
13
Bhutta, Z. A. et al. (2013). Interventions to address deaths from childhood pneumonia and diarrhoea equitably: what works and at what
cost? The Lancet, 381 (9875), 1417-1429. doi:10.1016/S0140-6736(13)60648-0
14
Black, R. E., Victora, C. G., Bhutta, Z. A., Christian, P., de Onis, M., Ezzati, M., … the Maternal and Child Nutrition Study Group. (2013).
Maternal and child undernutrition and overweight in low-income and middle-income countries. The Lancet, 382(9890), 427-451.
doi:10.1016/S0140-6736(13)60937-X
15
UNICEF. (2014). Multiple Indicator Cluster Surveys / MICS5 – Chad 2010. Retrieved from http://www.childinfo.org/mics5_surveys.html
16
UNICEF. (2010, August). A successful start in life: Improving breastfeeding in West and Central Africa. Retrieved from http://www.unicef.org/
cotedivoire/wcaro_improving_breastfeeding_en.pdf
17
Were, W., & Qazi, S. (2014). The context and key problems of pneumonia diagnosis in low resource settings [PowerPoint slides]. Retrieved
from http://www.malariaconsortium.org/userfiles/file/Were_Qazi-%20Diagnosis%20pneumonia%20slides.pdf
18
ICF International. (2014, June). Nigeria Demographic and Health Survey 2013. Retrieved from http://www.population.gov.ng/images/ndhs_
data/ndhs_2013/2013_ndhs_final_report.pdf
International Vaccine Access Center (IVAC) • Johns Hopkins Bloomberg School of Public Health | 15You can also read