When is Dinner Served? Predicting the Spring Phytoplankton Bloom in the Gulf of Maine
←
→
Page content transcription
If your browser does not render page correctly, please read the page content below
When is Dinner Served? Predicting the Spring
Phytoplankton Bloom in the Gulf of Maine
Denise Blaha, denise.blaha@unh.edu, Author
Amy Holt Cline, amy.cline@unh.edu, Author

UNH Coastal Observing Center
Institute for the Study of Earth, Oceans, and Space
University of New Hampshire
Published September 23, 2004, Last Revision: June 27, 2005

Description

                                             Phytoplankton are microscopic plants that
form the base of the marine food chain. Though they are small, the energy they
capture from the sun through photosynthesis helps to sustain almost all life in the
ocean. They're also important to life on land: phytoplankton produce more than half
of Earth's oxygen supply.

In this chapter, users learn about the variables that influence the abundance of
phytoplankton. They apply this knowledge to make predictions about the timing of
the spring phytoplankton bloom in the Gulf of Maine. Users obtain and graph data
from buoy monitoring stations and interpret them to make their predictions. They
check their predictions by examining chlorophyll concentration data at each buoy.
Users also compare their predictions with reality by obtaining and examining MODIS
satellite images to view the full extent of the bloom over time.

This chapter is part of the Earth Exploration Toolbook. Each chapter provides
teachers and/or students with direct practice for using scientific tools to analyze
Earth science data. Students should begin on the Case Study page.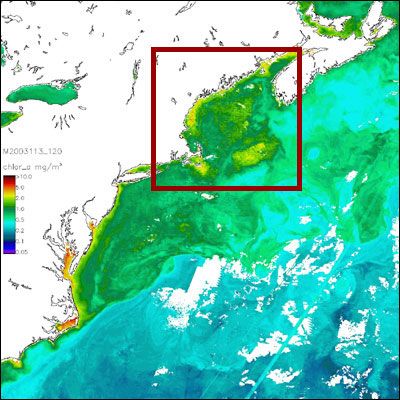
Teaching Notes
Example Output
Users will produce and analyze graphs showing water temperature, salinity, density,
and chlorophyll concentration for 2004 at four buoy locations in the Gulf of Maine.
The multi-year graph of chlorophyll concentration below serves to illustrate the
distinct fall and spring phytoplankton blooms that occur there each year.

The Gulf of Maine is outlined in the red box in the image below. The image shows
chlorophyll levels recorded by the MODIS (Moderate Resolution Imaging
Spectroradiometer) sensor onboard the Terra satellite on April 23, 2003. The dark
red pixels show areas where chlorophyll levels were 10.0 mg/cubic meter.
Grade Level
Grades 7-12

Learning Goals
After completing this chapter, users will be able to:

      • Explain the ecological importance of phytoplankton
      • Describe the components that influence a phytoplankton bloom
      • Interpret satellite images in order to correlate buoy data
      • Use the scientific process to predict the onset of the spring bloom based on
         background data
      • Download and analyze graphs of oceanographic buoy data
      • Identify geographic features in the Gulf of Maine

       Learning Contexts
       This chapter demonstrates how oceanographers study the phenomena of the
       spring phytoplankton bloom using a variety of different oceanographic
       technologies. Through understanding some of the basic factors that influence
       the productivity in the Gulf of Maine, students will be able to make educated
       guesses about when the spring bloom may occur based on buoy data and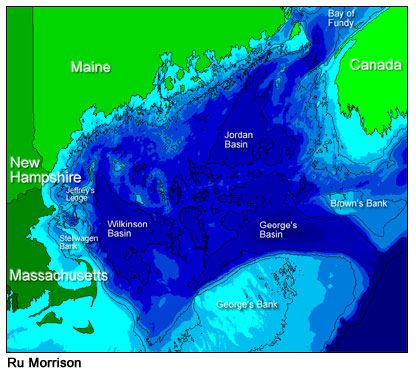
satellite images. This inquiry based method will teach students to ask
questions in order to solve a puzzle which scientists are also actively trying to
answer. Depending on how much explanation and preparation is done for the
students this could involve students from a variety of learning levels.

Science Standards
The following National Science Education Standards are supported by this
chapter:

      • 12ASI1.1 Identify questions and concepts that guide scientific
           investigations. Students should form a testable hypothesis and
           demonstrate the logical connections between the scientific
           concepts guiding a hypothesis and the design of an experiment.
           They should demonstrate appropriate procedures, a knowledge
           base, and conceptual understanding of scientific investigations.

      • 12ASI1.5 Recognize and analyze alternative explanations and
           models. This aspect of the standard emphasizes the critical
           abilities of analyzing an argument by reviewing current scientific
           understanding, weighing the evidence, and examining the logic so
           as to decide which explanations and models are best. In other
           words, although there may be several plausible explanations, they
           do not all have equal weight. Students should be able to use
           scientific criteria to find the preferred explanations.

      • 12CLS4.4 Living organisms have the capacity to produce
           populations of infinite size, but environments and resources are
           finite. This fundamental tension has profound effects on the
           interactions between organisms.

       Time Required
       Three 45 minute classes.

       Other Resources
       Water temperature, salinity, and density graphs
       In the event that the GoMOOS server is down or running too slowly to
       provide the data for a large class situation, you can access graphs of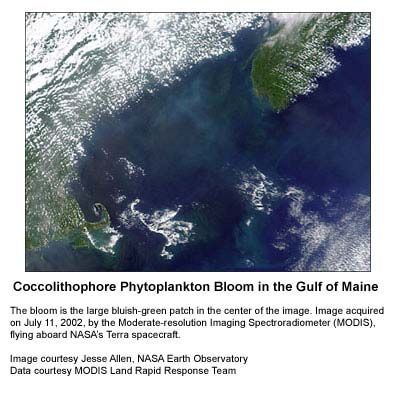
water temperature, salinity, and density for buoys B, E, I, and M at
this link.

Chlorophyll graphs
Case Study: When is Dinner Served? Predicting
the Spring Phytoplankton Bloom in the Gulf of
Maine

To a fish, nothing beats phytoplankton. Small fish eat the microscopic plants for
energy and nutrients. In turn, bigger fish eat the smaller fish. Even larger fish (and
humans!) eventually eat the bigger fish. As phytoplankton are at the base of this
food chain, it is not an exaggeration to state that phytoplankton sustain almost all
life in Earth's oceans. (Bacteria in some deep sea ecosystems provide an additional
source of food for marine life, but that process is not addressed in this chapter.)

Like all plants, phytoplankton need sunlight, carbon dioxide, water, and nutrients to
grow. Because sunlight is most readily available near the surface of the sea, that's
where phytoplankton develop. Phytoplankton contain chlorophyll-a, a pigment that
gives the microscopic plants a greenish color. Depending on the phytoplankton
species and their abundance in a region, the color of the ocean surface where they
are growing actually changes color, ranging from green to brown to red. When these
colors appear, the phytoplankton are said to be in "bloom." The blooms—essentially
dense concentrations of chlorophyll—can be detected in satellite images. Scientists
study these images to monitor the ocean's biological productivity. Commercial
fishermen and whale watching boats also access these images: where phytoplankton
are blooming, dinner is served! Schools of juvenile fish, sand lance, mature fish, and
whales may also be found in these areas.

Phytoplankton also play a critical role in the global carbon cycle. Phytoplankton
consume carbon dioxide from the ocean during photosynthesis and emit oxygen as a
by-product. In fact, more than half of the oxygen in Earth's atmosphere is produced
by ocean phytoplankton. As a result of photosynthesis, the oceans are a net sink (or
consumer) for carbon dioxide. If the amount of phytoplankton in the global ocean is
reduced, as a result of climate change for example, atmospheric carbon dioxide could
increase.

Since carbon dioxide and water are readily available at the ocean surface, the main
factors that limit phytoplankton development are the availability of nutrients and
sunlight. The nutrients phytoplankton need for growing (nitrate, phosphate, and
silicate) are found in the colder, deeper areas of the ocean. Shifting ocean currents
(called upwellings) and water mixing by wind bring these nutrients to the surface.
When these nutrients are available at the surface and the amount of sunlight
increases in the spring each year, the phytoplankton bloom.

In this chapter, you will gain an understanding of the critical role phytoplankton play
in the marine food chain by predicting the timing of the spring phytoplankton bloom
in the Gulf of Maine. You will access buoy data on water temperature, salinity, and
density—variables that influence the timing of the spring bloom. These data are
available from buoy monitoring stations in the Gulf of Maine Ocean Observing
System (GoMOOS). You will graph these data and interpret them to predict when the
bloom should occur. You will compare your predicted bloom date to the actual date
by examining chlorophyll data. Finally, you will acquire MODIS (Moderate Resolution
Imaging Spectroradiometer) satellite images of this region from the University of
New Hampshire's Coastal Observing Center to see the phytoplankton bloom as
viewed from 400 miles above Earth.
Part 1-What Causes a Phytoplankton Bloom in
the Gulf of Maine?

Colorful phytoplankton blooms are complex phenomena that have attracted
fishermen and perplexed scientists for decades. A phytoplankton bloom has been
defined as a "high concentration of phytoplankton in an area, caused by increased
reproduction; [this] often produces discoloration of the water" (Garrison, 2005).
More generally, a bloom can be considered as a phytoplankton population
explosion—blooms occur when sunlight and nutrients are readily available to the
plants, and they grow and reproduce to a point where they are so dense that their
presence changes the color of the water in which they live. Blooms can be quick
events that begin and end within a few days or they may last several weeks. They
can occur on a relatively small scale or cover hundreds of square kilometers of the
ocean's surface. In the Gulf of Maine, spring and fall blooms occur on an annual
basis. Smaller blooms have also been detected during other times of the year.
Scientists have not yet been able to predict the exact date and location of a
phytoplankton bloom before it occurs, but through the use of satellites, long term
moored buoys and monthly oceanographic research cruises we are able to make
better educated guesses. The data analysis you will do in this chapter is considered
cutting edge research for the advancement of science!

Scientists consider many factors that influence where and when phytoplankton
blooms occur. Some of the most important factors include water temperature,
density, and salinity, hydrography of the region, availability of nutrients, what
species and the amount of phytoplankton biomass that is present, what types of
zooplankton are grazing on the phytoplankton, and available sunlight levels. There
are very few "permanent" parameters (i.e. bathymetry/hydrography) in this system;
the constantly changing values of most parameters make blooms somewhat difficult
to study. This primer is intended to focus only on the oceanographic principles that
influence phytoplankton blooms that can be monitored by instruments on buoys and
satellites.

Gulf of Maine
Scientists have been studying microscopic organisms in the oceans for decades using
simple collection nets and collecting jars. Today, scientists study phytoplankton using
research vessels, long term moored buoys, and satellite instruments. Based on
oceanographic studies that utilize all of these methods, we now know that
phytoplankton blooms occur around the world in regions of upwelling or along
convergent currents known as fronts. In the Gulf of Maine, the dynamics are very
unique. In studying the Gulf of Maine ecosystem, it is essential to understand how
the bathymetry (depth and shape of the ocean floor) affects water movement in the
region.
The Gulf of Maine is almost entirely enclosed by land. Three Canadian Provinces and
three US states surround the Gulf of Maine creating a semi-circle shaped body of

water that is still connected to the Atlantic Ocean.

A signature feature unique to the Gulf of Maine is the underwater ledges and banks
that separate the water within the Gulf from the Atlantic Ocean. Before bathymetric
maps, many people thought there was no separation between Atlantic waters and
the Gulf but we now know that Georges Bank and Browns Bank are just two of the
large underwater ledges that create a barrier between waters off shore and the inner
Gulf of Maine. The Northeast Channel and the Great South Channel are the two main
valleys that allow most of the water to enter and exit from the region. As seen in this
picture, the red arrows indicate denser water flowing in through the Northeast
Channel. This band of water can be both warm and cold depending on the current
flow and can bring in new sources of nutrients trapped in this submerged layer of
water. Water still flows continuously over the ledges creating nutrient mixing and
fast moving currents which is why you will see a high chlorophyll reading in the
satellite images in that area. Inside the Gulf, there are 3 prevalent basins known as
Wilkinson Basin, Georges Basin, and Jordan Basin. These also play a large part in the
physical dynamics of the Gulf of Maine. Because of the speed of the incoming
currents as well as other forces, water in the Gulf of Maine circulates
counterclockwise. Cold water from the north, known as the Labrador Current, and
warm water from the south, known as the Gulf Stream, are mixed outside the Gulf
before entering. The combination of these consistent currents, the direction of flow,
the bathymetry and much more, makes the physical structure of the water column
very different at each buoy location. This is why it is important to include different
buoys in your study.
Stratification
The tilt of Earth's axis and its revolution about the sun cause seasons to change. We
know the difference between summer and winter weather on land, but we are less
familiar with how the weather changes underwater. The ocean experiences changes
in seasons too! We can track how ocean "weather" changes by studying changes in
the temperature, salinity, and density of columns of water from the ocean bottom to
the surface. The concept of such a vertical sample of water is referred to as the
water column.

In the atmosphere, air temperature, humidity, and pressure change with altitude.
Similarly, various parameters underwater change with depth: these include water
temperature, salinity, density, and pressure. The density (mass per unit volume) of
seawater is controlled by its temperature and salinity (Spokes, 2003). The higher the
salt content (salinity) of water, the higher the density. Conversely, the higher the
water temperature, the lower the density. Differences in density are responsible for
things sinking or floating: less dense things float on top of more dense things.
Therefore, relatively fresh, warm water will float on top of salty, cool water. When
ocean water becomes separated into layers of similar densities, it is said to be
stratified or that stratification has occurred. Density stratification is the formation of
layers, with each deeper layer being denser (weighing more per unit of volume) than
the layer above it (Garrison, 2005). The Gulf of Maine, like the ocean, is divided into
three density zones, the surface zone, the pycnocline—a layer in which the density
increases significantly with an increase in depth, and the deep zone (Garrison,
2005). The depth of each zone varies with location.
In vertical profiles of water from the Gulf of Maine (above), cool, dense water is on
the bottom and warmer, less dense water floats on top. This situation is most
obvious in the spring and summer profiles. Both the color and the black lines in each
graphic indicate water temperature at various depths. In winter, you can see that the
water is generally uniform in temperature throughout the water column due to heavy
mixing. In summer, water near the surface is warmer and therefore less dense than
deeper water.

Just as storms mix the atmosphere, heavy winds, strong currents, and tidal forces
mix water in the ocean. The mixing churns up relatively stable stratified water,
bringing dense water water up and forcing less dense water down. This brings
nutrients that were confined to the deep zone to the surface zone. In the winter
months, the water column is fully mixed due to the prevalence of winter storms.
Even if storms are absent, the cold atmospheric temperatures of winter chill the
surface layers of the ocean. The result is that surface waters becomes too dense to
be supported and they sink to the bottom, displacing the less dense, nutrient-rich
water below, keeping the water mixed. Once spring comes, the higher atmospheric
temperatures warm the surface waters, decreasing their density, and stratified layers
develop again. This annual cycle of mixing and stratification repeats each year. The
status of the water column is monitored by instruments on buoys: by analyzing
these data, we can interpret if the water is mixed or stratified when blooms occur.

Nutrients
Nutrients play an essential role in supporting a phytoplankton bloom. Phytoplankton
rely on sunlight and available nutrients for energy and growth. Carbon dioxide,
water, and light are necessary for photosynthesis. Nitrate, phosphate, silicate, and
carbonate are all important in the production of plant matter. Silicon, phosphorus,
and nitrogen also play a key role in growing plants. Because their concentrations
fluctuate, nitrogen and phosphate influence the rates of phytoplankton production in
the ocean. Concentrations of nutrients in the water column vary depending on the
time of year, density of water, how they entered the ocean, and how much mixing
has taken place during that season. In addition, each of these constituents have
different residence times, or time remaining in the water column. This factor has a
direct influence on the intensity of the phytoplankton bloom. In summary, nutrient
availability is influenced by a range of complex factors in the Gulf of Maine.

How do we know what nutrients are available at different depths in the ocean?
Currently, nutrient data is collected from water samples gathered on research
vessels. Long term oceanographic buoys are not regularly equipped with the
technology to measure nutrient levels, although research is currently being done to
outfit buoys with real time nutrient sensors. What the water samples do tell us is
that nutrient availability in the water column changes with the seasons. Winter
mixing brings nutrients up from below, concentrating them near the surface. Spring
warming creates a surface layer that floats on top, halting the supply of nutrients
brought to the surface. As spring turns to summer, nutrients in the surface layer are
consumed by phytoplankton, reducing nutrient availability at the surface. As summer
sets in, phytoplankton die and drift to the bottom, taking the nutrients they ingested
with them. Surface waters are now left with few nutrients available. Through the
summer, this situation is reinforced as the surface waters are warmed and the stable
situation of stratification sets in. Once autumn sets in with cooler days, a limited
amount of vertical mixing brings nutrients up from below. In winter, heavy winds
and plummeting temperatures cause strong mixing again. In general, when nutrients
are found near the surface, they are not plentiful at deeper levels and vice versa. A
more in-depth exploration of nutrient dynamics and how they influence
phytoplankton blooms on a seasonal basis can be explored by studying ocean
chemistry.

Blooms
Spring brings warmer temperatures and increased sunlight, creating a thermocline
that traps nutrients at the ocean surface. This allows phytoplankton to absorb energy
and take in the nutrients they need to photosynthesize and multiply. The warming of
the surface layer keeps this water less dense, so it stays afloat. Phytoplankton
respond very quickly when the right conditions occur, growing and reproducing as
soon as a slight stratification of the water column occurs. As phytoplankton continue
thriving in the nutrient-rich surface zone where they receive sunlight, they may
become so plentiful that the ocean waters turn green, brown, or red from the
chlorophyll they contain. As the phytoplankton use up the available nutrients
however, they begin to die and drift to the bottom. As autumn begins, cooler days
cause some vertical mixing that may bring nutrients up from below resulting in a
relatively smaller fall bloom. Once winter begins, plummeting temperatures and
frequent storms cause heavy mixing. As phytoplankton do not remain at the surface
in this mix, they do not have ready access to sunlight, so blooms do not occur in the
winter.

Major Spring Bloom Species
The community structure of a phytoplankton bloom depends on the geographic

location of the bloom as well as its timing and duration.                             In
the Gulf of Maine, some of the common species found during the spring
phytoplankton bloom are diatoms. These images show two species of diatoms, both
are single celled organisms that are linked to form chains. Diatoms are often seen
during the initial stages of a bloom. Generally, they consume nutrients and multiply
before another plankton group, the dinoflagellates emerges. Diatoms grow faster
than dinoflagellates. They generally bloom first if there is enough silicic acid in the
water column. Diatoms use silica to produce their glass-like cell wall structure.

Summary

Phytoplankton blooms are created by an array of complex factors and influences that
can combine to form conditions that cause a bloom, or a high concentration of
phytoplankton in an area. Stratification of the water column with an influx of
nutrients and sunlight can create an exciting display of blooming life. With an
introductory level of information and instructions on how to find and graph data, you
are now better equipped to make educated guesses about when the spring bloom
might happen. A few years ago, we did not have access to the amount of data that is
now available because the necessary tools were not in place. With long term data
sets collected from moored buoys such as the GoMOOS buoy system and an
extensive library of satellite images, teachers and their students are now able to ask
similar questions that can lead to conclusions that are useful to scientists.
Understanding the ocean is difficult and complex yet with these new tools it is now
more approachable than ever. Enjoy investigating the mystery of the spring bloom!

References:
Garrison, Tom. Oceanography: An Invitation to Marine Science. Belmont CA,
2005.
Spokes, L. Phytoplankton and nutrients in the oceans. ESPERE. (16-October 2003).
Miller, Charles. Biological Oceanography. Oxford UK, 2004.
Part 2—Explore GoMOOS
In any step, click the Show me link to reveal extra information. If you prefer a
printout of the full set of instructions for this part, choose Print from the File menu.
Step 1-Learn about Buoys
Oceans cover over 70% of Earth’s surface and contain 97% of Earth's water. The
oceans regulate global carbon dioxide (CO2) levels by absorbing roughly half of
Earth's atmospheric carbon dioxide. They are also responsible for producing more
than half of Earth's oxygen supply because they support photosynthesizing plants.
Our oceans are home to hundreds of thousands of plant and animal species plus
thousands or even millions of other species that have not yet been identified.1
Additionally, ocean commerce is a multi-billion dollar industry: fishing, international
trade, communications, recreation, and tourism all depend at least in part on our
oceans.
Given the ecological and economic importance of Earth's oceans, it's vital that we
collect and maintain information about them to monitor their health and identify
potential threats. Data on such variables as wind direction, wave height, and air
temperature, plus water temperature, salinity, and current speed and direction at
different depths are now routinely collected by moored (anchored) buoys equipped
with sensors at various depths along their tethers. These buoys transmit the data to
shore as they are collected and the data become available right away via the
Internet or phone. The ability to access "real-time" data on oceanographic conditions
is beneficial to commercial fishermen, sailors, scientists, meteorologists, search and
rescue personnel, and public health officials.
1
We will know more about the number of aquatic plants and animals soon. A Census
of Marine Life is currently underway. This 10-year global initiative involving
researchers from more than 50 nations will help quantify the diversity and
distribution of marine life and describe how it changes over time.
Step 2-Explore the GoMOOS Buoys
The Gulf of Maine Ocean Observing System (GoMOOS) is recognized as a leader in
coastal ocean observing technology. GoMOOS deployed and maintains 10 buoys in
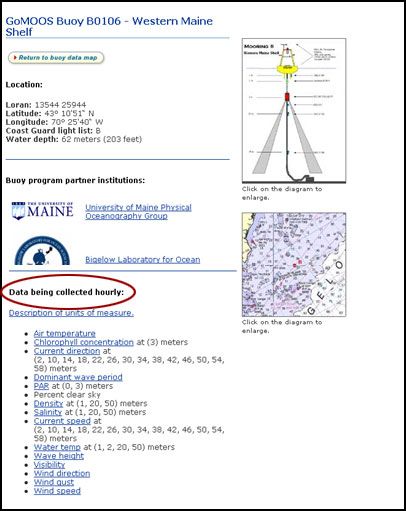
the Gulf of Maine and provides access to real-time data from them plus 11 otherbuoys (maintained by the National Oceanic and Atmospheric Administration) in the region. Click this GoMOOS Hourly Data link to access an interactive map of the buoys in a new window. Click an individual buoy to obtain the most recent data for that buoy. Click the "Description of station & location" link immediately to the right of the map to learn more about the buoy. Hide Take a quick look at the map to familiarize yourself with the locations of Buoys B, E, I, and M. These are the buoys for which you will request and analyze data to predict when the spring phytoplankton bloom will occur. Step 3-Compare data from GoMOOS Buoys
Compare data from one buoy to another. Once you have chosen a station, click the
"Compare this station to others" link at the right of the buoy map.

Keep the first buoy you chose or select a new one from the pull-down menu. Select a
second and/or third buoy from their respective pull-down lists. Click the show data
button to see the results. What can you tell about each location from the data?

 Hide
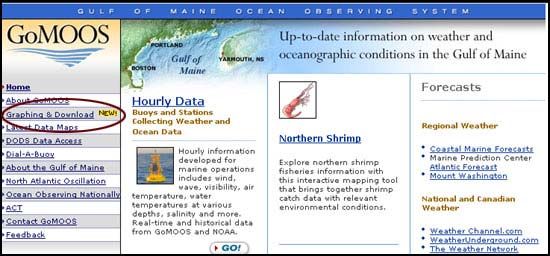
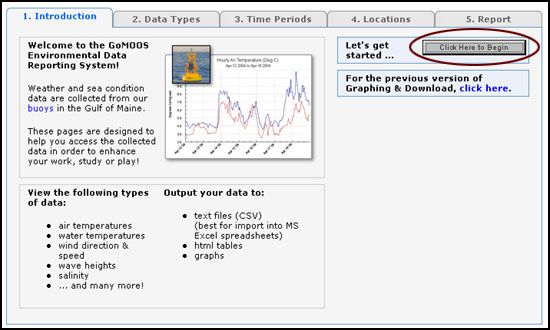
Part 3—Retrieve and Graph Buoy Data
In any step, click the Show me link to reveal extra information. If you prefer a
printout of the full set of instructions for this part, choose Print from the File menu.

Step 1-Request Water Temperature Data for Buoy B

Now that you know some of the basics about phytoplankton blooms and you've seen
the types of data that are available from buoys, you'll set up several data requests.
You'll request your data reports as graphs and use them to predict the spring
phytoplankton bloom for 2004. Using a year that has already passed will allow you to
check your prediction against reality.
Click the GoMOOS logo in the upper left of the interactive buoy map page to access
the GoMOOS home page. Click the Graphing & Download link on the left to access
the data request interface.

 Hide

If this is your first visit to GoMOOS, you'll see a request to register as a user.
GoMOOS can serve their customers better if they know a little about them—if you
don't mind providing this registration information, enter it now and click the
Register button. Or, you can click the Skip Registration button and proceed to the
next step.

On the Introduction tab, click the Click Here to Begin button.

 Hide
By examining water temperature, salinity, and density at various depths for several
buoys, you'll be able infer when the water column at each location is mixed or
stratified. The first location you'll examine is Buoy B, a near-shore buoy located
northeast of Portsmouth, NH.
      1. On the Data Types tab, select Water Temperatures from the pull-down
         list.
                 o   Select Daily Average and keep the default unit of
                     measurement as Degrees Centigrade.
                 o   Click the Add Data Type button.
                      Hide
2. Click the Time Periods tab.
o Check the box labeled Custom Date and enter01/01/2004
to 12/31/2004.
o Click the Add Time Period button
Hide
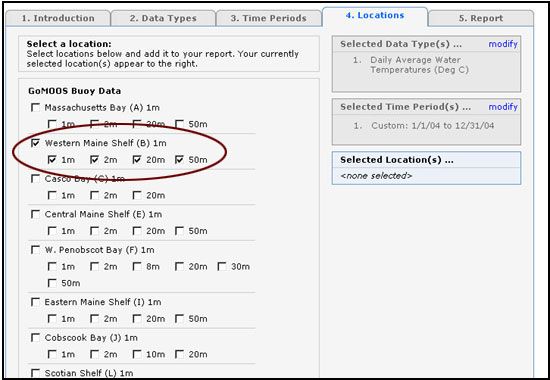
3. Click the Locations tab and click the checkbox next to Buoy B. To get all
the temperature data from different depths, keep all the default
checkboxes GoMOOS has marked.
Hide4. At the bottom of the list, click the Add Location button. 5. To request the dataset you've selected, click the Report tab and pause briefly while GoMOOS assembles the data. Step 2-Graph the Water Temperature Data for Buoy B GoMOOS offers several output format options. For our purposes, choose the Graph option. Since this is the default setting, simply click the Create Report button to generate the graph. Hide
You'll be making a total of 12 graphs. You can print each window by clicking
the Print Window link or you can save them electronically. To save them as
bitmap images place your cursor over the graph, right-click your mouse
button (on a Mac, press the control key (ctrl) on your keyboard and click the
graph), and choose the Save Picture As… option. Save each graph with a
descriptive name. For example, you might save this first file as
Buoy_b_water_temp.bmp

Step 3-Retrieve and Graph Density and Salinity Data for Buoy B

Set the water temperature graph aside for a moment. Set up requests and
generate graphs of density and salinity data for the same location, Buoy B.
Since the time period will stay the same, you only need to change the data
type.
Click the Data Types tab and click the remove all link to clear your previous
request. Select Density from the pull-down list. Specify Daily Average as
the time step.

 Hide
Click the Report tab and the Create graph button to graph density as a
function of water depth. Print and/or save this graph and set it aside.
Finally, obtain the salinity data for 2004 for Buoy B. On the Data Types tab,
remember to click the remove all link under Selected Data Type setting
before adding salinity. Graph these data, and print or save the graphs.

Step 4-Retrieve and Graph Water Temperature, Density, and
Salinity Data for Other Buoys

Repeat the steps above to obtain water temperature, density, and salinity
data for 2004 for Buoys E, I, and M. Generate graphs of these data and save
the graphs. When finished, you should have 12 plots: 3 graphs each for the 4
buoy locations.
Special Note for Buoy M: Buoy M has multiple depths available. Select only
the 1 meter, 2 meter (where applicable), 20 meter and 50 meter depths.
Part 4—Analyze Graphs to Predict the Bloom
In any step, click the Show me link to reveal extra information. If you prefer a
printout of the full set of instructions for this part, choose Print from the File menu.

Step 1-Group the Graphs by Buoy Location

Examine the changes in water temperature, density, and salinity at each of the four
buoy locations.

      • Observe how each parameter changed at the surface and at depth over the
          year.
      • Consider what you learned about stratification and mixing and how these
          conditions can be detected on your graphs.
      • Compare your graphs with the vertical profiles for each season in Part 1.
          Do you see how each graph represents the annual cycle of mixing and
          stratification?

       Step 2-Analyze the Graphs to Predict the Timing of the Spring
       Bloom

       Interpret your graphs for each location to understand what was happening to
       the water column through the year and when a bloom might occur. Use the
       following questions to guide you in making a prediction about the timing and
       location of the spring bloom for 2004. Refer back to Part 1 or consult other
       resources as necessary.

             1. Generally, how do water temperatures change with increasing
                  depth ?
             2. How does salinity change with increasing depth?
             3. How does density change with increasing depth?
             4. What do your density graphs look like during times that the water
                  column is mixed? How do the lines on the density graph change
                  as the water becomes stratified?
             5. Knowing that blooms occur when phytoplankton have ready
                  access to sunlight and nutrients in a floating surface layer, make
                  a prediction of the month or week that a bloom might occur for
                  each buoy location.
             6. Does your predicted bloom date vary by buoy location? Consider
                  where each buoy is located in the Gulf. Can you explain any
                  difference in predicted bloom dates based on the buoy locations?
Part 5—Retrieve and Graph Chlorophyll Data In any step, click the Show me link to reveal extra information. If you prefer a printout of the full set of instructions for this part, choose Print from the File menu. Step 1-Obtain and Graph Chlorophyll Data Chlorophyll is the pigment that plants use for photosynthesis. As such, measurements of chlorophyll concentration can serve as an estimate of the biomass (or quantity) of phytoplankton in the water. When a bloom occurs, chlorophyll concentrations increase dramatically. On a graph of chlorophyll concentration over time, bloom events are represented by vertical spikes in the graph. Use the GoMOOS Graphing and Downloading pages again to generate graphs of chlorophyll levels for buoys B, E, I, and M. Select Chlorophyll as the data type and Daily Average as the unit of time. Hide Hide
How did your estimated date(s) of the phytoplankton bloom compare to the actual
bloom as indicated in the chlorophyll graphs at each buoy location?
Step 2-A Closer Look at Buoy M

When this chapter was written in July, 2004 we noticed something very striking
about the chlorophyll graph for Buoy M. We plotted chlorophyll at all four locations
on the same graph.

We can see that chlorophyll levels at Buoy M are dramatically higher (roughly 15
times higher!) on April 24 than the chlorophyll levels reported the week before.
These values greatly exceed the chlorophyll levels reported by any of the other
buoys. They look suspicious! As you can imagine, moored ocean buoys are subject to
a host of environmental influences such as wind gusts, storms, whales, and passing
ships. All of these can affect the buoy’s ability to record and transmit accurate ocean
measurements. A small collision with a ship, for example, might render a buoy
inoperable for some length of time. Instruments on the buoy can also malfunction,
resulting in erroneous measurements.

In assessing whether data are valid or not, it’s useful to consider all the information
that’s available about the data in question. In this case, we can see that chlorophyll
levels at Buoy M increased substantially in a short period of time. We can also see
that these levels exceed all other readings at this and other buoys. Probably most
importantly though, the buoy stops reporting data at all on May 17th, which
suggests it was taken "off-line" at that time, possibly for repairs or replacement.
Taken together, the information we have about the buoy suggests we should
probably disregard the chlorophyll data reported by Buoy M after mid-April when its
values went well outside the normal range.

Science is messy. This example illustrates that every observation must be carefully
considered and evaluated within the context of all the information that is known
about the data.

If you requested a graph of this same data today, it may look quite different from
this example. Data are routinely checked for quality and when problems are
identified, corrections are made or the incorrect data are "thrown out." Still, the
concept of evaluating all data before drawing any conclusions is a recurrent theme in
science and an important concept to keep in mind.

In the next section, we will use satellite images to gain another perspective on ocean
phytoplankton. This second set of chlorophyll measurements provides an additional
check on questionable data values.
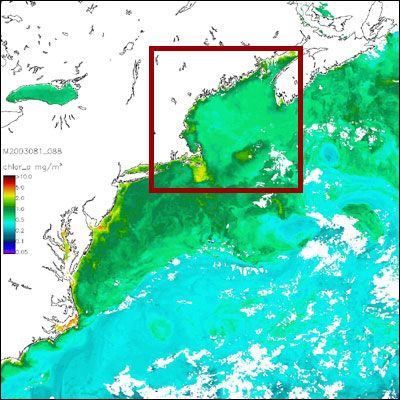
Part 6—Examine the Bloom in Satellite Images
In any step, click the Show me link to reveal extra information. If you prefer a
printout of the full set of instructions for this part, choose Print from the File menu.

Step 1-What Does a Bloom Look Like From Space?

What does a phytoplankton bloom look like to a NASA satellite orbiting 400 miles
above Earth's surface? Both NASA's Terra and Aqua satellites carry a MODIS
(Moderate Resolution Imaging Spectroradiometer) instrument onboard. These
satellites orbit the globe daily, providing images of Earth's land and ocean surfaces.
Two MODIS data products that are useful for oceanography are chlorophyll
concentration and sea surface temperature images.

The MODIS image below shows ocean chlorophyll on March 22, 2003. The Gulf of
Maine is outlined in a red box. White patchy areas over the ocean in the lower right
are clouds. The image was taken in early Spring before the phytoplankton bloom.

A month later, on April 23rd, 2003, the Gulf of Maine looked very different in the
ocean chlorophyll image below. Note the yellow and red areas indicating higher
chlorophyll levels.
Step 2-Obtain MODIS Images from WebCOAST

The MODIS images used in the previous step were acquired from WebCOAST at the
University of New Hampshire (UNH). WebCOAST provides an array of coastal ocean
observing data through their Coastal Observing Center. The WebCOAST satellite data
holdings include 8 day composite images of chlorophyll-a and sea surface
temperature for the years 2000 through 2004.

Go to the WebCOAST home page and click the Search and Retrieve Tool link in the
middle of the right side of the page.

WebCOAST offers 5 methods (called filters) to select and order data from their
database. You can search the database by Collection Name, Spatial Region,
Temporal Range, Keyword, or Freetext, using one filter or a combination of
filters to locate the data we want.
Since we are interested in MODIS ocean images, click the Keyword Filter tab.

From the keyword list at the bottom center, select Satellite Data Products then
click the Update Holding Count button.

 Hide
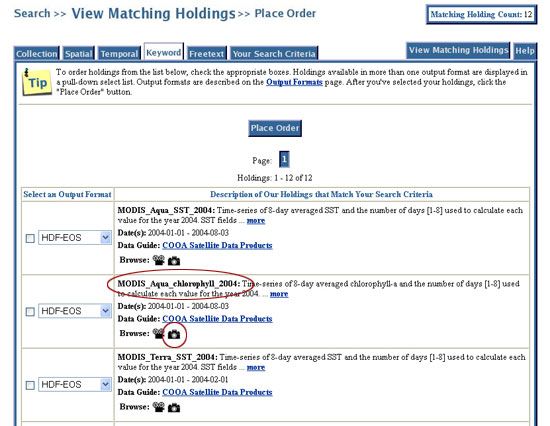
After you click the Update Holding Count button, note the Matching Holding
Count box in the upper right hand corner. This is the number of holdings (satellite
data products) in the WebCOAST database that match your search criteria. Click the
View Matching Holdings tab to see information about these images.
Find the holding labeled MODIS_Aqua_chlorophyll_2004. All of these satellite
holdings are available in output formats that can be imported into image processing
software such as Image J, we only want to look at the thumbnail images. Click the
small camera icon under the correct holding.

 Hide
The resulting page shows thumbnails of images produced every 8 days. These are
composite 8 day images: that is, they are averages of all cloud-free measurements
acquired during the 8 day period. Since clouds often prevent MODIS from imaging
the ocean surface, compositing is a way of eliminating the clouds. Still, there are
places where clouds persisted for 8 days. These areas appear white over the ocean
on the thumbnail images.

Scroll through and examine images around the date you predicted the bloom would
occur. Clicking any thumbnail image will bring up the full-size image. (Please Note:
Your browser may shrink the full-size image to fit in the browser window, rendering
it too small to see clearly. If you need to override this automatic resizing, use the tip
that appears below the questions.

Use the images that show chlorophyll levels around your predicted bloom date to
help you answer the following questions.

      1. Can you identify the spring bloom in the chlorophyll images?
      2. From the images, when would you say the bloom occurred? (you may be
          able to assign a beginning, peak, and end date for the bloom.
3. Where in the Gulf of Maine was the bloom most evident? Did the data
from the buoy(s) near that area indicate that the bloom might be more
pronounced there than in other areas?
4. How long did the bloom appear to last?
5. Based on your understanding of phytoplankton blooms, describe what
you would expect to find in the water column in the place where the
bloom occurred.
Does your browser shrink the images to fit in the browser window?
Newer versions of the Netscape and Internet Explorer browsers include a
default setting that automatically resizes images to fit in your browser
window. Since these MODIS images are quite large (1300 x 1300 pixels)
shrinking these images significantly reduces the clarity of the image. Here's
how to change the default settings:
Internet Explorer:
Tools Menu: choose Internet Options
Click the Advanced tab
Scroll down to the Multimedia section
Deselect Enable Automatic Image Resizing
Netscape:
Edit Menu: choose Preferences
Click Appearance
Deselect Resize Images to fit in Browser Window
Step 3-Compare MODIS Images for 2001 through 2004
Now let's compare the MODIS satellite images for this year to the previous
three years.
Show me how
Hide
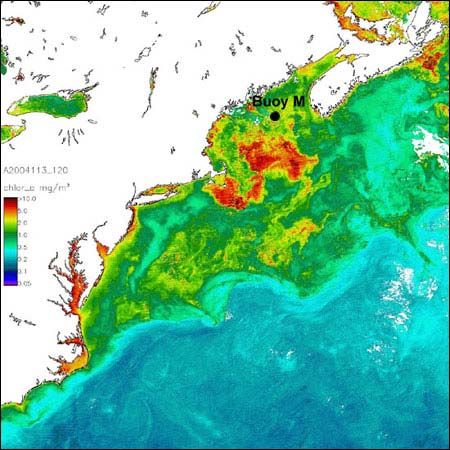
Step 4-A Final Look at Buoy M
Let's return to GoMOOS Buoy M, located roughly in the middle of the
Gulf of Maine. As you'll recall, this buoy was reporting exceptionallyhigh chlorophyll values in mid-April, 2004. We found reasons to suspect that these observations aren't valid and should be disregarded. The MODIS imagery provides an additional check on these questionable data. Above, we superimposed the location of Buoy M onto the MODIS chlorophyll image taken on April 22, 2004. The image makes it clear that the highest chlorophyll values aren't near Buoy M. The MODIS image of April 22 shows elevated chlorophyll levels throughout much of the region, with the highest levels in a large mass in the south- central region of the Gulf. Around Buoy M, chlorophyll levels appear to be approximately 2-5 mg chlor-a per cubic meter, nowhere near the measurements reported by that Buoy. When we consider all the information that we have about Buoy M, we can safely conclude that data from that buoy after mid-April, 2004 isn't valid and should be ignored.
Step 5-Conclusions

This chapter provided an overview of the factors that trigger a
phytoplankton bloom as well as an introduction to the data,
techniques, and analysis tools used to study these blooms.

The Gulf of Maine is a complex marine ecosystem. Many factors
interplay almost simultaneously to create a phytoplankton bloom and
our understanding of these factors is incomplete. While we can't know
precisely When Dinner is Served in the ocean, using the same data
and tools scientists use to study these blooms we can make a
reasonable prediction as to the timing, and in the process, gain a
better appreciation of this unique oceanographic phenomenon.
About the Tool and Data
Tool 1

Gulf of Maine Ocean Observing System (GoMOOS)

The Gulf of Maine Ocean Observing System (GoMOOS) provides hourly real-time
data on weather and oceanographic conditions in the Gulf of Maine.

Tool Builder
Gulf of Maine Ocean Observing System
P.O. Box 4919
Portland, ME 04112-4919

Tool Cost
Free

Tool Help
info@gomoos.org

Tool 2

WebCOAST (a Web-based Coastal and Ocean Observing System)

WebCOAST is a digital library of free coastal ocean observation data from the
University of New Hampshire. A complementary data distribution system, EOS-
WEBSTER, offers free, customized terrestrial Earth science data.
WebCOAST is the portal for data and information products developed by
researchers at the Coastal Observing Center. The Center's primary mission is to
develop new methodologies for monitoring coastal marine ecosystems with a focus
on the Western Gulf of Maine.

Tool Builder

WebCOAST
Dr. Annette Schloss, Project Manager
Complex Systems Research Center
Institute for the Study of Earth, Oceans, and Space
University of New Hampshire

Coastal Observing Center
Dr. Janet Campbell, Director
Ocean Process Analysis Laboratory
Institute for the Study of Earth, Oceans, and Space
University of New Hampshire

Science advisor for this chapter:
Dr. Ru Morrison
Ocean Process Analysis Laboratory
Institute for the Study of Earth, Oceans, and Space
University of New Hampshire

Tool Cost
Free

Tool Help
support@webcoast.sr.unh.edu
1-877-589-4909 (toll free)
Going Further
Other Data

Satellite Images of Phytoplankton Blooms from Around the World

20 spectacular images from NASA's Visible Earth
 Show me the list
 Hide

Other Techniques

Create a Thermocline

As described in the primer, thermoclines are often viewed as temperature versus
depth in vertical form. However, when many different depths are combined, the
graph can look cluttered and confusing and can be difficult for students to
understand. To give students a better understanding of the temperature/depth
relationship in the ocean, have students draw a thermocline by using pencil and
graph paper for a specific buoy at a specific depth either before or after they have
created a GoMOOS graph. This may help orient them to the relationship of how
temperature in the ocean can change as depth increases, depending on the season.

Other Tools

Phytopia: Discovery of the Marine Ecosystem

Phytopia is an educational CD-ROM produced by the Bigelow Laboratory for Ocean
Sciences. The CD-ROM is free; shipping and handling for U.S. orders is $3.95. Learn
more about Phytopia.
Ship Mates: Explore the Gulf of Maine As Oceanographers Do

Ship Mates, also from Bigelow Labs, is a suite of educational activities that
interactively guide users through working with on-line oceanographic data.

"Seasons in the Sea"

Dr. Ann Michelle Morrison has written a terrific overview   (RTF 23kB Aug6 05)   of seasonal
change in the Gulf of Maine.

Educational Resources from the Coastal Observing Center

The Coastal Observing Center at the University of New Hampshire has a wide array
of data products, visualizations, and curriculum materials available from their
website. Check it out!

Background Resources:

Miller, Charles. 2004. Biological Oceanography. Oxford,UK. Blackwell Science Ltd.
Garrison, Tom. 2005 Oceanography: An Invitation to Marine Science USA.
Thomson Learning, Inc.
You can also read