A synthetic satellite dataset of the spatio-temporal distributions of Emiliania huxleyi blooms and their impacts on Arctic and sub-Arctic marine ...
←
→
Page content transcription
If your browser does not render page correctly, please read the page content below
Earth Syst. Sci. Data, 11, 119–128, 2019
https://doi.org/10.5194/essd-11-119-2019
© Author(s) 2019. This work is distributed under
the Creative Commons Attribution 4.0 License.

            A synthetic satellite dataset of the spatio-temporal
            distributions of Emiliania huxleyi blooms and their
          impacts on Arctic and sub-Arctic marine environments
                                 (1998–2016)
                               Dmitry Kondrik, Eduard Kazakov, and Dmitry Pozdnyakov
       Nansen International Environmental and Remote Sensing Centre, Saint Petersburg, 199034, Russian Federation
                                Correspondence: Eduard Kazakov (ekazakov@niersc.spb.ru)

                                   Received: 24 August 2018 – Discussion started: 4 October 2018
                         Revised: 11 January 2019 – Accepted: 14 January 2019 – Published: 24 January 2019

       Abstract. A 19-year (1998–2016) continuous dataset is presented of coccolithophore Emiliania huxleyi distri-
       butions and activity, i.e. the release of CaCO3 in water and the decrease of uptake of dissolved CO2 by Emiliania
       huxleyi cells (e.g. Kondrik et al., 2018a), in Arctic and sub-Arctic seas. The dataset is based on optical remote-
       sensing data (mostly OC CCI data) with assimilation of different relevant in situ observations, preprocessed with
       authorial algorithms. Alongside bloom locations, we provide both detailed information on E. huxleyi impacts on
       carbon balance and the sub-datasets of quantified coccolith concentrations, particulate inorganic carbon content
       and CO2 partial pressure in water driven by coccolithophores. All data are presented on a regular 4×4 km grid at
       a temporal resolution of 8 days. The paper describes the theoretical and methodological basis for all processing
       and modelling steps. The data are available on Zenodo: https://doi.org/10.5281/zenodo.1402033.

1   Introduction                                                    occurring in both hemispheres, and steadily propagating in
                                                                    the poleward direction (Winter et al., 2014) due to CO2 ac-
Among the topics related to ongoing climate change, there           cumulation in the atmosphere and ensuing climate warming
are alterations in both biodiversity in marine environments         (Johannessen, 2008), Emiliania huxleyi blooms are believed
and the carbon balance in the atmosphere–ocean system               to be highly relevant to understanding the comprehensive na-
(Rost et al., 2008). In some specific cases both processes are      ture of the changes unfolding on our planet.
interrelated, being spurred up by one and the same agent(s).           Historically, the initial build-up of knowledge on coccol-
Along with other marine inhabitants, coccolithophores are           ithophores in general, and Emiliania huxleyi specifically, was
such entities. Specifically, we look at the algal species named     broadly based on in situ approaches effected in the course
Emiliania huxleyi – a unicellular planktonic organism that is       of both shipborne and laboratory activities. Extensive data
the most widespread coccolithophore in the world’s oceans.          were obtained on Emiliania huxleyi cell morphometry, inter-
Being simultaneously a calcifying and photosynthetic pri-           nal structure, intracellular dark reactions and photoreactions,
mary producer of, respectively, inorganic and organic carbon,       factors controlling and affecting the cell growth, as well as
Emiliania huxleyi, in the course of its life cycle, enhances        intrinsic optical properties, such as total sunlight and spec-
both the concentration of calcite and carbon dioxide partial        tral absorption, scattering and backscattering (Balch et al.,
pressure in ocean surface water. At least within Emiliania          1996a). In addition, regression relationships were established
huxleyi bloom areas, both processes are capable of chang-           between Emiliania huxleyi-driven changes in both inherent
ing the carbon balance and hence affect both CO2 fluxes be-         hydro-optical parameters and CO2 partial pressure in surface
tween the atmosphere and surface ocean and the aquatic bio-         water within the bloom area (Holligan et al., 1993).
geochemistry. Being a spatially huge phenomenon invariably

Published by Copernicus Publications.
120              D. Kondrik et al.: Satellite dataset of Emiliania huxleyi blooms in Arctic and sub-Arctic seas (1998–2016)

   However, as this phenomenon extends over marine areas in           Unlike the publications mentioned above, the present pa-
excess of hundreds of thousands of square kilometres (Balch        per reports on extensive concatenated original datasets gener-
et al., 2016; Kondrik et al., 2018a), and is spatially and tem-    ated for subpolar and polar seas of the Northern Hemisphere,
porally highly dynamic, a solely satellite remote-sensing ap-      viz. the North, Labrador (with adjacent North Atlantic open
proach is able to comply with the challenge of studying it.        waters), Norwegian, Barents, Greenland and Bering seas.
   Until recently, only a few satellite studies were performed     Based on the employed space-borne ocean colour informa-
and published on the typical locations of Emiliania hux-           tion, the obtained datasets are processed into a nearly two
leyi blooms and associated concentrations of particulate in-       decadal (1998–2016) time series for each of the target seas
organic carbon in surface ocean within the bloom area (e.g.        and marine areas. They encapsulate information about PIC
Gordon et al., 2001; Balch et al., 2016).                          and 1pCO2 values in surface water within the bloom area
   Prior to the publication by Kondrik et al. (2018a), to the      together with intraannual and interannual variations in the
best of our knowledge, only a couple of studies (Shutler et al.,   location and intensity of Emiliania huxleyi blooms over a va-
2010, 2013) were undertaken to retrieve from space-borne           riety of seas and across a nearly 20-year time period.
data either both the total content of inorganic carbon pro-           Conjoined with a wealth of presently available supplemen-
duced by a Emiliania huxleyi bloom (PIC) and an increase           tary data from satellite and shipborne missions on the envi-
in CO2 partial pressure (1pCO2 ) in surface water within the       ronmental conditions under which target Emiliania huxleyi
bloom area or else reveal intraannual and interannual varia-       blooms emerged and developed, the synthetic dataset we are
tions over long time periods in the location and intensity of      reporting on opens the way to detailed analyses of forward
Emiliania huxleyi blooms. No concatenated time series data         and feedback mechanisms governing the temporal and spa-
of a nearly 20-year duration are available to date on the as-      tial dynamics of this phenomenon. Further utilisation of the
sociated quantifications of bloom surface, bloom intensity or      results of such analyses in regional and global climatic mod-
1pCO2 for all Emiliania huxleyi blooms occurring within            els promises to predict future directions of development of
extensive latitudinal belts and encompassing waters of dif-        the phenomenon in question (Rost et al., 2008).
ferent oceans, i.e. marine tracts significantly distanced longi-
tudinally.                                                         2     Methodology and dataset content
   Meanwhile, the above-specified information is an indis-
pensable step towards a further pan-global inventory of the        Based on the facility of available satellite OC CCI (Ocean
effects produced by E. huxleyi blooms on both marine chem-         Colour Climate Change Initiative) and SeaWiFS data in the
istry and ecology, and CO2 exchange fluxes between the at-         visible part of the spectrum, the following products have been
mosphere and ocean, as such fluxes condition the status of         generated to achieve the goals specified in the previous sec-
the world’s oceans as a sink of CO2 .                              tion, viz. (1) Emiliania huxleyi bloom extent, (2) concentra-
   In addition to the studies cited above, it is also worth men-   tion of coccoliths within the bloom, (3) total content of par-
tioning a few sources of multi-year satellite data on coccol-      ticulate inorganic carbon (PIC) produced by the bloom, and
ithophore blooms that may be useful for potential users who        (4) an increase in CO2 partial pressure in marine surface wa-
wish to broaden their multifaceted databases in their studies.     ters due to the blooming phenomenon.
   The NASA OCEANCOLOR portal https://oceancolor.
gsfc.nasa.gov/atbd/pic/ (last access: 10 January 2019) offers      2.1    Bloom area quantification
extensive data on particulate inorganic carbon retrieved from
MODIS with the Balch et al. (2005) methodology. Down-              Quantification of Emiliania huxleyi bloom areas was per-
loadable from https://oceandata.sci.gsfc.nasa.gov/ (last ac-       formed in two stages. Firstly, RGB (red, green, blue) im-
cess: 10 January 2019), these data have a 4 km and 1 day spa-      ages were generated based on the weighted remote-sensing
tial and temporal resolution and cover the time period starting    reflectance, Rrs , which is the upwelling spectral radiance just
from 2000.                                                         above the water–air interface normalised to the downwelling
   Also, reported by Loveday and Smyth (2018) a 40-                spectral irradiance at the same level (Bukata et al., 1995). Rrs
year time series (1978–2018) from AVHRR observa-                   values in the channels centred at 670, 555 and 443 nm were
tion data on coccolithophore blooms is available at                employed. Analysis of the space-borne radiometric data col-
https://doi.org/10.1594/PANGAEA.892175. By employing               lected by Kondrik et al. (2017a, b) from the five target seas,
specially developed coccolithophore bloom area masks that          yielded statistically robust specific ranges of Rrs (λ) high-
were developed from remote-sensing reflectance spectra,            lighting Emiliania huxleyi blooms as turquoise areas; the ar-
these data are monthly worldwide and available at a spatial        eas of blooms of other (non-calcifying) algae were reflected
resolution of 0.1◦ (∼ 10 km). Although these data do not en-       in the images as green. Areas with scarce non-calcifying al-
compass any additional parameters such as particulate inor-        gae abundance showed up as blue or dark blue. The land
ganic carbon or CO2 partial pressure in surface water within       mask was overlaid so that land areas were coloured light yel-
the bloom, they can be valuable due to an exceptionally long       low.
observation period.

Earth Syst. Sci. Data, 11, 119–128, 2019                                            www.earth-syst-sci-data.net/11/119/2019/
D. Kondrik et al.: Satellite dataset of Emiliania huxleyi blooms in Arctic and sub-Arctic seas (1998–2016)                   121

   In the second stage of quantification of the Emiliania hux-
leyi bloom extent, an additional criterion was imposed on
the revealed turquoise areas: Rrs values should be maxi-
mal at 490 and/or 510 nm, while at other wavelengths they
need to be in excess of 0.001 (412 nm), 0.008 (443 nm), 0.01
(490 nm), 0.008 (510 nm), 0.008 (555 nm) and ∼ 0 (670 nm).
Such a selection provided the highest accuracy of bloom de-
lineation. With the known pixel size, the bloom area can
be confidently quantified. An example of Emiliania huxleyi
bloom extent masking is shown in Fig. 1.

2.2   Determination of the coccolith concentration
Determination of the coccolith concentration within the
bloom was performed with the BOREALI algorithm (Bio-
Optical REtrieval ALgorIthm, Korosov et al., 2009), based
                                                                  Figure 1. Example of the bloom masking algorithm performance.
on the Levenberg–Marquardt (L-M) finite difference tech-
                                                                  (a) Source of the OC CCI RGB imagery for the North Sea (9 June
nique (Press et al., 1992). The L-M technique solves the in-
                                                                  2016, with land mask); (b) calculated bloom mask (white pixels
verse problem, i.e. in our case it allows us to retrieve the      stand for bloom detected, black pixels are areas void of bloom).
concentrations of water constituents from spectral subsurface
remote-sensing reflectance, Rrsw (λ), which is the upwelling
spectral radiance just beneath the water–air interface nor-
                                                                  2.3   Coccolith content, particulate inorganic carbon and
malised to the downwelling spectral irradiance at the same
                                                                        CO2 partial pressure increment determination
level (Jerome et al., 1996). A hydro-optical model accommo-
dating spectral specific absorption and backscattering coeffi-    Determination of the coccolith content (CC) was performed
cients of Emiliania huxleyi cells and coccoliths. As well as      through establishing mixed-layer depth (MLD) within the
pure water, non-calcifying alga and dissolved organic matter      bloom area. The climatology of Montegut et al. (2004) was
was developed and employed to run the BOREALI (Kondrik            applied. The identified areas of Emiliania huxleyi blooms
et al., 2017a).                                                   with retrieved concentrations of coccoliths were overlapped
   The results of validation of coccolith concentration re-       by the respective climatological MLD fields, and for each
trievals with BOREALI were assessed through the follow-           pixel, the value of MLD was further used to calculate CC.
ing statistical measures: coefficient of correlation, r; linear   Further, CC values were used to quantify the total content
regression equation, f (x); coefficient of determination, R 2 ;   of particulate inorganic carbon (PIC). It was done for each
root mean square error, RMSE; and systematic error, BIAS          8-day time period (corresponding to the temporal resolution
and MAE. BIAS and MAE were then also normalised to the            of the space-borne radiometric data employed) through mul-
absolute values of coccoliths concentrations determined by        tiplying the carbon mass per coccolith, m and CC followed
using each model: r = 0.88, f (x) = 0.6159x +6.9197, R 2 =        by summarising the results of multiplication within all pix-
0.77; RMSE = 3.55 × 10⁹ coccoliths m−3 , BIAS = 25.30 %           els of respective bloom extent. The value of m was equal to
and MAE = 32.30 %.                                                0.2 pg (Balch et al., 2005). The moment at which the PIC
   In addition, ascertained by both RGB and Rrs approaches,       assessment could be ideally performed in each bloom corre-
Emiliania huxleyi bloom areas were further checked using          sponded to the situation when two conditions were fulfilled:
the results of coccolith concentration retrievals. This was       (a) the bloom attained its largest surface and (b) the spec-
done through the application of a threshold. A threshold of       tral curvature of remote-sensing reflectance, Rrs (λ), exhib-
90 × 109 coccoliths m−3 was chosen because, firstly, it en-       ited a maximum at about 490 nm as the location of the Rrs
sures the best correspondence between the bloom surfaces,         maximum at about 490 nm is an indication that the bloom is
determined by our radiometric and BOREALI algorithms.             prevalently composed of coccoliths (Kondrik et al., 2017a).
Secondly, this threshold is very close to the average value          Remote determinations of Emiliania huxleyi-driven pCO2
of coccolith concentrations in developed Emiliania huxleyi        increment (1pCO2 ) consisted of establishing a relationship
blooms reported from the world’s oceans (for references, see      between Emiliania huxleyi-driven changes in pCO2 , that is,
Balch et al., 1996b, 2005). The numerical assessments of          1pCO2 , in bloom pixels, and the respective values of Rrs
bloom surfaces delineated and quantified by the above in-         (490). Such a relationship (Kondrik et al., 2018a) with the
dependent methods converged precisely.                            following statistical characteristics, coefficient of determi-
                                                                  nation, r 2 = 0.54, p  0.001, and RMSE = 23.4 µatm, was
                                                                  used to quantify the spatial variations of 1pCO2 in the tar-
                                                                  get seas followed by recalculating 1pCO2 for the water tem-

www.earth-syst-sci-data.net/11/119/2019/                                            Earth Syst. Sci. Data, 11, 119–128, 2019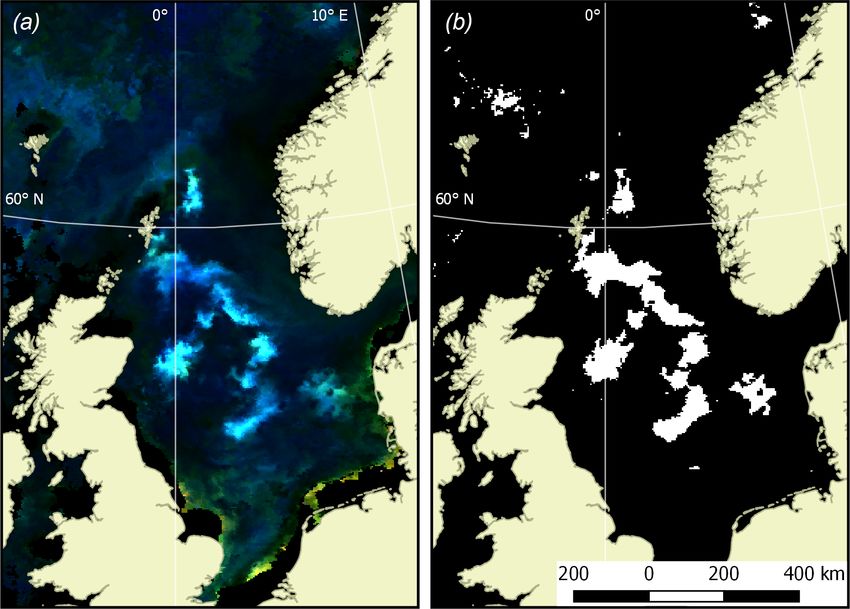
122              D. Kondrik et al.: Satellite dataset of Emiliania huxleyi blooms in Arctic and sub-Arctic seas (1998–2016)

peratures (retrieved from space-borne data) that actually oc-
curred during the respective Emiliania huxleyi bloom events
(Copin-Montegut, 1988).

2.4   Additional technical workflow
During satellite data processing, several procedures were per-
formed.

 1. Satellite images were reprojected. Given the high latitu-
    dinal location of the target seas, it was relevant to use an
    equal-area polar projection. Therefore, the NASA Ease-
    Grid was employed. The system of coordinates of the
    WGS-84 (World Geodetic System 1984) is based on
    Ease-Grid.

 2. Automatic cloud masking was corrected in the images
    from SeaWiFS in 1998–2001. In all images of the OC
    CCI product obtained in 1998–2001 (when only the
    SeaWiFS sensor was operational), putative bloom ar-
    eas proved to be masked. The errors of automatic cloud
    masking most probably resulted from very high values
    of brightness stemming from bloom areas (comparable
    with cloud-produced signals), which may have led to
    possible mistakes in the masking algorithm. The prob-
    lem was overcome via manual processing of the data
    of a lower level, i.e. directly from the SeaWiFS level 2
    product (http://oceancolor.gsfc.nasa.gov/cgi/browse.pl?
    sen=am, last access: 10 January 2019) for the period of
    1998–2001 in all studied areas. As a result, in the RGB
    images the areas masked as clouds in OC CCI images
    proved to exhibit large bloom areas with the brightness        Figure 2. Example of dataset products (the North Sea, 9 June
    of signals typical of Emiliania huxleyi. This approach         2016). (a) Source OC CCI RGB imagery with the bloom mask con-
    was legitimate as OC CCI data obtained by different            toured in red, (b) coccolith concentration (109 m−3 ), (c) content of
    sensors have been brought to the SeaWiFS standard              particulate inorganic carbon (tonnes) and (d) an increase in CO2
    channels, and the entire data time series (1998–2016)          partial pressure in water (µatm).
    was radiometrically uniform.

 3. Missing pixels masked as ragged clouds were filled. In         Examples of product visualisation (for the North Sea) are
    the case of ragged clouds, some pixels of RGB images           shown in Fig. 2.
    are not informative. A special algorithm for filling such
    gaps included averaging of Rrs (λ) values from neigh-
                                                                   3   Data sources
    bouring pixels and from temporarily previous and fol-
    lowing images of the same pixel. The use of this algo-         Data on Rrs in six channels (centred at 412, 443, 490, 510 and
    rithm in each of the cloud-masked images of the areas          670 nm) are from the OC CCI product (Ocean Colour Cli-
    studied over 19 years and included in the OC CCI prod-         mate Change Initiative dataset, version 3.0, European Space
    uct helped to increase the analysed area, sometimes to         Agency, available online at http://www.esa-oceancolour-cci.
    a significant extent. Calculated from 1998 to 2016 as          org/, last access: 10 January 2019).
    arithmetic means for the Barents, Bering, North, Nor-             For the bio-optical retrieval algorithm validation, we em-
    wegian and Greenland seas, the quantitative estimates          ployed the PANGAEA database (https://www.pangaea.de/,
    of such an increase attained for each 8-day-averaged           last access: 10 January 2019) of the concentration of coccol-
    image reached, respectively, ∼ 107, 370, 31, 15 and            iths within the target coccolithophore blooms in the North
    13 times. Thus, images were obtained with significantly        Atlantic, including the North and Norwegian seas (Char-
    larger cloud-free areas, ensuring a more accurate esti-        alampopoulou et al., 2008, 2011).
    mation of the borders of bloom areas, and their displace-
    ment, as well as of bloom areas per se.

Earth Syst. Sci. Data, 11, 119–128, 2019                                              www.earth-syst-sci-data.net/11/119/2019/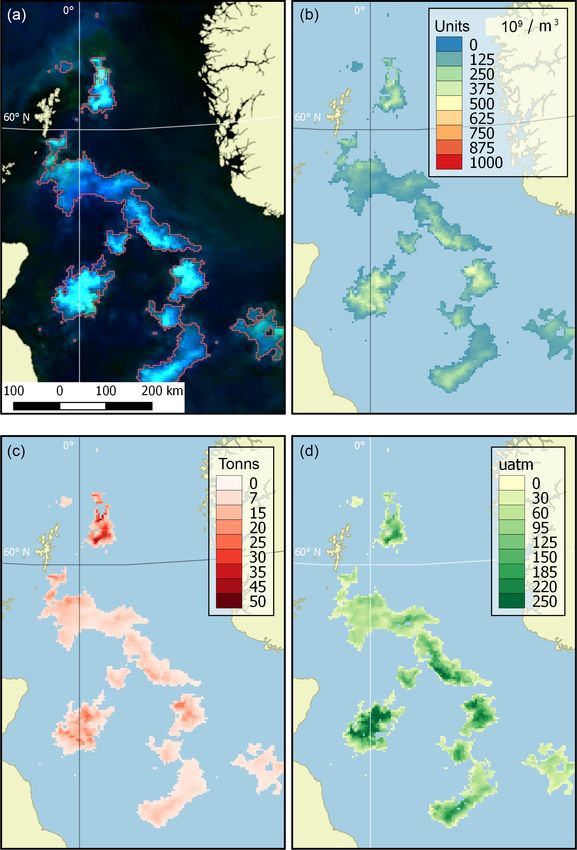
D. Kondrik et al.: Satellite dataset of Emiliania huxleyi blooms in Arctic and sub-Arctic seas (1998–2016) 123
The bio-optical in situ database, spanning between 1997
and 2012 (16 years) was employed for ocean-colour
satellite applications because it has global coverage (Va-
lente et al., 2016). The data were acquired from sev-
eral sources: MOBY (Marine Optical BuoY), BOUSSOLE
(BOUée pour l’acquiSition d’une Série Optique à Long
termE), AERONET-OC (AErosol RObotic NETwork-Ocean
Color), SeaBASS (SeaWiFS Bio-Optical Archive and Stor-
age System), NOMAD (NASA bio-Optical Marine Al-
gorithm Dataset), MERMAID (MERIS Match-up In situ
Database), AMT (Atlantic Meridional Transect), ICES (In-
ternational Council for the Exploration of the Sea), HOT
(Hawaii Ocean Time-series), and GeP&CO (Geochemistry,
Phytoplankton, and Color of the Ocean). This database com-
prises a large number of variables, including the spectral
remote-sensing reflectance, Rrs and chlorophyll a concentra-
tion.
Data on MLD were derived from the Montegut clima-
tology (Montegut et al., 2004). Data on bathymetry inher-
ent in the target seas were taken from the website http://
www.ngdc.noaa.gov/mgg/bathymetry/arctic/arctic.html (last
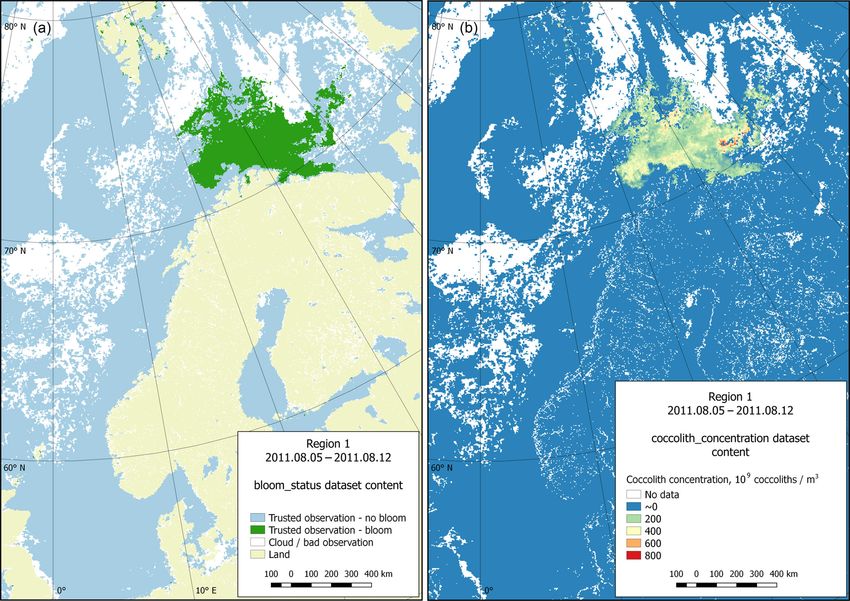
access: 10 January 2019; Jakobsson et al., 2012). Figure 3. Dataset of target spatial regions. Regions are shown as
The GLobal Ocean Data Analysis Project (GLODAP) coloured boxes, and the colour bar indicates the number of bloom
database (Key et al., 2015; Olsen et al., 2016), http://cdiac. observations in each pixel over the time period 1998–2016.
ornl.gov/oceans/GLODAPv2/ (last access: 10 January 2019)
was employed for pairing in situ NO3 values at those points
for which in situ pCO2 values were available. In the cases 4 Data spatio-temporal domain
when the desired NO3 matching values were unavailable in
the GLODAP database, the respective data were employed The published dataset covers a time period of 19 years, from
from the World Ocean Atlas 2013 (WOA13, NOAA, Garcia 1998 to 2016, with a time resolution of 8 days (a total of
et al., 2013; https://www.nodc.noaa.gov/OC5/woa13/, last 874 time periods), and a spatial domain with the total area
access: 10 January 2019). of 11 056 800 km2 at a resolution of 4 × 4 km, divided into
The SOCAT v4 database (The Surface Ocean CO2 At- four regions described in Table 1 and shown in Fig. 3.
las; Bakker et al., 2016; http://www.socat.info/access.html, All data are represented in the Lambert azimuthal equal
last access: 10 January 2019) comprises more than 6 million area projection with the parameters corresponding to the
pCO2 measurements performed at latitudes north of 40◦ N. widespread NSIDC EASE-Grid North (EPSG: 3973) coor-
The data employed by us from SOCAT V4 database met dinate system.
the following requirements: (1) measurements are conducted The selection of four regions in this work was made for
during 1998–2016 and within a 10 m top layer (if there were several reasons. They include all seas where coccolithophore
data from several depths, the measurements from the shal- blooms usually occur in subpolar and polar regions of the
lowest depth were used); (2) pCO2 data should necessarily Northern Hemisphere (North, Norwegian, Greenland, Bar-
have both corresponding seawater salinity data and valid Rrs ents, Bering and Labrador seas). The exclusion from our
spectra; (3) a daily mean pCO2 value was employed pro- dataset of blooms occurring in the northern parts of the
vided there were several in situ measurements; (4) pCO2 Atlantic Ocean (see, e.g. Holligan et al., 1993) was dic-
measurements are conducted at a distance not less than 8 km tated by some technical restrictions: the hydro-optical model
offshore (to avoid the impact of adjacency effect on Rrs satel- employed for obtaining coccolith concentration values was
lite data); (5) pCO2 measurements were within the location based prevalently on the data from high-latitude areas and
and timing of Emiliania huxleyi blooming; and (6) data used thus should first be validated for geographically different ma-
from the SOCAT v4 database overlap the data from either rine environments such as open parts of the Atlantic Ocean.
the GLODAP database or the WOA13 climatology database
(depending on which one was used for comparison). 5 Dataset overview
The 19-year period data covers four blooming regions differ-
ing in nature. This allows us to evaluate the bloom-related
processes on different scales and time intervals in order to
www.earth-syst-sci-data.net/11/119/2019/ Earth Syst. Sci. Data, 11, 119–128, 2019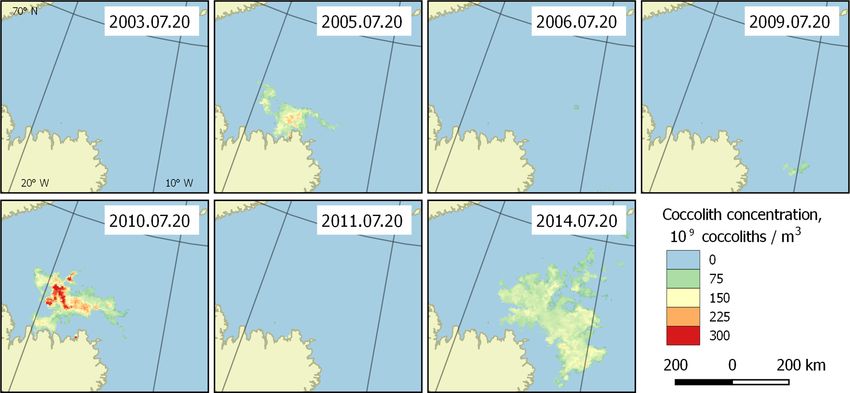
124                D. Kondrik et al.: Satellite dataset of Emiliania huxleyi blooms in Arctic and sub-Arctic seas (1998–2016)

Table 1. Description of spatial regions.

                     Region       Extent coordinates       Region area,    Contained waters
                     number      (NSIDC EASE-Grid                 km2
                                  North, EPSG:3973)
                     1          Xmin        −300 000.00      7 819 600     The Barents, Norwegian and North seas, the
                                Ymin       −4 260 000.00                   northern part of the Greenland Sea
                                Xmax        1960 000.00
                                Ymax        −800 000.00
                     2          Xmin       −1 000 000.00       476 000     Southern part of the Greenland sea, western
                                Ymin       −2 720 000.00                   part of the Norwegian Sea
                                Xmax        −300 000.00
                                Ymax       −2 040 000.00
                     3          Xmin       −4 180 000.00     1 081 200     Southern part of the Labrador Sea, the North
                                Ymin       −3 500 000.00                   Atlantic Ocean part to the south of the
                                Xmax       −3 160 000.00                   Labrador Sea
                                Ymax       −2 440 000.00
                     4          Xmin       −1 400 000.00     1 680 000     The Bering Sea
                                Ymin        2 500 000.00
                                Xmax                0.00
                                Ymax        3 700 000.00

Figure 4. Total number of identified pixels with Emiliania huxleyi for each blooming season in the period 1998–2016 within the four regions
specified in Fig. 3.

reveal both interannual dynamics and seasonal variations of               ing area). For example, in the Bering Sea (region 4), the most
parameters relevant to the bloom phenomenon. Emiliania                    extensive blooms were observed exclusively from 1998 to
huxleyi blooms in the Arctic and sub-Arctic seas are char-                2001, but later on, their intensity decreased drastically. In re-
acterised by significant instability: the difference in intensity         gion 1, mainly in the Barents, Norwegian and North seas,
of blooming in different years can be 10-fold. Figure 4 and               the blooming activity over the years we are reporting on was
Table 2 collectively illustrate for the above four marine re-             very irregular, with a peak in 2016.
gions the temporal dynamics in bloom intensity (i.e. bloom-

Earth Syst. Sci. Data, 11, 119–128, 2019                                                    www.earth-syst-sci-data.net/11/119/2019/
D. Kondrik et al.: Satellite dataset of Emiliania huxleyi blooms in Arctic and sub-Arctic seas (1998–2016) 125
Table 2. Total number of identified pixels with E. huxleyi for each blooming season in the period 1998–2016 within the four regions.
Year Total number of pixels with E. huxleyi Year Total number of pixels with E. huxleyi
Region 1 Region 2 Region 3 Region 4 Region 1 Region 2 Region 3 Region 4
1998 99 538 214 2336 252 003 2008 48 399 8319 13 131 1656
1999 97 259 5754 9168 116 622 2009 51 620 2745 18 102 14 749
2000 73 642 138 14 205 282 046 2010 77 050 8110 46 591 1232
2001 104 425 1142 10 432 109 541 2011 116 555 603 48 101 22 259
2002 104 237 949 37 335 694 2012 107 791 4532 18 630 618
2003 117 877 312 40 018 7466 2013 115 764 10 011 12 302 2079
2004 109 156 2275 10 686 6657 2014 76 396 15 047 16 245 50 900
2005 76 768 3300 23 651 8679 2016 129 569 1265 14 890 6705
2006 97 004 2444 3729 4061 2017 183 546 1536 1779 16 184
2007 80 835 955 4237 17 505
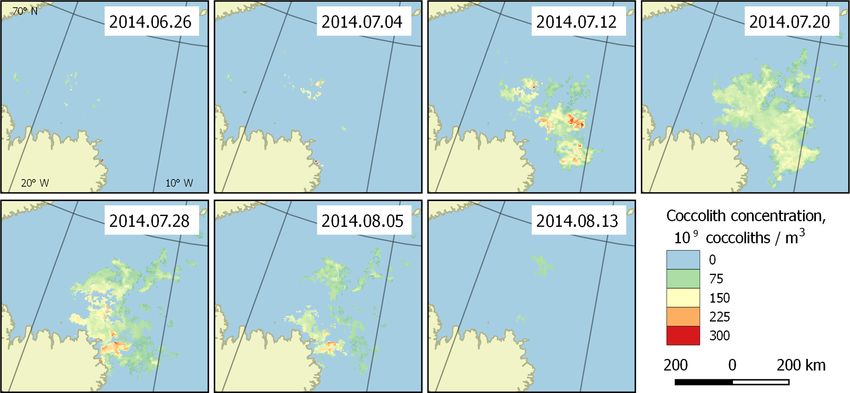
Figure 5. Bloom development in the Greenland Sea (region 2) in June–August 2014. The peak falls on 20 July.
Figure 6. Bloom intensity in the Greenland Sea (region 2) on 20 July in different years. Its instability is obvious.
With the collected data, it is possible to highlight the pat- based on the published dataset. Figure 5 shows an example
terns of development of the regularly occurring blooms. They of bloom development in the Greenland Sea (region 2) in the
can be characterised with the beginnings and ends of bloom- period 26 June–13 August 2014. However, these periods are
ing periods, and the overall dynamics of coccolith concen- generally unstable, which is clearly seen in Fig. 6, which dis-
tration during the blooms. Such patterns can be established
www.earth-syst-sci-data.net/11/119/2019/ Earth Syst. Sci. Data, 11, 119–128, 2019126 D. Kondrik et al.: Satellite dataset of Emiliania huxleyi blooms in Arctic and sub-Arctic seas (1998–2016)
Figure 7. Dataset content example (region 1, 5 August 2011). (a) Bloom status sub-dataset visualisation; (b) coccolith concentration sub-
dataset visualisation.
plays the blooming area configuration in 20 July for different 7 Conclusions
years for the same area.
Technically, each dataset contains four sub-datasets: We have composed a detailed 19-year dataset of Emilia-
bloom status, coccolith concentration, particulate organic nia huxleyi blooms in the Arctic and sub-Arctic seas, in-
carbon content and CO2 partial pressure in water driven by cluding information about their influence on the carbon cy-
coccolithophores. The last three categories contain the di- cle in the ocean. These data are based mostly on satellite
rectly calculated parameter values. The first sub-dataset con- remote-sensing observations, but also on available shipborne
tains information on the quality and content of the data. This measurements and results of processing with authorial algo-
information is organised as a set of flags attributed to data on rithms. We hope that the publication of these data, on the one
reliable observations of the presence or absence of blooming, hand, will promote further studies aimed at elucidating Emil-
or inaccurate data (usually due to clouds), as well as data on iania huxleyi bloom driving mechanisms and their forcing
the coast. Figure 7 provides both an example of a status ma- factors and, on the other hand, will facilitate an understand-
trix and the matrix containing coccolith concentration values. ing of the patterns of this phenomenon distribution and its
impact on the ocean and the atmosphere.
6 Data availability
The dataset is available on Zenodo (Kondrik et al., 2018b; Author contributions. DP is responsible for the theoretical back-
ground and methodology development. DK also contributed to the-
https://doi.org/10.5281/zenodo.1402033). Data granules are
oretical background research and is responsible for the development
divided into directories by region and year, and each child and programming of data processing algorithms. EK conceived the
directory contains files with 8-day data on the bloom status, dataset structure and contributed to programming of data process-
coccolith concentration, PIC and 1pCO2 . Data are stored in ing algorithms, data analysis and visualisations. All authors equally
NetCDF4 format with GDAL-support, which allows imme- contributed to the writing of the manuscript and data quality control.
diate use of the data with any NetCDF-based or GIS soft-
ware. Tips on how to read the data and on QGIS styles for
fast visualisation are also provided.
Earth Syst. Sci. Data, 11, 119–128, 2019 www.earth-syst-sci-data.net/11/119/2019/D. Kondrik et al.: Satellite dataset of Emiliania huxleyi blooms in Arctic and sub-Arctic seas (1998–2016) 127
Competing interests. The authors declare that they have no con- ing the Great Calcite Belt in the Southern Ocean and its biogeo-
flict of interest. chemical significance, Global Biogeochem. Cy., 30, 1124–1144,
https://doi.org/10.1002/2016GB005414, 2016.
Bukata, R. P., Jerome, J. H., Kondratyev, K. Ya., and Pozdnyakov,
Acknowledgements. The Surface Ocean CO2 Atlas (SOCAT) is D. V.: Optical Properties and Remote Sensing of Inland and
an international effort, endorsed by the International Ocean Car- Coastal Waters, CRC Press, Boca Raton, FL, USA, 362 pp.,
bon Coordination Project (IOCCP), the Surface Ocean Lower At- 1995.
mosphere Study (SOLAS) and the Integrated Marine Biosphere Charalampopoulou, A., Poulton, A. J., Tyrrell, T., and Lu-
Research (IMBeR) programme, to deliver a uniformly quality- cas, M.: Surface Seawater Carbonate Chemistry, Nu-
controlled surface ocean CO2 database. The many researchers and trients and Phytoplankton Community Composition on
funding agencies responsible for the collection of data and quality a Transect between North Sea and Arctic Ocean, 2008,
control are thanked for their contributions to SOCAT. https://doi.org/10.1594/PANGAEA.763990, 2008.
We express our particular gratitude for the financial support Charalampopoulou, A., Poulton, A. J., Tyrrell, T., and Lu-
of this study provided by the Russian Science Foundation (RSF) cas, M: Irradiance and pH Affect Coccolithophore Com-
under the project 17-17-01117. munity Composition on a Transect between the North Sea
and the Arctic Ocean, Mar. Ecol. Prog. Ser., 431, 25–43,
Edited by: David Carlson https://doi.org/10.3354/meps09140, 2011.
Reviewed by: Alex Poulton and Griet Neukermans Copin-Montegut, C.: A new formula for the effect of temperature on
the partial pressure of CO2 in seawater, Mar. Chem., 25, 29–37,
https://doi.org/10.1016/0304-4203(88)90012-6, 1988.
Garcia, H. E., Locarnini, R. A., Boyer, T. P., Antonov, J. I., Bara-
References nova, O. K., Zweng, M. M., Reagan, J. R., Johnson, D. R., Mis-
honov, A. V., and Levitus, S.: World ocean atlas 2013, vol. 4, Dis-
Bakker, D. C. E., Pfeil, B., O’Brien, K. M., Currie, K. I., Jones, solved inorganic nutrients (phosphate, nitrate, silicate), Ocean
S. D., Landa, C. S., Lauvset, S. K., Metzl, N., Munro, D. Climate Laboratory, National Oceanographic Data Center, Silver
R., Nakaoka, S.-I., Olsen, A., Pierrot, D., Saito, S., Smith, K., Spring, Maryland, USA, https://doi.org/10.7289/V5J67DWD,
Sweeney, C., Takahashi, T., Wada, C., Wanninkhof, R., Alin, 2013.
S. R., Becker, M., Bellerby, R. G. J., Borges, A. V., Boutin, Gordon, H. R., Boynton, G. C., Balch, W. M., Groom, S. B., Har-
J., Bozec, Y., Burger, E., Cai, W.-J., Castle, R. D., Cosca, bour, D. S., and Smyth, T. J.: Retrieval of Coccolithophore Cal-
C. E., DeGrandpre, M. D., Donnelly, M., Eischeid, G., Feely, cite Concentration from SeaWiFS Imagery, Geophys. Res. Lett.,
R. A., Gkritzalis, T., Gonzalez-Davila, M., Goyet, C., Guil- 28, 1587–1590, 2001.
lot, A., Hardman-Mountford, N. J., Hauck, J., Hoppema, M., Holligan, P. M., Fernández, E., Aiken, J., Balch, W. M., Boyd, P.,
Humphreys, M. P., Hunt, C. W., Ibanhez, J. S. P., Ichikawa, T., Burkill, P. H., Finch, M., Groom, S. B., Malin, G., Muller, K.,
Ishii, M., Juranek, L. W., Kitidis, V., Kortzinger, A., Koffi, U. K., Purdie, D. A., Robinson, C., Trees, C. C., Turner, S. M., and
Kozyr, A., Kuwata, A., Lefevre, N., Lo Monaco, C., Manke, A., van der Wal, P.: A biogeochemical study of the coccolithophore,
Marrec, P., Mathis, J. T., Millero, F. J., Monacci, N., Monteiro, P. Emiliania huxleyi, in the North Atlantic, Global Biogeochem.
M. S., Murata, A., Newberger, T., Nojiri, Y., Nonaka, I., Omar, A. Cy., 7, 879–900, https://doi.org/10.1029/93GB01731, 1993.
M., Ono, T., Padin, X. A., Rehder, G., Rutgersson, A., Sabine, C. Jakobsson, M., Mayer, L. A., Coakley, B., Dowdeswell, J. A.,
L., Salisbury, J., Santana-Casiano, J. M., Sasano, D., Schuster, Forbes, S., Fridman, B., Hodnesdal, H., Noormets, R., Peder-
U., Sieger, R., Skjelvan, I., Steinhoff, T., Sullivan, K., Suther- sen, R., Rebesco, M., Schenke, H. W., Zarayskaya, Y., Accettella,
land, S. C., Sutton, A., Tadokoro, K., Telszewski, M., Thomas, D., Armstrong, A., Anderson, R. M., Bienhoff, P., Camerlenghi,
H., Tilbrook, B., van Heuven, S., Vandemark, D., Wallace, D. A., Church, I., Edwards, M., Gardner, J. V, Hall, J. K., Hell, B.,
W. R., and Woosley, R.: Surface Ocean CO2 Atlas (SOCAT) V4, Hestvik, O., Kristoffersen, Y., Marcussen, C., Mohammad, R.,
https://doi.org/10.1594/PANGAEA.866856, 2016. Mosher, D., Nghiem, S. V, Pedrosa, M. T., Travaglini, P. G., and
Balch, W. M., Kilpatrick, K. A., and Trees, C. C.: The 1991 coccol- Weatherall, P.: The International Bathymetric Chart of the Arctic
ithophore bloom in the central North Atlantic. 1. Optical prop- Ocean (IBCAO) Version 3.0., Geophys. Res. Lett., 39, L12609,
erties and factors affecting their distribution, Limnol. Oceanogr., https://doi.org/10.1029/2012GL052219, 2012.
41, 1669–1683, 1996a. Jerome, J. H., Bukata, R. P., and Miller, J. R.: Remote sensing re-
Balch, W. M., Kilpatrick, K. A., Holligan, P. M., Harbour, D., and flectance and its relationship to optical properties of natural wa-
Fernandez, E.: The 1991 coccolithophore bloom in the central ter, Int. J. Remote Sens., 17, 43–52, 1996.
North Atlantic. 2. Relating optics to coccolith concentration, Johannessen, O. M.: Decreasing Arctic ice mirrors increasing CO2
Limnol. Oceanogr., 41, 1684–1696, 1996b. on decadal time scale, Atmospheric and Oceanic Science Letters,
Balch, W. M., Gordon, H., Bowler, B. C., Drapeau, D. T., 1, 51–56, 2008.
and Booth, E. S: Calcium Carbonate Measurements in the Key, R. M., Olsen, A., van Heuven, S., Lauvset, S. K., Velo, A.,
Surface Global Ocean Based on Moderate-Resolution Imag- Lin, X., Schirnick, C., Kozyr, A., Tanhua, T., Hoppema, M.,
ing Spectrometer Data, J. Geophys. Res., 110, C07001, Jutterström, S., Steinfeldt, R., Jeansson, E., Ishi, M., Perez,
https://doi.org/10.1029/2004JC002560, 2005. F. F., and Suzuki, T.: Global Ocean Data Analysis Project,
Balch, W. M., Bates, N. R., Lam, P. J., Twining, B. S., Rosen- version 2 (GLODAPv2), ORNL/CDIAC-162, ND-P093. Carbon
gard, S. Z., Bowler, B. C., Drapeau, D. T., Garley, R., Lubel- Dioxide Information Analysis Center, Oak Ridge National
czyk, L. C., Mitchell, C., and Rauschenberg, S.: Factors regulat-
www.earth-syst-sci-data.net/11/119/2019/ Earth Syst. Sci. Data, 11, 119–128, 2019128 D. Kondrik et al.: Satellite dataset of Emiliania huxleyi blooms in Arctic and sub-Arctic seas (1998–2016) Laboratory, US Department of Energy, Oak Ridge, TN, USA, Press, W., Teukolsky, S., Vettering, W., and Flannery, B.: Numeri- https://doi.org/10.3334/CDIAC/OTG.NDP093_GLODAPv2, cal recipes in C: The art of scientific computing, 2nd edn., Cam- 2015. bridge University Press, New York, USA, 1992. Kondrik, D. V., Pozdnyakov, D. V., and Pettersson, L. H.: Rost, B., Zondervan, I., and Wolf-Gladrow, D.: Sensitivity of phyto- Particulate inorganic carbon production within E. huxleyi plankton to future changes in ocean carbonate chemistry: current blooms in subpolar and polar seas: a satellite time series knowledge, contradictions and research directions, Mar. Ecol. study (1998–2013), Int. J. Remote Sens., 38, 6179–6205, Prog. Ser., 373, 227–237, 2008. https://doi.org/10.1080/01431161.2017.1350304, 2017a. Shutler, J., Grant, M., Miller, P., Rushton, E., and Ander- Kondrik, D., Pozdnyakov, D., and Pettersson, L.: Tendencies in son, K.: Coccolithophore bloom detection in the north At- Coccolithophorid Blooms in Some Marine Environments of the lantic using SeaWiFS: Algorithm description, application and Northern Hemisphere According to the Data of Satellite Obser- sensitivity analysis, Remote Sens. Environ., 114, 1008–1016, vations in 1998–2013, Izv. Atmos. Ocean. Phys.+, 53, 955–964, https://doi.org/10.1016/j.rse.2009.12.024, 2010. 2017b. Shutler, J. D., Land, P. E., Brown, C. W., Findlay, H. S., Don- Kondrik, D. V., Pozdnyakov, D. V., and Johannessen, O. M.: lon, C. J., Medland, M., Snooke, R., and Blackford, J. C.: Satellite evidence that E. huxleyi phytoplankton blooms weaken Coccolithophore surface distributions in the North Atlantic and marine carbon sinks, Geophys. Res. Lett., 45, 846–854, their modulation of the air-sea flux of CO2 from 10 years of https://doi.org/10.1002/2017GL076240, 2018a. satellite Earth observation data, Biogeosciences, 10, 2699–2709, Kondrik, D., Kazakov, E., and Pozdnyakov, D.: Dataset of E. https://doi.org/10.5194/bg-10-2699-2013, 2013. huxleyi blooms: spatio-temporal distribution and their impact on Valente, A., Sathyendranath, S., Brotas, V., Groom, S., Grant, M., high-latitudinal marine environments (1998–2016) (Version 1) Taberner, M., Antoine, D., Arnone, R., Balch, W. M., Barker, K., [Dataset], Zenodo, https://doi.org/10.5281/zenodo.1402033, Barlow, R., Bélanger, S., Berthon, J.-F., Besiktepe, S., Brando, 2018b. V., Canuti, E., Chavez, F., Claustre, H., Crout, R., Frouin, R., Korosov, A. A., Pozdnyakov, D. V., Folkestad, A., Pettersson, García-Soto, C., Gibb, S. W., Gould, R., Hooker, S., Kahru, L. H., Sorensen, K., and Shuchman, R.: Semi-empirical algo- M., Klein, H., Kratzer, S., Loisel, H., McKee, D., Mitchell, B. rithm for the retrieval of ecology-relevant water constituents G., Moisan, T., Muller-Karger, F., O’Dowd, L., Ondrusek, M., in various aquatic environments, Algorithms, 2, 470–497, Poulton, A. J., Repecaud, M., Smyth, T., Sosik, H. M., Twar- https://doi.org/10.3390/a2010470, 2009. dowski, M., Voss, K., Werdell, J., Wernand, M., and Zibordi, Loveday, B. R. and Smyth, T.: A 40-year global data set of visible- G.: A compilation of global bio-optical in situ data for ocean- channel remote-sensing reflectances and coccolithophore bloom colour satellite applications, Earth Syst. Sci. Data, 8, 235–252, occurrence derived from the Advanced Very High Resolution https://doi.org/10.5194/essd-8-235-2016, 2016. Radiometer catalogue, Earth Syst. Sci. Data, 10, 2043–2054, Winter, A., Hendericks, J., Beaufort, L., Rickaby, R. E. M., https://doi.org/10.5194/essd-10-2043-2018, 2018. and Brown, C. W.: Poleward expansion of the coccol- Montegut, C., Madec, G., Fisher, A., Lazar, A., and Iudicone, D.: ithophore Emiliania huxleyi, J. Plankton Res., 36, 316–325, Mixed layer depth over the global ocean: an examination of pro- https://doi.org/10.1093/plankt/fbt110, 2014. file data and a profile-based climatology, J. Geophys. Res., 109, C12003, https://doi.org/10.1029/2004JC002378, 2004. Olsen, A., Key, R. M., van Heuven, S., Lauvset, S. K., Velo, A., Lin, X., Schirnick, C., Kozyr, A., Tanhua, T., Hoppema, M., Jutterström, S., Steinfeldt, R., Jeansson, E., Ishii, M., Pérez, F. F., and Suzuki, T.: The Global Ocean Data Analysis Project version 2 (GLODAPv2) – an internally consistent data prod- uct for the world ocean, Earth Syst. Sci. Data, 8, 297–323, https://doi.org/10.5194/essd-8-297-2016, 2016. Earth Syst. Sci. Data, 11, 119–128, 2019 www.earth-syst-sci-data.net/11/119/2019/
You can also read