Strategies for cellular deconvolution in human brain RNA sequencing data version 1; peer review: awaiting peer review
←
→
Page content transcription
If your browser does not render page correctly, please read the page content below
F1000Research 2021, 10:750 Last updated: 03 SEP 2021

METHOD ARTICLE

Strategies for cellular deconvolution in human brain RNA
sequencing data [version 1; peer review: awaiting peer
review]
Olukayode A. Sosina 1, Matthew N. Tran2,3, Kristen R. Maynard2, Ran Tao2,
Margaret A. Taub1, Keri Martinowich2,4,5, Stephen A. Semick 2, Bryan C. Quach6,
Daniel R. Weinberger2-4,7, Thomas Hyde2,4,7, Dana B. Hancock6, Joel E. Kleinman2,4,
Jeffrey T. Leek1, Andrew E. Jaffe 1-5,8
1Department of Biostatistics, Bloomberg School of Public Health, Johns Hopkins University, Baltimore, USA
2Lieber Institute for Brain Development, Baltimore, USA
3Department of Genetic Medicine, Johns Hopkins Medicine, Baltimore, USA
4Department of Psychiatry and Behavioral Sciences, Johns Hopkins Medicine, Baltimore, USA
5Department of Neuroscience, School of Medicine, Johns Hopkins Medicine, Baltimore, USA
6Center for Omics Discovery and Epidemiology, RTI International, Durham, USA
7Department of Neurology, Johns Hopkins Medicine, Baltimore, USA
8Department of Mental Health, Bloomberg School of Public Health, Johns Hopkins University, Baltimore, USA

v1   First published: 04 Aug 2021, 10:750                                        Open Peer Review
     https://doi.org/10.12688/f1000research.50858.1
     Latest published: 04 Aug 2021, 10:750
     https://doi.org/10.12688/f1000research.50858.1                              Reviewer Status AWAITING PEER REVIEW

                                                                                 Any reports and responses or comments on the

Abstract                                                                         article can be found at the end of the article.
Background: Statistical deconvolution strategies have emerged over
the past decade to estimate the proportion of various cell populations
in homogenate tissue sources like brain using gene expression data.
However, no study has been undertaken to assess the extent to which
expression-based and DNAm-based cell type composition estimates
agree.
Results: Using estimated neuronal fractions from DNAm data, from
the same brain region (i.e., matched) as our bulk RNA-Seq dataset, as
proxies for the true unobserved cell-type fractions (i.e., as the gold
standard), we assessed the accuracy (RMSE) and concordance (R2) of
four reference-based deconvolution algorithms: Houseman,
CIBERSORT, non-negative least squares (NNLS)/MIND, and MuSiC. We
did this for two cell-type populations - neurons and non-neurons/glia -
using matched single nuclei RNA-Seq and mismatched single cell RNA-
Seq reference datasets. With the mismatched single cell RNA-Seq
reference dataset, Houseman, MuSiC, and NNLS produced concordant
(high correlation; Houseman R2 = 0.51, 95% CI [0.39, 0.65]; MuSiC R2 =
0.56, 95% CI [0.43, 0.69]; NNLS R2 = 0.54, 95% CI [0.32, 0.68]) but
biased (high RMSE, >0.35) neuronal fraction estimates. CIBERSORT
produced more discordant (moderate correlation; R2 = 0.25, 95% CI
[0.15, 0.38]) neuronal fraction estimates, but with less bias (low RSME,

                                                                                                                           Page 1 of 15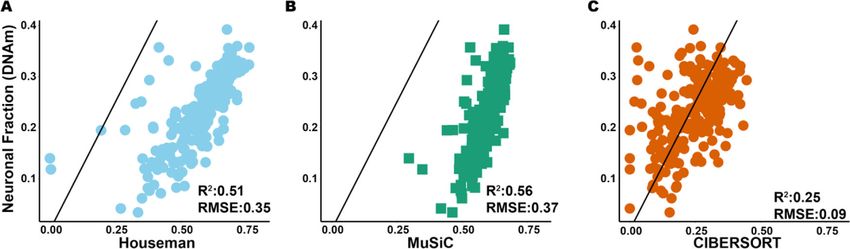
F1000Research 2021, 10:750 Last updated: 03 SEP 2021

0.09). Using the matched single nuclei RNA-Seq reference dataset did
not eliminate bias (MuSiC RMSE = 0.17).
Conclusions: Our results together suggest that many existing RNA
deconvolution algorithms estimate the RNA composition of
homogenate tissue, e.g. the amount of RNA attributable to each cell
type, and not the cellular composition, which relates to the underlying
fraction of cells.

Keywords
Statistical deconvolution, DNA methylation, RNA-seq, single nucleus
RNA-seq

                This article is included in the INCF gateway.

 Corresponding author: Andrew E. Jaffe (andrew.jaffe@libd.org)
 Author roles: Sosina OA: Data Curation, Formal Analysis, Investigation, Methodology, Software, Visualization, Writing – Original Draft
 Preparation, Writing – Review & Editing; Tran MN: Data Curation, Formal Analysis, Methodology, Resources, Writing – Original Draft
 Preparation, Writing – Review & Editing; Maynard KR: Data Curation, Formal Analysis, Investigation, Methodology, Resources,
 Validation, Writing – Review & Editing; Tao R: Data Curation, Investigation, Resources; Taub MA: Formal Analysis, Investigation,
 Methodology; Martinowich K: Investigation, Resources, Writing – Review & Editing; Semick SA: Formal Analysis, Investigation,
 Resources, Writing – Review & Editing; Quach BC: Formal Analysis, Investigation, Resources, Writing – Review & Editing; Weinberger DR:
 Resources, Writing – Review & Editing; Hyde T: Resources; Hancock DB: Funding Acquisition, Project Administration, Resources,
 Supervision, Writing – Review & Editing; Kleinman JE: Resources; Leek JT: Conceptualization, Formal Analysis, Investigation,
 Methodology, Supervision, Writing – Original Draft Preparation, Writing – Review & Editing; Jaffe AE: Conceptualization, Formal Analysis,
 Funding Acquisition, Investigation, Methodology, Project Administration, Supervision, Writing – Original Draft Preparation, Writing –
 Review & Editing
 Competing interests: No competing interests were disclosed.
 Grant information: K.M., R.T., S.A.S., D.B.H., and A.E.J. were partially supported by the National Institute on Drug Abuse (R01DA042090);
 K.R.M., K.M. and A.E.J. were partially supported by the National Institute of Mental Health (R01MH123183).
 The funders had no role in study design, data collection and analysis, decision to publish, or preparation of the manuscript.
 Copyright: © 2021 Sosina OA et al. This is an open access article distributed under the terms of the Creative Commons Attribution
 License, which permits unrestricted use, distribution, and reproduction in any medium, provided the original work is properly cited.
 How to cite this article: Sosina OA, Tran MN, Maynard KR et al. Strategies for cellular deconvolution in human brain RNA
 sequencing data [version 1; peer review: awaiting peer review] F1000Research 2021, 10:750
 https://doi.org/10.12688/f1000research.50858.1
 First published: 04 Aug 2021, 10:750 https://doi.org/10.12688/f1000research.50858.1

                                                                                                                                 Page 2 of 15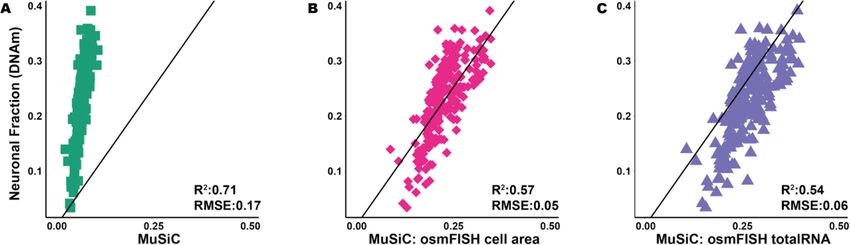
F1000Research 2021, 10:750 Last updated: 03 SEP 2021

Introduction
Homogenate tissues like brain and blood contain a mixture of cell types which can each have unique genomic profiles,
and these mixtures of cell types, termed “cellular composition”, can vary across samples (Jaffe and Irizarry 2014). The
importance of considering cellular composition within heterogeneous tissue sources has been highlighted in epigenetics
research over the past several years (Houseman et al. 2012; Montaño et al. 2013; Jaffe and Irizarry 2014), as, generally,
failure to account for cellular composition when analyzing heterogeneous tissue sources can increase both false positives
and negatives (Michels et al. 2013). Previous work has identified widespread epigenetic differences between neurons
and glia using DNA methylation (DNAm) data (Montaño et al. 2013; Guintivano et al. 2013), and false positives may
arise when there are cellular composition differences associated with dissection variability, disease, normal development
or any other outcome of interest. For example, loss of neurons (or glia) because of disease may cause spurious loci
associations with illness that stem solely from differing cellular compositions between disease states, or cell-type specific
biological differences may exist that become more difficult to detect in the presence of unaffected cell types.

Statistical algorithms estimate the relative or absolute amounts of each cell type in the homogenate tissue data. These
so called “cellular deconvolution” algorithms have been especially popular using DNAm data (Houseman et al. 2014)
as DNAm levels are constrained between 0 and 1 and are binary within single cells (i.e. individual CpGs are either
methylated or unmethylated). These deconvolution algorithms can be classified into two general types, termed
“referenced-based” and “reference-free” (Houseman et al. 2014; Avila Cobos et al. 2018). Reference-free approaches
only require as input an estimate of the number of potential cell types in a particular dataset (which can be non-trivial),
and return latent components that preferentially capture cellular heterogeneity that can be adjusted for in differential
methylation analysis (Houseman et al. 2014; Jaffe and Irizarry 2014; Rahmani et al. 2016). However, these approaches
do not return fractions of cells and may capture potential batch effects in addition to cellular composition. Conversely,
reference-based approaches require cell type-specific genomic profiles for each cell type of interest as an input and return
the relative fraction of each input cell type for each queried bulk sample (Houseman et al. 2012), akin to an in silico cell
counter. This class of algorithms therefore requires the generation of potentially many pure cell populations, which are
typically generated from flow cytometry for applications to DNAm data from bulk tissue.

While DNAm data can generate accurate absolute cell fractions in homogenate brain tissue (Amanda J. Price et al. 2019;
Guintivano et al. 2013; Montaño et al. 2013), there are several important considerations limiting more widespread
application. First, RNA and gene expression profiling has been much more popular in postmortem brain studies, with
more samples profiled with RNA sequencing (RNA-seq) than DNAm microarrays or sequencing. Secondly, the two cell
classes typically used by DNAm-deconvolution algorithms are likely too broad to identify more subtle differences
in dissection variability and potential stereological differences (van Haren et al. 2011; Nelson et al. 1998). While recent
work has extended the number of cell populations that can be isolated by antibodies to separate neurons into their
excitatory and inhibitory subclasses and oligodendrocytes from other glia (Kozlenkov et al. 2018), there are likely very
few additional cell types that are possible to isolate using nuclear antibodies for DNAm samples. Researchers have
therefore turned to using cell type-specific RNA microarray and sequencing datasets to adapt these reference-based
deconvolution algorithms to homogenate RNA-seq samples (Avila Cobos et al. 2018; Newman et al. 2015; Mohammadi
et al. 2017; Gong and Szustakowski 2013; Baron et al. 2016; Wang et al. 2020; Shen-Orr et al. 2010; Abbas et al. 2009;
Wang et al. 2018; Burke et al. 2020; Collado-Torres et al. 2019). The majority of these studies have focused on tissues
other than the brain, which can be freshly obtained and dissociated into individual cells for single cell RNA-seq (scRNA-
seq) or be sorted into specific cell populations using flow cytometry for cell type-specific expression profiling. For
example, the popular CIBERSORT approach (Newman et al. 2015) was designed for blood gene expression microarray
data, but has been adapted to RNA-seq datasets in other tissues. Several of the above algorithms have been designed,
adapted or implemented for brain tissue, including linear regression followed by quadratic programming using the
Houseman algorithm (Houseman et al. 2012; Collado-Torres et al. 2019; Burke et al. 2020), NNLS (Wang et al. 2018),
the support vector machine-based CIBERSORT (Fromer et al. 2016; Hoffman et al. 2017), the empirical Bayes method
MIND (Wang et al. 2020), and MuSiC, which combines a recursive tree based approach with weighted NNLS for cell
type proportion estimation (Wang et al. 2019).

However, few of these approaches have validated that the resulting composition estimates are accurate, i.e., are absolutely
similar to the true underlying composition, particularly in brain tissue. No approach to our knowledge has quantified the
consequences of parameter and algorithm choices when only non-ideal reference data is available (e.g., mismatched
tissue type, species, sequencing protocol, etc.), which occurs in almost all applications. Many reference datasets have
been constructed from purified cell type-specific RNA-seq data from mouse (Xu et al. 2014), or RNA-seq data from
sorted or dissociated nuclei in humans (Lake et al. 2016, 2018; Velmeshev et al. 2019; Hodge et al. 2019; Mathys et al.
2019), and not whole cells, which are typically profiled in homogenate sequencing studies. Gene expression levels are

                                                                                                                            Page 3 of 15
F1000Research 2021, 10:750 Last updated: 03 SEP 2021
also quantitative within individual cells (and not binary like in DNAm data) and the necessity of absolute expression
levels for absolute composition quantification has largely been overlooked.
Here we directly evaluated the absolute accuracy of several popular RNA-seq-based deconvolution strategies using
several different reference datasets including a bulk/homogenate dataset with paired DNAm and RNA-seq data from the
nucleus accumbens (NAc) from 200+ deceased individuals (Markunas et al. 2019). We used the DNAm data to estimate
absolute neuronal fractions for each sample and evaluated absolute RNA-based deconvolution accuracy, using DNAm
based neuronal fractions as proxies for the true unobserved fractions, across a variety of scenarios. We first evaluated the
effects of using deep single cell RNA-seq (scRNA-seq) from healthy fresh human tissue obtained from surgically resected
temporal cortex (Darmanis et al. 2015). This dataset likely produces the most comparable RNA-seq profiles to frozen
bulk postmortem tissue, since whole cells were profiled, and 90% of RNA is cytosolic in the cortex (Jaffe et al. 2015).
However, this dataset was derived from cells in a cortical brain region. We next produced snRNA-seq data from
postmortem human NAc to use as a reference dataset, which results in potentially less comparable nuclear reference
profiles but comes from a more comparable brain region. We lastly used cyclic-ouroboros single-molecule fluorescence
in situ hybridization (osmFISH) imaging data from the somatosensory cortex region in mouse (Codeluppi et al. 2018)
to derive important parameters in popular deconvolution algorithms. Together, our results demonstrate that many
algorithms are not accurate, even when estimating only two cell classes (neurons and glia), and we offer several
strategies to assess and improve accuracy that can be applied across multiple datasets and cell types.
Results
We motivate this work with a large human postmortem brain genomic dataset from the NAc, a brain region containing
functionally distinct cell types critical in reward-processing and addiction (Koob and Volkow 2016; Nestler 2005).
Genomic data from this region has been underrepresented in postmortem human brain sequencing studies, which have
primarily focused on the frontal cortex (Jaffe et al. 2018; Wang et al. 2018; Gandal et al. 2018) but its underrepresentation
allows us to more comprehensively evaluate the accuracy of cellular deconvolution using potentially imperfect and/
or mismatched reference datasets (described below). We dissected homogenate NAc tissue from the ventral striatum
(anterior to the optic chiasm) across 223 adult donors and concurrently extracted DNA and RNA from the exact same
tissue aliquot (see Methods), which allows for directly comparable cellular composition in each fraction. We profiled
genome-wide DNAm with the Illumina Infinium MethylationEPIC microarray and performed reference-based decon-
volution to estimate the fraction of neurons in each sample (see Methods). We have previously demonstrated the absolute
accuracy of the Houseman deconvolution algorithm (Houseman et al. 2012) in postmortem human brain DNAm data
(Guintivano et al. 2013; Amanda J. Price et al. 2019); here we found very high correlation (ρ = 0.949, Figure S1,
Extended data (Sosina et al. 2021)) between the neuronal fraction and the first principal component (PC) of the entire
DNAm profile (32.3% of variance explained), which we have shown to be an accurate surrogate of composition in frontal
cortex (Jaffe et al. 2016) and blood (Jaffe and Irizarry 2014). The corresponding RNA was sequenced using the Illumina
sequencing with RiboZero Gold library preparations (see Methods). This “gold standard” dataset, therefore, has DNAm-
derived neuronal composition values and RNA-seq data from 223 samples to explore the accuracy and concordance of
many popular cellular deconvolution algorithms.
Mismatched reference datasets bias deconvolution
We first assessed the accuracy and concordance of four reference-based deconvolution algorithms: Houseman, CIBER-
SORT, NNLS/MIND, and MuSiC for two cell populations - neurons and non-neurons/glia - in our NAc RNA-seq dataset
using recommended default settings (see Methods). We initially used single-cell RNA-seq (scRNA-seq) data from the
temporal cortex of eight adult donors obtained during surgical resection generated and described in Darmanis et al. (2015)
as the cell type-specific reference profiles for these algorithms. Importantly, these reference data were generated from
fresh tissue, which preserved the integrity of the cells and corresponding cytosolic RNA, the predominant fraction of total
RNA from brain (Jaffe et al. 2015) profiled in homogenate tissue. Furthermore, these reference profiles provide coverage
of entire transcripts (as opposed to only the 3' ends) using Fluidigm C1 sequencing. Therefore, these expression profiles
should be more comparable to bulk brain sequencing studies, with the caveat that the reference dataset was obtained from
a different brain region (temporal cortex versus NAc and from living subjects as opposed to postmortem subjects).
We used measures of root mean square error (RMSE) to assess accuracy and squared Pearson correlation coefficients
(R2) to assess concordance for each algorithm's estimated neuronal fraction compared to the DNAm-based neuronal
fractions (Figure 1). RMSE quantifies the degree of bias, i.e., how much our cell type estimates (RNA composition
estimates) deviate from the inferred absolute cell type fractions, with smaller values corresponding to the inferred cellular
composition and RNA composition being more similar. R2 quantifies the amount of information our estimates contain
about how the inferred absolute cell type fractions vary in the population being studied, i.e., how much inferred variability
of the unobserved cell type fractions, across individuals, is captured by our composition estimates. This is important since
Page 4 of 15F1000Research 2021, 10:750 Last updated: 03 SEP 2021
Figure 1. Deconvolution in bulk NAc data using gene expression profiles from the temporal cortex. Scatter plots
showing the estimated neuronal proportions across the 223 individuals using the Houseman approach for DNAm
reference vs neuronal proportions estimated using (A) the Houseman approach with scRNA reference, (B) MuSiC
with default settings and scRNA reference data, and (C) CIBERSORT with scRNA reference data.
higher R2 values will lead to better elimination of cell-type composition effects in downstream analyses. Houseman
(Figure 1A), MuSiC (Figure 1B), and NNLS produced concordant (high correlation; Houseman R2 = 0.51, 95% CI [0.39,
0.65]; MuSiC R2 = 0.56, 95% CI [0.43, 0.69]; NNLS R2 = 0.54, 95% CI [0.32, 0.68]) but biased (high RMSE, ≥0.35)
neuronal fraction estimates. CIBERSORT produced more discordant (moderate correlation; R2 = 0.25, 95% CI [0.15,
0.38]) neuronal fraction estimates (Figure 1C), but with less bias (low RSME, 0.09). We found that CIBERSORT,
compared to either MuSiC or the Houseman RNA approach, was the most accurate. However, its estimates had the lowest
correlation (R2) with estimates based on DNAm data. In comparing the R2 metric across the three approaches, we found
that MuSiC had the highest correlation. Hence, it provides the most information about the inferred variability of the cell
type proportions based on DNAm data. However, its estimates showed the greatest divergence, relative to other results,
when compared to the inferred estimates from DNAm. These results suggest that all four of these approaches over-
estimated the inferred proportion of neurons in bulk brain tissue, even under the simplest application to deconvoluting
two distinct cell populations. However, it was unclear how much algorithm parameters and reference dataset differences
(in regard to technology and brain region) contributed to the performance of these methods.
Methods for reducing bias in cellular deconvolution
Many of the above deconvolution strategies have several parameters whose adjustment could reduce the observed
bias (i.e. maximize accuracy) and increase the concordance between these neuronal fractions. The MuSiC algorithm
particularly has an interpretable “cell size” (see Methods) parameter used in the deconvolution process. Different cell
types could have more or less absolute RNA abundance, for example if they were larger or smaller, or if they were more or
less transcriptionally active. We hypothesized that the overestimation of neuronal fractions resulted from neurons being
larger and more transcriptionally active. However, this “cell size” parameter, regularly defined by the algorithm as the
average expression level for a given cell type summed across genes, is estimated directly from the reference cell type-
specific RNA-seq profiles by default (see Methods). However, some scRNA-seq (or snRNA-seq) library preparation
and sequencing strategies, like the Fluidigm C1 system, may normalize cDNA libraries to the same concentration prior
to sequencing, which will remove potential variability in RNA abundances across cell types. We therefore sought to
use external data to better estimate these cell size parameters (Table 1) and assessed the resulting effects on cellular
deconvolution accuracy.
First, we used external ouroboros single-molecule fluorescence in situ hybridization (osmFISH) data from mouse
somatosensory cortex (Codeluppi et al. 2018) to construct two different types of cell size parameters for the MuSiC
Table 1. Cell sizes used for deconvolution.
Cell type NAc 50 NAc 25 NAc all Temporal cortex, osmFISH osmFISH
genes genes genes Darmanis et al. cell Area nRNA
(UMIs) (UMIs) (UMIs) (Counts) (μm2) (intensity)
Glial 710.63 453.24 5763.55 12879.73 90.87 180.46
Neuronal 4513.58 2793.54 29884.65 18924.66 122.96 198.86
Neuronal/ 6.35 6.16 5.19 1.47 1.35 1.1
glial ratio
UMI, unique molecular identifier, counts= log2(cpm+0.5), intensity = sum of probe intensities across 24,048 genes.
Page 5 of 15F1000Research 2021, 10:750 Last updated: 03 SEP 2021
algorithm (as data from NAc did not exist). We extracted the estimates of both cell size (via their provided segmentations)
and total RNA abundance (via the sum of all gene fluorescence signal) aggregated across neuronal and non-neuronal
cell types. We subsequently utilized these estimates as proxies for cell size in human RNA-seq data when deconvoluting
neuronal fractions. In these data, comparing neurons to non-neurons, neurons were both larger (123 vs 91 μm2, 95% CI
[28 μm2, 36 μm2]) and had more total RNA (199 vs 180 intensity, 95% CI [11, 25]) as we observed in the estimated
cell size in the MuSiC algorithm using the Darmanis dataset (18,925 vs 12,880 normalized counts). We did not observe
any improvement in the concordance (osmFISH cell area R2 = 0.55, 95% CI [0.43, 0.69] ; osmFISH totalRNA R2 = 0.54,
95% CI [0.42, 0.68]) or accuracy (osmFISH cell area RMSE = 0.39; osmFISH totalRNA RMSE = 0.43) of the estimated
cell type fractions when we compared our results from default settings to those based on applying cell size proxies using
mouse data (Figure S2 A-B, Extended data (Sosina et al. 2021)). These results may not be particularly surprising, given
the numerous differences between mouse and human morphology, and the different brain regions profiled.
We then generated snRNA-seq dataset from two postmortem NAc donors and 4,169 total nuclei to produce more
comparable cell type-specific cell size (see Methods) parameters and reference expression profiles (see Methods) (Tran
et al. 2020). First, we used the NAc reference dataset at the single nucleus level and ran the MuSiC algorithm with default
settings, which used both NAc-based cell sizes and expression profiles, to deconvolute neuronal fractions (Figure 2A).
We confirmed that, on average, neurons had more total RNA than non-neurons using this NAc snRNA-seq dataset
(103 vs. 72 unique molecular identifiers [UMIs] per gene). Furthermore, while there was a high correlation among
neuron-specific gene expression effects across the NAc and temporal cortex (Darmanis et al. 2015) reference profile
datasets, we observed genes with different magnitudes of effects based on differential expression results between
neuronal and non-neuronal cell types (Figure S3, Extended data (Sosina et al. 2021)). When using both the NAc-based
cell size and gene expression reference profiles, we observed a substantial improvement in both the concordance and the
RMSE for the estimated neuronal fractions compared to using the temporal cortex dataset only. However, the estimates
were still biased, and this bias increased as the neuronal fraction across individuals increased, suggesting that the NAc-
based cell sizes together with the estimated abundance may be incorrectly characterizing the true underlying neuronal
expression level for these individuals. Eliminating the cell size parameter resulted in similarly reduced concordances in
both the temporal cortex and the NAc reference datasets, but increased accuracy only using the NAc reference dataset
(Table 2). This implies that the underlying broad cellular composition was well captured by the gene “abundance”
information for a matched brain region.
We then combined different estimates of cell size parameters (NAc snRNA-seq versus osmFISH) and gene expression
reference profiles (NAc snRNA-seq versus temporal cortex scRNA-seq) and assessed the effects on deconvolution
accuracy in bulk NAc RNA-seq data. When running MuSiC using the estimates of cell size based on osmFISH data with
the NAc expression reference profiles, we observed further improvements in the bias of the estimated cell type fractions
but saw a minimal difference in the concordance (Figure 2B and C). Surprisingly, when we used only the Darmanis cell
type-specific expression levels, the best (least biased and most concordant) deconvolution results were produced using
cell sizes estimated from NAc snRNA-seq data, with improvements in both the concordance and the RMSE (Figure 3A).
Specifically, when we compared the R2 and the RMSE estimates to those observed under the default setting for the
Darmanis reference with the mismatched brain region, we see a small (6% relative change, 95% CI [0.18%, 11.67%])
Figure 2. Deconvolution in bulk NAc data based on a single nucleus RNA-seq (snRNA-seq) reference dataset
from the same brain region. Scatter plots comparing the estimated neuronal proportion obtained for each
individual using the Houseman approach with DNAm reference dataset vs neuronal proportions obtained using
(A) MuSiC with default settings and a snRNA-seq NAc reference dataset, (B) MuSiC based on a snRNA-seq NAc
reference dataset with cell sizes for each cell type estimated using osmFISH cell area (mouse), and (C) MuSiC based on
a snRNA-seq NAc reference dataset with cell sizes for each cell type estimated using osmFISH total RNA abundance
(mouse) per cell type.
Page 6 of 15F1000Research 2021, 10:750 Last updated: 03 SEP 2021
Table 2. Bias and concordance results for deconvolution of bulk NAc data using each cell size and gene
expression reference dataset.
Method Cell size Reference dataset
scRNA-seq in temporal snRNA-seq in NAc
cortex (Darmanis et al.)
Concordance Accuracy Concordance Accuracy
(R2) (RMSE) (R2) (RMSE)
MuSiC None 0.54 0.45 0.54 0.08
scRNA-seq in temporal cortex 0.56 0.37 0.58 0.05
(Darmanis et al.)
snRNA-seq in NAc 0.59 0.08 0.71 0.17
snRNA-seq in NAc (Top 25 genes) 0.59 0.06 0.71 0.18
snRNA-seq in NAc (Top 50 genes) 0.59 0.05 0.72 0.18
osmFISh-Cell area 0.55 0.38 0.57 0.05
osmFISh-Total RNA 0.54 0.43 0.54 0.06
CIBERSORT N/A 0.25 0.09 N/A N/A
NNLS N/A 0.54 0.40 0.72 0.22
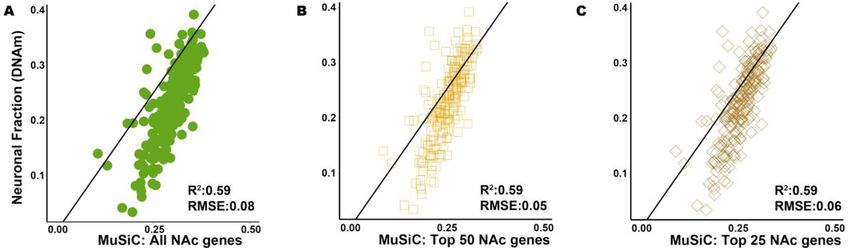
Figure 3. Deconvolution in bulk NAc data using gene expression profiles from the temporal cortex and
different estimates of cell size. Scatter plots comparing the neuronal fraction estimated for each individual using
DNAm data and the Houseman method vs neuronal fractions based on scRNA-seq data and estimated using MuSiC
with (A) cell-size estimated using all genes expressed in the NAc snRNA-seq reference dataset, (B) cell-size estimated
using the top 50 cell type discriminating genes in the NAc snRNA-seq reference dataset, and (C) cell-size estimated
using the top 25 cell type discriminating genes in the NAc snRNA-seq reference dataset.
increase for the concordance and a substantial (78% relative change, 95% CI [77%, 79%]) decrease for the RMSE. We
further refined the NAc cell size estimates using sets of the top 25 and 50 cell type discriminating genes (see Methods),
which slightly improved our estimates of the absolute cell type fractions (Figure 3B and C). Both the concordance (7%
relative change, 95% CI [0.16%, 12.74%]) and RMSE (86% relative change, 95% CI [84%, 87%]) improved even more
when compared to the default approach using a mismatched reference dataset. Across all approaches, the most accurate
(least biased) result occurred when we used cell sizes estimated from Darmanis scRNA-seq data and gene expression
from NAc snRNA-seq data, while the most concordant results were observed when we used NAc snRNA-seq data
exclusively.
In summary, when we used a region-matched appropriate dataset - NAc snRNA-seq data - as the reference, or to derive
estimates of the cell size, we observed that estimates of the cell type proportions generally improved (Table 2, Figure 2A
and Figure 3A-C). In settings where we had a mismatched reference dataset (e.g., mismatched on brain region or species),
incorporating estimated cell sizes obtained from the matched brain region (NAc) provided the best result in metrics for
both concordance and accuracy, and we slightly improved these metrics when we refined the gene sets used to estimate
the cell sizes.
Page 7 of 15F1000Research 2021, 10:750 Last updated: 03 SEP 2021
Discussion
Statistical deconvolution strategies have emerged over the past decade to estimate the proportion of various cell
populations in homogenate tissue sources like blood and brain from both gene expression and DNAm data. Our results
together suggest that many existing RNA deconvolution algorithms estimate the RNA composition of homogenate tissue,
e.g. the amount of RNA attributable to each cell type, and not the cellular composition, which relates to the underlying
fraction of cells. This was evident by the consistent overestimation of larger and more transcriptionally active neuronal
cells. We have identified that incorporating cell size parameters into RNA-based deconvolution algorithms can
successfully recover cellular fractions in homogenate brain RNA-seq data. We have lastly shown that using both cell
sizes and cell type-specific gene expression profiles from brain regions other than the target/user-provided bulk tissue
RNA-seq dataset consistently resulted in overestimating neuronal fractions. We have developed an extension of the
MuSiC framework (Wang et al. 2019) that allows for the incorporation of independent cell size estimates, and have
further provided cell size estimates for human brain (shown in Table 1) as a part of the package: https://github.com/
xuranw/MuSiC.
Characterizing cellular heterogeneity is especially important in human brain, where the underlying cell types can
have diverse functions and disease associations that could be missed in studies of bulk tissue (Michels et al. 2013).
Here we show that RNA-based deconvolution for just two cell populations - neurons and non-neurons - largely fails to
estimate the underlying cellular composition of bulk human brain tissue across a variety of algorithms and strategies. We
quantified the diverse range of neuronal fractions estimated by several popular algorithms to better understand the effects
of reference cell type-specific expression profiles and differences in cell size and/or activity profiles on deconvolution.
We specifically examined the common scenario of performing RNA deconvolution using cell type-specific reference
datasets that can be fundamentally different from user-provided homogenate tissue target datasets, for example differing
in profiled brain region, sequencing technology and/or cellular compartment. These problems are likely magnified in
human brain tissue compared to suspended cells like blood, where deconvolution strategies are more easily validated
against true cell fractions obtained by routine complete cell counts (Newman et al. 2015). We also note that while the
effect of replacing the cell sizes is a general shift of all the points in the scatter plot which in turn changes the RMSE
estimates, our goal in this paper is way to develop an approach to estimate the right shift needed to correct the biased
estimates. Our results show that using the same dataset set to estimate both cell-size and abundance can lead to biased
estimates. We lastly emphasize caution when performing RNA-based deconvolution using many cell types (i.e., more
finely partitioned cell classes) without having the ability to validate cell counts on at least a subset of samples.
We therefore offer several recommendations for performing RNA-based deconvolution in bulk human brain gene
expression data, particularly when aiming to identify cellular, and not RNA, composition.
1. Providing estimates of cell size for each reference cell type improves the concordance and reduces bias
when performing RNA deconvolution to estimate cellular fractions. Biologically-motivated and valid external
estimates of cell-size improve the accuracy of the estimated cell type fractions, even when gene expression
profiles for reference cell populations are obtained from other brain regions (Figure 3). The exact biological
interpretation of these estimated cell sizes, particularly when estimated across species, is arguably unclear, but
likely relates to correcting for absolute RNA abundance and differences in transcriptional activity between cell
populations. Regardless of the method used for deriving cell sizes, neurons consistently had more RNA than
glia. We note that our recommended strategies for estimating cell size have only been assessed for broad classes
of cell types, and further work is needed to validate extensions to more stratified subclasses of cells.
2. The concordance and bias improvements using full-length single cell sequencing from a different brain region
(temporal cortex), rather than single nuclei RNA-seq from the target brain region (NAc) highlighted the
importance of comparability between reference gene expression profiles and the homogenate tissue expression
levels. While previous reports have identified high correlation between nuclear and cytosolic gene expression
levels in both bulk (Amanda J. Price et al. 2019) and single cell (Bakken et al. 2018; Hodge et al. 2019)
resolution, comparable absolute (and not relative) expression levels are seemingly important for the accuracy of
these RNA-based cellular deconvolution algorithms. There further is an experimental design tradeoff between
profiling more nuclei (1000s) using 3' technologies like 10x Genomics Chromium Single Cell Gene Expression
compared to profiling fewer nuclei (or cells, 100s) using full-length sequencing technologies like SMART-seq if
researchers wish to generate their own reference profiles.
3. Using reference cell type-specific expression profiles from comparable brain regions as the bulk RNA-seq target
dataset is important and can especially greatly increase the concordance of these RNA deconvolution strategies
with neuronal fractions.
Page 8 of 15F1000Research 2021, 10:750 Last updated: 03 SEP 2021
The choice of maximizing accuracy (by minimizing bias) versus increasing concordance in assessing these algorithms is an
important consideration, particularly when generating custom expression reference profiles is prohibitive (Table 2). These
two objectives largely relate to whether the goal of RNA deconvolution is to obtain correct estimates of absolute cell
fractions (and maximize accuracy) or to identify/leverage differences in cell/RNA fractions (and maximize concordance)
as a basis to obtain cell-type specific inference for a given gene. Estimation of RNA fractions (by maximizing concordance)
may be sufficient to control for potential confounding due to composition differences between outcome groups (Michels
et al. 2013). We note this can also be accomplished using “reference-free” deconvolution (Houseman et al. 2014) or
through the estimation of potentially sparse principal components (Rahmani et al. 2016; Jaffe and Irizarry 2014) that
control for relative differences in cellular composition. However, estimation of cellular fractions (and maximizing
accuracy) is arguably more useful, both for assessing human brain tissue dissection during data generation and to identify
cell type-specific effects when using these cellular fractions in downstream differential expression analyses (Zheng et al.
2018).
Together, our results demonstrate that many RNA deconvolution algorithms do not produce accurate cellular fractions
when estimating only two cell classes (neurons and non-neurons). We offer several strategies and corresponding software
to assess and improve accuracy that can be applied across multiple datasets and cell types.
Methods
Ethics statement
Brain donation protocols were approved by IRB and oversight bodies. Legal next-of-kin gave informed consent to brain
donation according to protocols Maryland Department of Health MDHMH# 12-24 (MD), National Institute of Mental
Health [NIMH]# 90-M-014 (for brain donations in DC and VA), and Western Institutional Review Board [WIRB] #
1126332 (for brain donations in MD, WMU, UND), respectively. Subsequent research on human postmortem brain
tissue - including the RNA sequencing performed here - is not classified as Human Subjects Research (since postmortem
subjects are not classified as Human Subjects, per the Department of Health and Human Services in DHHS 45 CFR
§46.102(e)(1):).
Bulk NAc data generation and processing
Data generation and processing were described extensively in Markunas et al. (2019). Briefly, the nucleus accumbens
(NAc) was dissected under visual guidance using a hand-held dental drill. Samples were obtained from the ventral
striatum, anterior to the optic chiasm, at the level where the NAcforms a bridge between the putamen and the head of the
caudate. DNA and RNA were concurrently extracted from dissected tissue using the Qiagen AllPrep DNA/RNA Mini Kit
(Cat No./ID: 80204).
NAc DNA was profiled with the Infinium MethylationEPIC microarray (catalog #: WG-317-1003) using the manufac-
turer's protocol. Raw idat files were processed and normalized using the minfi Bioconductor package (Aryee et al. 2014)
using stratified quantile normalization (Touleimat and Tost 2012). Resulting neuronal fractions were estimated using the
minfi estimate CellCounts function (Jaffe and Irizarry 2014) using sorted reference data from the DLPFC for neurons and
non-neurons (Guintivano et al. 2013; Andrew E. Jaffe 2017) using the Houseman algorithm (Houseman et al. 2012).
NAc RNA was subjected to RNA-seq library preparations using the Illumina RiboZero Gold kits (catalog #: 20020599)
and sequenced using 2100 bp paired end reads on an Illumina HiSeq 3000.
Reference datasets
Darmanis: SRP057196 (Darmanis et al. 2015).
scRNA-seq data for 58,037 genes and 556 cells were obtained for brain samples across eight individuals, as described
previously (Darmanis et al. 2015). We filtered this dataset by removing cells based on embryonic samples and retaining
cells from one of the following five cell types: neuronal, oligodendrocyte progenitor cells (OPC), astrocytes, oligoden-
drocytes, and microglia. We also removed genes that had no expression for all cells in the reference dataset or did
not show any expression in the bulk dataset (i.e., mean and variance zero). In total, we used 265 cells for this reference and
24,048 genes to estimate the cell type proportions for the 223 samples with bulk NAc data.
Single-nucleus RNA-seq data generation and processing in nucleus accumbens
We performed single-nucleus RNA-seq (snRNA-seq) on nucleus accumbens (NAc) tissue from two donors using 10
Genomics Single Cell Gene Expression V3 technology (PN-1000075) as previously described (Tran et al. 2020). Briefly,
Page 9 of 15F1000Research 2021, 10:750 Last updated: 03 SEP 2021
nuclei were isolated using a “Frankenstein” nuclei isolation protocol developed by Martelotto et al. for frozen tissues (2017;
Lacar et al. 2016; Lake et al. 2016; Habib et al. 2016; Hu et al. 2017). Briefly, ~40 mg of frozen NAc tissue was homogenized
in chilled Nuclei EZ Lysis Buffer (MilliporeSigma) in a glass dounce with ~15 strokes per pestle. Homogenate was
filtered using a 70 um-strainer mesh and centrifuged at 500g for 5 minutes at 4°C in a benchtop centrifuge. Nuclei
were resuspended in the EZ lysis buffer, centrifuged again, and equilibrated to nuclei wash/resuspension buffer (1 PBS,
1% BSA, 0.2 U/uL RNase Inhibitor). Nuclei were washed and centrifuged in this nuclei wash/resuspension buffer three
times, before labeling with DAPI (10 ug/mL). The sample was then filtered through a 35 um-cell strainer and sorted on a BD
FACS Aria II Flow Cytometer (Becton Dickinson) at the Johns Hopkins University Sidney Kimmel Comprehensive Cancer
Center (SKCCC) Flow Cytometry Core. Gating criteria were hierarchically selected for whole, singlet nuclei (by forward/
side scatter), then for G0/G1 nuclei (by DAPI fluorescence). A null sort was additionally performed from the same preparation
to ensure nuclei input was free of debris. Approximately 8,500 single nuclei were sorted directly into 25.1uL of reverse
transcription reagents from the 10 Genomics Single Cell 3’ Reagents kit (PN-1000075, without enzyme). Libraries were
prepared according to manufacturer’s instructions (10 Genomics) and sequenced on the Next-seq (Illumina) at the Johns
Hopkins University Transcriptomics and Deep Sequencing Core.
We processed the sequencing data with the 10 Genomics’ Cell Ranger pipeline, aligning to the human reference
genome GRCh38, with a reconfigured GTF such that intronic alignments were additionally counted given the nuclear
context, to generate UMI/feature-barcode matrices. We used R package Seurat (Satija et al. 2015) for raw feature-barcode
quality control, dimensionality reduction (PCA), choosing the top 30 PCs as the optimal dimensions for clustering. We
performed graph-based clustering with the default Louvain approach, taking a computed K-nearest neighbors graph as
input, which were then annotated with well-established cell type markers for nuclear type identity (Mathys et al. 2019).
We also used Seurat’s implementation of non-linear dimensionality reduction techniques, t-SNE and UMAP, simply
for visualization of the high-dimensional structure in the data, which complemented the clustering results (Figure S4,
Extended data (Sosina et al. 2021)). With the five broad cell type annotations (neurons, oligodendrocytes, oligoden-
drocyte precursors, astrocytes, and microglia) of nuclear clusters, we identified unbiased cluster-driving genes (with
Seurat’s ‘FindAllMarkers()’ function, using the Wilcoxon rank-sum test), that were upregulated in each cell type/cluster,
compared to all other nuclei. Using the same set of 24,048 genes, we have 4,169 high-quality nuclei in this reference,
evenly distributed across donors. The top 50- and top 25-per-cell-type gene sets had 247 and 125 genes, respectively,
which included many cell type marker genes used for annotation.
Estimation procedures
HOUSEMAN
This algorithm (Houseman et al. 2012) uses a linearly constrained quadratic optimization approach with additional non-
negative constraints on the parameters. The linear constraint does not require that the sum of all coefficients equal one.
This allows the possibility of unknown cell types in case the specification is not comprehensive. It was implemented using
the minfi R Bioconductor package (Aryee et al. 2014).
MuSiC
The MuSiC (Wang et al. 2019) approach models the relationship between the relative abundance of gene g in the bulk
RNA-seq data and the mean expression level of the same gene in the reference dataset for a given individual. The
relationship is provided below
XK
Y g ∝ k¼1 pk Sk θkg
Where k = 1,...,K is the index of the cell types, pk is the proportion of cells from cell type k, and θkg is the relative abundance
for the gth gene with respect to the kth cell type. Sk is the cell size parameter and is defined as the average number of
total mRNA molecules for cell type k. By default, Sk is estimated automatically by MuSiC. For the deconvolution method
comparisons that assessed cell size impact on neuronal cell type proportion estimation, Sk was derived from one of
multiple data sources (Table 1) using 1) default settings 2) osmFISH or 3) the average number of total mRNA molecules
for cell type k using only the top 25 or 50 most discriminating genes per cell type. We defined “most discriminating” as
genes with the smallest p-values and fold change >0.25, relative to other cell types. All estimation was carried out using
the MuSiC package in R v3.6.3.
Page 10 of 15F1000Research 2021, 10:750 Last updated: 03 SEP 2021
CIBERSORT
CIBERSORT uses a machine learning approach called nu-support vector regression (Newman et al. 2015; Schölkopf
et al., 2000) and requires at least two input datasets to work. The first is a signature matrix that identifies the set of
genes that are informative for the deconvolution procedure. The second is a bulk RNA-seq dataset to estimate cell type
proportions.
The signature matrix depends on the tissue of interest. We generated a custom signature matrix. Using the Darmanis
reference dataset, we generated both a reference sample file (gene-by-cell matrix) and a phenotype classes file (cell type-
by-dummy variable identifying the cell type for each cell) and used the default setting (CIBERSORT) to obtain a
custom signature gene expression matrix. The specified false discovery rate (FDR) threshold used to include genes in
the signature matrix was 0.30 (i.e. q = 0.30, default). Using this signature matrix, we then performed deconvolution on our
bulk NAc RNA-seq data. As suggested in the documentation for CIBERSORT, we disabled quantile normalization for
our RNA-seq data.
NNLS/MIND
This is a simple linear regression with non-negativity constraints on the parameter estimates. The estimated fractions are
then the value of each parameter estimate divided by the sum of all parameter estimates across cell types. MIND uses
NNLS to estimate cell type fractions.
Data availability
Underlying data
Gene Expression Omnibus: Genome-wide RNA-sequencing differences in nucleus accumbens of smokers vs. non-
smokers, Accession number GSE171936: https://identifiers.org/geo:GSE171936.
Extended data
Zenodo: Strategies for cellular deconvolution in human brain RNA sequencing data. https://doi.org/10.5281/zenodo.
4899937 (Sosina et al. 2021).
This project contains the following extended data:
- sosina_extended_sf1.docx (Figure S1, DNAm estimated neuronal fractions vs PC1)
- sosina_extended_sf2.docx (Figure S2, Deconvolution in bulk NAc data using gene expression profiles from the
temporal cortex with cell size estimates derived using mouse samples)
- sosina_extended_sf3.docx (Figure S3, Neuronal enrichment of gene expression in scRNA-seq from temporal
cortex and snRNA-seq from nucleus accumbens)
- sosina_extended_sf4.docx (Figure S4, t-distributed stochastic neighbor embedding (t-SNE) of single-nucleus
RNA-seq data from the two postmortem NAc samples, representing the 4,169 high-quality nuclei after proces-
sing)
Data are available under the terms of the Creative Commons Attribution 4.0 International license (CC-BY 4.0).
Analysis code available from: https://github.com/ksosina/Strategies-for-cellular-deconvolution-in-human-brain-RNA-
sequencing-data.
Archived analysis code at time of publication: https://doi.org/10.5281/zenodo.5009842 (ksosina, 2021).
License: CC0 1.0 Universal.
Acknowledgements
The authors thank the authors of MuSiC; X. Wang, J. Park, K. Susztak, N.R. Zhang, and M. Li for their technical
assistance and valuable insights.
Page 11 of 15F1000Research 2021, 10:750 Last updated: 03 SEP 2021
References
Abbas AR, Wolslegel K, Seshasayee D, et al.: Deconvolution of blood Hu P, Fabyanic E, Kwon DY, et al.: Dissecting Cell-Type Composition and
microarray data identifies cellular activation patterns in systemic Activity-Dependent Transcriptional State in Mammalian Brains by
lupus erythematosus. Plos One. 2009; 4(7): e6098. Massively Parallel Single-Nucleus RNA-Seq. Mol Cell. 2017; 68(5),
PubMed Abstract|Publisher Full Text|Free Full Text pp. 1006–1015. e7.
Jaffe AE, K ZA: FlowSorted.DLPFC.450k. Bioconductor. 2017. PubMed Abstract|Publisher Full Text|Free Full Text
Publisher Full Text Jaffe AE, Gao Y, Deep-Soboslay A, et al.: Mapping DNA methylation
Aryee MJ, Jaffe AE, Corrada-Bravo H, et al. : Minfi: a flexible and across development, genotype and schizophrenia in the human
comprehensive Bioconductor package for the analysis of Infinium frontal cortex. Nat Neurosc. 2016; 19(1): 40–47.
DNA methylation microarrays. Bioinformatics. 2014; 30(10): 1363–1369. PubMed Abstract|Publisher Full Text|Free Full Text
PubMed Abstract|Publisher Full Text|Free Full Text Jaffe AE, Irizarry RA: Accounting for cellular heterogeneity is critical in
Avila Cobos F, Vandesompele J, Mestdagh P, et al.: Computational epigenome-wide association studies. Genome Biol. 2014; 15(2): R31.
deconvolution of transcriptomics data from mixed cell populations. PubMed Abstract|Publisher Full Text|Free Full Text
Bioinformatics. 2018; 34(11): 1969–1979. Jaffe AE, Shin J, Collado-Torres L, et al.: Developmental regulation of
PubMed Abstract|Publisher Full Text human cortex transcription and its clinical relevance at single base
Bakken TE, Hodge RD, Miller JA, et al.: Single-nucleus and single-cell resolution. Nat Neurosci. 2015; 18(1): 154–161.
transcriptomes compared in matched cortical cell types. Plos One. PubMed Abstract|Publisher Full Text|Free Full Text
2018; 13(12): e0209648. Jaffe AE, Straub RE, Shin JH, et al.: Developmental and genetic regulation
PubMed Abstract|Publisher Full Text|Free Full Text of the human cortex transcriptome illuminate schizophrenia
Baron M, Veres A, Wolock SL, et al.: A Single-Cell Transcriptomic Map of pathogenesis. Nat Neurosci. 2018; 21(8): 1117–1125.
the Human and Mouse Pancreas Reveals Inter- and Intra-cell PubMed Abstract|Publisher Full Text|Free Full Text
Population Structure. Cell Systems. 2016; 3(4): 346–360. e4. Koob GF, Volkow ND: Neurobiology of addiction: a neurocircuitry
PubMed Abstract|Publisher Full Text|Free Full Text analysis. Lancet. Psychiatry. 2016; 3(8): 760–773.
Burke EE, Chenoweth JG, Shin JH, et al.: Dissecting transcriptomic PubMed Abstract|Publisher Full Text|Free Full Text
signatures of neuronal differentiation and maturation using iPSCs. Kozlenkov A, Li J, Apontes P, et al.: A unique role for DNA (hydroxy)
Nat Commun. 2020; 11(1): 462. methylation in epigenetic regulation of human inhibitory neurons.
PubMed Abstract|Publisher Full Text|Free Full Text Sci Adv. 2018; 4(9): eaau6190.
Codeluppi S, Borm LE, Zeisel A, et al.: Spatial organization of the PubMed Abstract|Publisher Full Text|Free Full Text
somatosensory cortex revealed by osmFISH. Nat Methods. 2018; 15(11): ksosina: ksosina/Strategies-for-cellular-deconvolution-in-human-
932–935. brain-RNA-sequencing-data: Initial release (Version v1.0.0). Zenodo.
PubMed Abstract|Publisher Full Text 2021, June 22.
Collado-Torres L, Burke EE, Peterson A, et al.: Regional Heterogeneity in Publisher Full Text
Gene Expression, Regulation, and Coherence in the Frontal Cortex Lacar B, Linker SB, Jaeger BN, et al.: Nuclear RNA-seq of single neurons
and Hippocampus across Development and Schizophrenia. Neuron. reveals molecular signatures of activation. Nat Commun. 2016; 7:
2019; 103(2): 203–216. e8. 11022.
PubMed Abstract|Publisher Full Text|Free Full Text PubMed Abstract|Publisher Full Text|Free Full Text
Darmanis S, Sloan SA, Zhang Y, et al. : A survey of human brain Lake BB, Ai R, Kaeser GE, et al.: Neuronal subtypes and diversity
transcriptome diversity at the single cell level. Proc Natl Acad Sci U S A. revealed by single-nucleus RNA sequencing of the human brain.
2015; 112(23): 7285–7290. Science. 2016; 352(6293): 1586–1590.
PubMed Abstract|Publisher Full Text|Free Full Text PubMed Abstract|Publisher Full Text|Free Full Text
Fromer M, Roussos P, Sieberts SK, et al. : Gene expression elucidates Lake BB, Chen S, Sos BC, et al.: Integrative single-cell analysis of
functional impact of polygenic risk for schizophrenia. Nat Neurosci. transcriptional and epigenetic states in the human adult brain. Nat
2016; 19(11): 1442–1453. Biotechnol. 2018; 36(1): 70–80.
PubMed Abstract|Publisher Full Text|Free Full Text PubMed Abstract|Publisher Full Text|Free Full Text
Gandal MJ, Zhang P, Hadjimichael E, et al.: Transcriptome-wide isoform- Markunas CA, Semick SA, Quach BC, et al.: Genome-wide DNA
level dysregulation in ASD, schizophrenia, and bipolar disorder. methylation differences in nucleus accumbens of smokers
Science. 2018; 362(6420). vs. nonsmokers. BioRxiv. 2019.
PubMed Abstract|Publisher Full Text|Free Full Text PubMed Abstract|Publisher Full Text|Free Full Text
Gong T, Szustakowski JD: DeconRNASeq: a statistical framework for Mathys H, Davila-Velderrain J, Peng Z, et al.: Single-cell transcriptomic
deconvolution of heterogeneous tissue samples based on mRNA-Seq analysis of Alzheimer’s disease. Nature. 2019; 570(7761): 332–337.
data. Bioinformatics. 2013; 29(8): 1083–1085. PubMed Abstract|Publisher Full Text|Free Full Text
PubMed Abstract|Publisher Full Text Michels KB, Binder AM, Dedeurwaerder S, et al.: Recommendations for
Guintivano J, Aryee MJ, Kaminsky ZA: A cell epigenotype specific model the design and analysis of epigenome-wide association studies. Nat
for the correction of brain cellular heterogeneity bias and its Methods. 2013; 10(10): 949–955.
application to age, brain region and major depression. Epigenetics. PubMed Abstract|Publisher Full Text
2013; 8(3): 290–302. Mohammadi S, Zuckerman N, Goldsmith A, et al. : A critical survey of
PubMed Abstract|Publisher Full Text|Free Full Text deconvolution methods for separating cell types in complex tissues.
Habib N, Avraham-Davidi I, Basu A, et al.: Massively parallel single- Proc IEEE. 2017; 105(2): 340–366.
nucleus RNA-seq with DroNc-seq. Nat Methods. 2017; 14(10): 955–958. Publisher Full Text
PubMed Abstract|Publisher Full Text|Free Full Text Montaño CM, Irizarry RA, Kaufmann WE, et al. : Measuring cell-type
Habib N, Li Y, Heidenreich M, et al.: Div-Seq: Single-nucleus RNA-Seq specific differential methylation in human brain tissue. Genome Biol.
reveals dynamics of rare adult newborn neurons. Science. 2016; 2013; 14(8): R94.
353(6302): 925–928. PubMed Abstract|Publisher Full Text|Free Full Text
PubMed Abstract|Publisher Full Text|Free Full Text Nelson MD, Saykin AJ, Flashman LA, et al. : Hippocampal volume
Hodge RD, Bakken TE, Miller JA, et al.: Conserved cell types with reduction in schizophrenia as assessed by magnetic resonance
divergent features in human versus mouse cortex. Nature. 2019; imaging: a meta-analytic study. Arch Gen Psychiatry. 1998; 55(5):
573(7772): 61–68. 433–440.
PubMed Abstract|Publisher Full Text|Free Full Text PubMed Abstract|Publisher Full Text
Hoffman GE, Hartley BJ, Flaherty E, et al.: Transcriptional signatures of Nestler EJ: Is there a common molecular pathway for addiction? Nat
schizophrenia in hiPSC-derived NPCs and neurons are concordant Neurosci. 2005; 8(11): 1445–1449.
with post-mortem adult brains. Nat Commun. 2017; 8(1): 2225. PubMed Abstract|Publisher Full Text
PubMed Abstract|Publisher Full Text|Free Full Text Newman AM, Liu CL, Green MR, et al. : Robust enumeration of cell
Houseman EA, Accomando WP, Koestler DC, et al.: DNA methylation subsets from tissue expression profiles. Nat Methods. 2015; 12(5):
arrays as surrogate measures of cell mixture distribution. BMC 453–457.
Bioinformatics. 2012; 13: 86. PubMed Abstract|Publisher Full Text|Free Full Text
PubMed Abstract|Publisher Full Text|Free Full Text Price AJ, Collado-Torres L, Ivanov NA, et al.: Divergent neuronal DNA
Houseman EA, Molitor J, Marsit CJ: Reference-free cell mixture methylation patterns across human cortical development reveal
adjustments in analysis of DNA methylation data. Bioinformatics. 2014; critical periods and a unique role of CpH methylation. Genome Biol.
30(10): 1431–1439. 2019; 20(1): 196.
PubMed Abstract|Publisher Full Text|Free Full Text PubMed Abstract|Publisher Full Text|Free Full Text
Page 12 of 15You can also read


