CONSTRUCTION AND BENCHMARKING OF A MULTI-ETHNIC REFERENCE PANEL FOR THE IMPUTATION OF HLA CLASS I AND II ALLELES - MPG.PURE
←
→
Page content transcription
If your browser does not render page correctly, please read the page content below
Human Molecular Genetics, 2019, Vol. 28, No. 12       2078–2092

                                                                                   doi: 10.1093/hmg/ddy443
                                                                                   Advance Access Publication Date: 26 December 2018
                                                                                   Bioinformatics Article

                                                                                                                                                         Downloaded from https://academic.oup.com/hmg/article-abstract/28/12/2078/5261434 by MPI Evolutionary Biology user on 10 July 2019
B I O I N F O R M AT I C S A R T I C L E

Construction and benchmarking of a multi-ethnic
reference panel for the imputation of HLA class I and
II alleles
Frauke Degenhardt1,† , Mareike Wendorff1,† , Michael Wittig1 , Eva Ellinghaus2 ,
Lisa W. Datta3 , John Schembri4 , Siew C. Ng5 , Elisa Rosati1 ,
Matthias Hübenthal1 , David Ellinghaus1 , Eun Suk Jung1,6 , Wolfgang Lieb7 ,
Shifteh Abedian8,9 , Reza Malekzadeh9 , Jae Hee Cheon6 , Pierre Ellul4 ,
Ajit Sood10 , Vandana Midha10,11 , B.K. Thelma12 , Sunny H. Wong5 ,
Stefan Schreiber1,13 , Keiko Yamazaki14,15 , Michiaki Kubo16 ,
Gabrielle Boucher17 , John D. Rioux17,18 , Tobias L. Lenz19 , Steven R. Brant3,20,21
and Andre Franke1,*
1 Institute     of Clinical Molecular Biology, Christian-Albrechts-University of Kiel, 24105 Kiel, Germany,
2 K.G. Jebsen       Inf lammation Research Centre, Institute of Clinical Medicine, University of Oslo, Oslo University
Hospital, Rikshospitalet, 0424 Oslo, Norway, 3 Department of Medicine, Meyerhoff Inf lammatory Bowel Disease
Center, Johns Hopkins University School of Medicine, Baltimore, MD 21205, USA, 4 Division of Gastroenterology,
Mater Dei Hospital, Msida MSD 2090, Malta, 5 Department of Medicine and Therapeutics, Institute of Digestive
Disease, LKS Institute of Health Science, State Key Laboratory of Digestive Disease, The Chinese University of
Hong Kong, Hong Kong, China, 6 Department of Internal Medicine and Institute of Gastroenterology, Yonsei
University College of Medicine, Seoul, 03722, Republic of Korea, 7 Biobank PopGen and Institute of
Epidemiology, University Hospital Schleswig-Holstein, Campus Kiel, 24105 Kiel, Germany, 8 Department of
Epidemiology, University Medical Center Groningen, 9700 RB Groningen, The Netherlands, 9 Digestive Disease
Research Center, Digestive Disease Research Institute, Tehran University of Medical Sciences, 14117-13135,
Tehran, Iran, 10 Department of Gastroenterology, Dayanand Medical College and Hospital, 141001 Ludhiana,
Punjab, India, 11 Department of Medicine, Dayanand Medical College and Hospital, 141001 Ludhiana, Punjab,
India, 12 Department of Genetics, University of Delhi South Campus, 110021 New Delhi, India, 13 Department of
Medicine, Christian-Albrechts-University of Kiel, 24105 Kiel, Germany, 14 Laboratory for Genotyping
Development, Center for Integrative Medical Sciences, RIKEN Yokohama Institute, Yokohama, 230-0045, Japan,

† The   authors wish it to be known that, in their opinion, the first two authors should be regarded as joint First Authors.
Received: August 9, 2018. Revised: December 17, 2018. Accepted: December 18, 2018
© The Author(s) 2018. Published by Oxford University Press.
This is an Open Access article distributed under the terms of the Creative Commons Attribution Non-Commercial License (http://creativecommons.org/
licenses/by-nc/4.0/), which permits non-commercial re-use, distribution, and reproduction in any medium, provided the original work is properly cited.
For commercial re-use, please contact journals.permissions@oup.com

                                                                                                                                                2078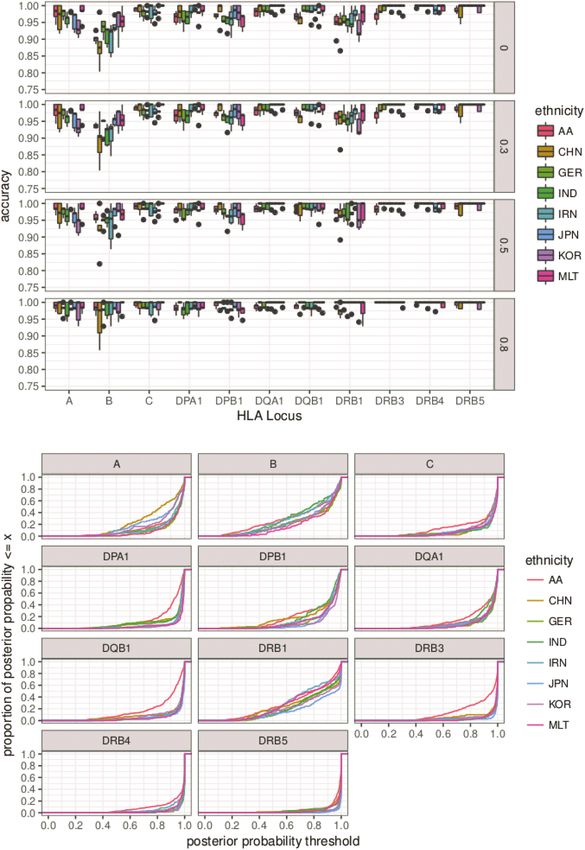
Human Molecular Genetics, 2019, Vol. 28, No. 12             2079

15 Divisionof Genomic Epidemiology and Clinical Trials, Clinical Trials Research Center, Nihon University
School of Medicine, Tokyo, 173-8610, Japan, 16 RIKEN Center for Integrative Medical Sciences, Yokohama
230-0045, Japan, 17 Montreal Heart Institute, Research Center, Montréal, Québec H1T 1C8, Canada, 18 Université
de Montréal Department of Medicine, Montréal, Québec H3C 3J7, Canada, 19 Research Group for Evolutionary
Immunogenomics, Max Planck Institute for Evolutionary Biology, 24306 Plön, Germany, 20 Department of
Epidemiology, Johns Hopkins Bloomberg School of Public Health, Baltimore, MD 21205, USA, 21 Department of
Medicine, Rutgers Robert Wood Johnson Medical School and Department of Genetics, Rutgers University,

                                                                                                                                                            Downloaded from https://academic.oup.com/hmg/article-abstract/28/12/2078/5261434 by MPI Evolutionary Biology user on 10 July 2019
New Brunswick and Piscataway, NJ 08901, USA

*To whom correspondence should be addressed at: Institute of Clinical Molecular Biology, Christian-Albrechts-University of Kiel, Rosalind-Franklin-Street
12, D-24105 Kiel, Germany. Tel: +49 (0) 431/500-15109; Fax: +49 (0) 431/500-15168; E-mail: a.franke@mucosa.de

Abstract
Genotype imputation of the human leukocyte antigen (HLA) region is a cost-effective means to infer classical HLA alleles
from inexpensive and dense SNP array data. In the research setting, imputation helps avoid costs for wet lab-based HLA
typing and thus renders association analyses of the HLA in large cohorts feasible. Yet, most HLA imputation reference
panels target Caucasian ethnicities and multi-ethnic panels are scarce. We compiled a high-quality multi-ethnic reference
panel based on genotypes measured with Illumina’s Immunochip genotyping array and HLA types established using a
high-resolution next generation sequencing approach. Our reference panel includes more than 1,300 samples from
Germany, Malta, China, India, Iran, Japan and Korea and samples of African American ancestry for all classical HLA class I
and II alleles including HLA-DRB3/4/5. Applying extensive cross-validation, we benchmarked the imputation using the HLA
imputation tool HIBAG, our multi-ethnic reference and an independent, previously published data set compiled of
subpopulations of the 1000 Genomes project. We achieved average imputation accuracies higher than 0.924 for the
commonly studied HLA-A, -B, -C, -DQB1 and -DRB1 genes across all ethnicities. We investigated allele-specific imputation
challenges in regard to geographic origin of the samples using sensitivity and specificity measurements as well as allele
frequencies and identified HLA alleles that are challenging to impute for each of the populations separately. In conclusion,
our new multi-ethnic reference data set allows for high resolution HLA imputation of genotypes at all classical HLA class I
and II genes including the HLA-DRB3/4/5 loci based on diverse ancestry populations.

Introduction                                                                   imputation methods and reference panels have been developed
The major histocompatibility complex, in humans also named                     to provide geneticists with a tool to infer HLA alleles at the
human leukocyte antigen (HLA) complex, is a highly variable                    classical loci in silico using inexpensive and dense SNP array
gene cassette with major functions in the immune system.                       data. These have led to significant advances in fine-mapping
The HLA region spans ∼5 Mb on chromosome 6p21 with                             of disease relevant genetic variants for many inflammatory
genomic positions ranging from 29 Mb to 34 Mb. Genes in this                   and autoimmune diseases (3–5). Published and established HLA
region code for proteins that are involved in many complex                     imputation tools are amongst others SNP2HLA, HLA Imputation
functions of the adaptive and innate immune system like                        using attribute BAGging (HIBAG) and HLA∗ IMP (6–8). Imputation
the presentation of peptides to the host immune system                         of the HLA requires reference panels with high coverage of
and also code for proteins that aid peptide presentation or                    alleles and genotypes in the region of interest as well as a broad
antigen recognition. Results from over 10 years of genome-                     spectrum of samples in order to capture as many different
wide association studies (GWAS) support the HLA as one                         alleles as possible. Additionally, the ancestral background of
of the most important disease susceptibility loci for almost                   the reference panel used to impute a data set of interest must
every immune-mediated and autoimmune disease. In many                          be as close as possible to the study population as shown
cases, the strongest association signals are found within the                  for instance by Jia et al. (7). Most HLA imputation reference
highly polymorphic classical HLA genes in the class I and II                   panels target Caucasian ethnicities and although there has
regions, a finding made long before the GWAS era for many                      been progress in the development of ancestrally diverse HLA
of these diseases (1). Therefore, pinpointing the exact genetic                reference panels, studies in which multi-ethnic analyses are
variants in the HLA region, which are associated with these                    performed are still scarce and limited in size (e.g. for chronic
diseases, is of utmost importance to disentangle the underlying                inflammatory diseases, (9)). Several imputation references have
genetic pathophysiology (2). This is complicated by the highly                 been published in the past using various genotyping chips
polymorphic nature of the region, resulting in the need for large              and at different resolutions. All reference panels have sig-
disease cohorts to increase statistical power in the detection of              nificantly advanced HLA imputation and analysis conducted
genetic association. The costs per sample for Sanger- and next                 with the produced data. However, to date, no full context
generation sequencing (NGS)-based HLA typing is still at least                 four-digit multi-ethnic HLA imputation reference panel exists
double that of a genome-wide single nucleotide polymorphism                    for fine mapping of the HLA region across the totality of the
(SNP) array analysis with the new chip platforms. Therefore,                   mentioned loci.
2080 Human Molecular Genetics, 2019, Vol. 28, No. 12
(class I) or exon 2 (class II) were typed only for loci HLA-A,
-B, -C, -DQB1 and -DRB1 but not for HLA-DPA1, -DPB1 and
-DRB3/4/5. However, to the best of our knowledge no custom
G groups were defined (11). Samples did not show population-
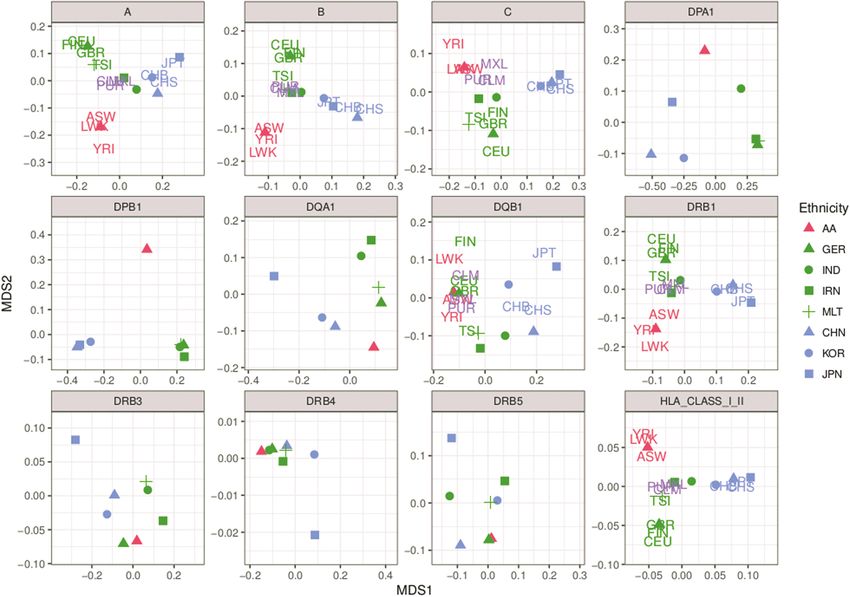
specific clustering for HLA-DQB1, because frequencies of the
HLA alleles in European individuals were similar to those in the
Yoruban, African American and European individuals of the 1000
Genomes population. We did not detect consistent clusters for
the HLA-DRB3/4/5 genes, possibly because there was not enough
Downloaded from https://academic.oup.com/hmg/article-abstract/28/12/2078/5261434 by MPI Evolutionary Biology user on 10 July 2019
variability to allow good clustering results. In our multi-ethnic
data set we only observe four, three and six different four-digit
alleles for the HLA-DRB3/4/5 genes, respectively. In addition,
these genes also included a high percentage of null alleles (HLA-
DRB3, 48.45–81.28%; HLA-DRB4, 65.78–84.52%; HLA-DRB5, 71.28–
85.66%; Table 1) that dominate the frequency spectrum and thus
the MDS analysis. With ‘null allele’ we here refer to the absence
of a locus in a given individual. These null alleles are named
DRB3∗ 00:00, DRB4∗ 00:00 and DRB5∗ 00:00 throughout this paper.
In summary, the MDS analysis reveals significant population
Figure 1. Flowchart of steps taken in preparation and benchmarking of our multi-
heterogeneity for the classical HLA genes and thus, imputation
ethnic reference panel. HLA allele calls were made based on NGS reads. Genotype
tools should be able to account for this heterogeneity by using
information was measured using the Illumina Immunochip. These data were
combined to train a HIBAG imputation model. Benchmarking was performed population-matched and diverse reference panels.
using a 5× cross-validation and the independent, previously published, 1000
Genomes data set (24).
Imputation benchmark
With this study, we aimed to create a comprehensive high-
We performed HLA imputation of the HLA class I loci HLA-A,
quality multi-ethnic HLA reference data set, including HLA-DPA1,
-B, -C and class II loci HLA-DQA1, -DQB1, -DPA1, -DPB1, -DRB1 and
-DPB1 and -DRB3/4/5, using populations of African American,
-DRB3/4/5 using HIBAG and three different constellations: (i) our
East Asian (Japan, South Korea and China), European (Germany,
multi-ethnic reference panel in full four-digit context (Fig. 3 and
Malta) and Middle Eastern (India and Iran) descent.
next paragraph), (ii) our multi-ethnic reference panel combined
We generated HLA allele calls from next generation sequenc-
with the 1000 Genomes data set on G group level (Supplementary
ing (NGS) reads for ulcerative colitis (UC) and control individuals
Material, Fig. S2 and Supplementary Material, Table S1) and (iii)
of each population, using HLAssign (10) and genotype infor-
our multi-ethnic reference panel on G group level as a com-
mation using the Illumina Immunochip SNP array [Illumnina,
parison (Supplementary Material, Fig. S3 and Supplementary
San Diego, CA, USA] (Fig. 1). Using multidimensional scaling
Material, Table S2). We also used the 1000 Genomes panel to test
(MDS) analysis, we analyzed population structure based on HLA
the performance of our data (Table 2) with special focus on the
allele frequencies. The combination of called HLA alleles and
imputation for the non-European population panels, as one of
SNP array genotypes served as training data sets for our new
the main innovations of this work.
multi-ethnic reference using the HLA imputation tool HIBAG
Using a cross-validation approach (Supplementary Material,
(6). We benchmarked the imputation, applying extensive cross-
Fig. S1), we divided the data of each specific population into five
validation on our multi-ethnic reference panel (Supplementary
random subsamples irrespective of case–control status. For each
Material, Fig. S1). The performance of our final model was addi-
of the subsets, using the remaining 80% of the population, as
tionally assessed using the previously published HLA calls of
well as the HLA allele and genotype information of all other
the 1000 Genomes project (11). We also conducted a literature
populations, we trained a HIBAG model. The HLA alleles were
search into the genetic architecture of HLA-DRB3/4/5 in relation
predicted for the 20% of data from the analyzed population that
to HLA-DRB1, as the presence of the HLA-DRB3/4/5 are highly
were not used for training. We calculated accuracies for each of
dependent on which HLA-DRB1 allele is carried by an individ-
the five subsamples of our population of interest and imputa-
ual. These loci are of particular interest, since they represent a
tion accuracies for unrelated individuals of the 1000 Genomes
functional variation that has not been considered in many of the
population. The results of the cross-validation are depicted in
previously published reference data sets and hence have been
Figure 3 and Table 3. Overall accuracies were high with average
largely excluded in association studies.
accuracies ranging from 0.924 in the Chinese to 0.967 in the
Maltese populations (Table 3; Supplementary Material, Table S3).
Results More specifically, high overall accuracies were achieved for the
HLA-C, HLA-DP and HLA-DQ loci whereas the HLA-A, -B and
MDS-based clustering of reference samples on HLA
-DRB1 loci were more challenging to impute across all ethnicities
allele frequencies with accuracies as low as 0.862 for HLA-DRB1 in the Iranian
Using MDS analysis on relative frequencies of single HLA G panel. This is also reflected in the posterior probability curves
grouped alleles across each cohort, we observed distinct clusters depicted in Figure 3b. Posterior probabilities in HIBAG are used as
for individuals with East Asian, African and European back- an additional measure to control prediction accuracies and are
grounds (Fig. 2), except for HLA-DRB3/4/5 and HLA-DQB1. The generated as an average over all classifiers. Low overall posterior
different subpopulations of our multi-ethnic study population probabilities for a locus indicate that the majority of the alleles
cluster well with respective ethnicities of the 1000 Genomes were challenging to impute. Note, that correct calls, e.g. for
population. For the 1000 Genomes population, exons 2 and 3 rare alleles, also tend to have smaller posterior probabilities,Human Molecular Genetics, 2019, Vol. 28, No. 12 2081
Downloaded from https://academic.oup.com/hmg/article-abstract/28/12/2078/5261434 by MPI Evolutionary Biology user on 10 July 2019
Figure 2. MDS analysis of HLA typed allele data: the MDS analysis was performed using a Euclidean distance measure. Alleles with a frequency2082 Human Molecular Genetics, 2019, Vol. 28, No. 12
Downloaded from https://academic.oup.com/hmg/article-abstract/28/12/2078/5261434 by MPI Evolutionary Biology user on 10 July 2019
Figure 3. Imputation accuracies employing the multi-ethnic reference panel: accuracies and post-imputation probabilities of HLA imputation with HIBAG using a
5-fold cross-validation scheme and the multi-ethnic data set with full four-digit allele information. 20% of the data with a specific ethnic background were used
as the validation set after training a model that used 80% of the remaining data and all data from other ethnic backgrounds. We included 1,360 African American
(AA), Hong-Kong Chinese (CHN), German (GER), Indian (IND), Iranian (IRN), Japanese (JPN), South Korean (KOR) and Maltese (MLT) samples in total. (a) Accuracies
are depicted according to post-imputation probabilities with cut-off thresholds at 0 (no confidence filtering), 0.3, 0.5, 0.8 (only high confidence genotypes). Loci are
shown according to alphabetical order. Imputation accuracies are especially high for HLA-C, -DPA1, -DPB1, -DQB1 and the -DRB3/4/5. HLA-DRB1 accuracies are especially
lowered by misclassifications of DRB1∗ 04:03, DRB1∗ 04:04 and DRB1∗ 11:04. (b) Posterior probabilities are depicted as proportion of the number of samples with a posterior
probability smaller than a threshold (x-axis).Human Molecular Genetics, 2019, Vol. 28, No. 12 2083
Table 1. Frequencies of HLA-DRB3/4/5 in our multi-ethnic reference panel: frequencies of HLA-DRB3/4/5 in the typed HLA data for African
American (AA), Hong-Kong Chinese (CHN), German (GER), Indian (IND), Iranian (IRN), Japanese (JPN), South Korean (KOR) and Maltese
(MLT) populations at full four-digit context. Null alleles have the highest frequencies. For HLA-DRB4 mainly one other allele, DRB4∗ 01:03,
exists. DRB5∗ 01:01 is the second most abundant of the HLA-DRB5 alleles in all but the Japanese and Iranian panels, where DRB5∗ 01:02 is
seen more often.
AA CHN GER IND IRN JPN KOR MLT
DRB3∗ 00:00 51.61 64.60 59.88 56.74 48.45 81.28 64.34 55.00
DRB3∗ 01:01 11.13 2.55 14.51 5.32 8.53 4.55 11.07 4.69
Downloaded from https://academic.oup.com/hmg/article-abstract/28/12/2078/5261434 by MPI Evolutionary Biology user on 10 July 2019
DRB3∗ 02:02 27.74 19.34 22.53 32.98 37.98 8.82 16.39 33.75
DRB3∗ 02:24 0.00 0.00 0.62 0.00 0.39 0.00 0.00 0.31
DRB3∗ 03:01 9.52 13.50 2.47 4.96 4.65 5.35 8.20 6.25
DRB4∗ 00:00 84.52 75.91 80.25 80.85 75.97 65.78 68.44 75.63
DRB4∗ 01:01 6.77 0.00 2.47 0.35 1.55 0.00 0.00 3.75
DRB4∗ 01:02 0.00 0.00 0.00 0.00 0.39 2.14 0.41 0.00
DRB4∗ 01:03 8.71 24.09 17.28 18.79 22.09 32.09 31.15 20.31
DRB4∗ 03:01 0.00 0.00 0.00 0.00 0.00 0.00 0.00 0.31
DRB5∗ 00:00 81.94 72.63 80.56 71.28 85.66 71.66 82.38 81.56
DRB5∗ 01:01 15.97 21.53 16.67 15.96 5.43 6.42 11.07 10.00
DRB5∗ 01:02 0.32 1.82 0.62 12.77 6.98 20.59 4.51 3.75
DRB5∗ 01:03 0.00 0.73 0.00 0.00 0.00 0.00 0.00 0.00
DRB5∗ 01:08 0.32 2.19 0.00 0.00 0.00 0.27 0.41 0.00
DRB5∗ 02:02 0.97 0.36 2.16 0.00 1.94 1.07 1.64 4.69
DRB5∗ 02:03 0.00 0.73 0.00 0.00 0.00 0.00 0.00 0.00
DRB5∗ 02:13 0.48 0.00 0.00 0.00 0.00 0.00 0.00 0.00
Table 2. Imputation accuracies for 1000 Genomes populations: population groups are depicted in bold and the subpopulations in italic type.
African (AFR) samples are divided into Americans of African Ancestry in the Southwest USA (ASW), Africans from Kenya (LWK) and Nigeria
(YRI). Admixed American (AMR) samples are split into samples with Columbian (CLM), Mexican (MXL) and Puerto Rican (PUR) ancestry. East
Asians (EAS) were collected as Han Chinese in Beijing (CHB), Southern Han Chinese (CHS) and Japanese in Tokyo (JPT). Samples with European
Ancestry (EUR) are Finnish (FIN), British (GBR), Tuscan (TSI) and samples with Western European Ancestry collected in the CEPH diversity panel
(CEU). Accuracies of HLA-DRB1∗ are HLA-DRB1 measured without DRB1∗ 04:03, DRB1∗ 04:04 and DRB1∗ 11:04, which improved accuracies for all
ethnicities. HLA-A∗ are accuracies measured without A∗ 02:03, which improved accuracies for the Chinese samples. Overall accuracies were
highest for EUR samples and lowest for the non-AMR, for which no samples with similar backgrounds are included in our novel imputation
reference.
#samples A B C DQB1 DRB1 mean A∗ DRB1∗
AFR 162 0.920 0.833 0.932 0.951 0.886 0.904 0.920 0.906
ASW 41 0.939 0.805 0.915 0.939 0.902 0.900 0.939 0.923
LWK 75 0.880 0.853 0.960 0.980 0.893 0.913 0.880 0.899
YRI 46 0.967 0.826 0.902 0.913 0.859 0.893 0.967 0.902
AMR 193 0.909 0.756 0.972 0.984 0.710 0.866 0.909 0.766
CLM 67 0.925 0.709 0.970 0.985 0.687 0.855 0.925 0.711
MXL 56 0.857 0.688 0.973 0.991 0.598 0.821 0.857 0.674
PUR 70 0.936 0.857 0.971 0.979 0.821 0.913 0.936 0.888
EAS 260 0.929 0.931 0.975 0.992 0.940 0.953 0.941 0.951
CHB 82 0.939 0.921 0.988 0.994 0.939 0.956 0.948 0.967
CHS 92 0.935 0.924 0.967 0.995 0.935 0.951 0.963 0.944
JPT 86 0.913 0.948 0.971 0.988 0.948 0.953 0.913 0.943
EUR 322 0.983 0.944 0.994 0.989 0.890 0.960 0.983 0.968
CEU 52 0.981 0.922 0.971 1.000 0.865 0.948 0.981 0.987
FIN 95 0.984 0.974 1.000 0.989 0.926 0.975 0.984 0.959
GBR 86 0.977 0.959 1.000 0.983 0.884 0.960 0.977 0.993
TSI 89 0.989 0.910 0.994 0.989 0.871 0.951 0.989 0.944
present for all imputation references (Table 4). Within the cross- previously published reference panels. These alleles usually
validation framework, accuracies for a gene were calculated as have comparably lower sensitivity or specificity scores and sim-
an average across the different cross-validation runs as it has ilar haplotype structures within the same 2-digit allele groups
been done previously (12,13) and enables better comparison of (Supplementary Material, Tables S7 and S8, Supplementary
these values between studies. We also report median, minimum Material, Tables S5–S8 of Zheng et al., (6)). This is especially
and maximum values in Supplementary Material, Table S3. important in the context of association analyses where the
We report accuracies across all imputed alleles in Table 3, greatest impact from these issues is seen with higher frequency
Supplementary Material, Tables S1 and S2. A few alleles were variants (AF >1%) and thus needs to be considered carefully.
especially challenging to impute, both within our as well as in Note that this also depends on the ethnicity of the samples2084 Human Molecular Genetics, 2019, Vol. 28, No. 12
Table 3. Imputation accuracies of the imputation with the multi-ethnic reference panel: 20% of the data with a specific ethnic background were
used as validation set after training a model with 80% of the remaining data and all data from other ethnic backgrounds. We included 1,360
African American (AA), Hong-Kong Chinese (CHN), German (GER), Indian (IND), Iranian (IRN), Japanese (JPN), South Korean (KOR) and Maltese
(MLT) samples in total in the imputation reference. Shown are mean accuracies of the HLA imputation with HIBAG using a 5-fold cross-validation
scheme and the multi-ethnic data set with full four-digit allele information. The given mean considers only the loci highlighted in bold, as
these are loci also analyzed in all previous publications. Accuracies of HLA-DRB1∗ are HLA-DRB1 measured without DRB1∗ 04:03, DRB1∗ 04:04
and DRB1∗ 11:04, which improves accuracies for all ethnicities. HLA-A∗ are accuracies measured without A∗ 02:03, which improves accuracies
for the Chinese samples. Overall, HLA-B is the most challenging to impute. Mean accuracies are higher than 0.925 across all cross-validation
runs. Best results are achieved for the GER, JPN and MLT populations.
Downloaded from https://academic.oup.com/hmg/article-abstract/28/12/2078/5261434 by MPI Evolutionary Biology user on 10 July 2019
AA CHN GER IND IRN JPN KOR MLT
#samples 312 140 162 143 132 189 122 160
A 0.969 0.900 0.976 0.955 0.973 0.936 0.939 0.984
B 0.877 0.868 0.917 0.875 0.885 0.938 0.934 0.947
C 0.953 0.986 0.975 0.979 0.974 0.973 0.968 0.988
DPA1 0.969 0.979 0.960 0.968 0.985 0.995 0.975 0.988
DPB1 0.925 0.949 0.960 0.944 0.954 0.979 0.963 0.956
DQA1 0.942 0.975 0.975 0.965 0.962 0.968 0.959 0.978
DQB1 0.962 0.964 0.988 0.990 0.981 0.984 0.975 0.984
DRB1 0.925 0.903 0.948 0.924 0.862 0.960 0.918 0.931
DRB3 0.971 1.000 1.000 1.000 1.000 1.000 0.996 0.994
DRB4 0.977 1.000 0.991 0.996 0.996 0.990 1.000 0.988
DRB5 0.987 0.982 1.000 1.000 1.000 1.000 0.992 1.000
mean 0.937 0.924 0.961 0.944 0.935 0.958 0.947 0.967
A∗ 0.969 0.954 0.976 0.954 0.973 0.935 0.937 0.984
DRB1∗ 0.930 0.904 0.954 0.952 0.956 0.968 0.926 0.971
evaluated. We describe A∗ 02:01/A∗ 02:03, DRB1∗ 11:01/DRB1∗ 11:04 with an average accuracy of 0.947 (Table 3). Additionally, we
and DRB1∗ 04:03/DRB1∗ 04:04 below for illustration purposes. imputed the HLA alleles of the East Asian 1000 Genomes data
on G group level (ii) with mean accuracies higher than 0.953
(Table 2).
In comparison, Okada et al. (12), Jia et al. (7), Kim et al. (13) and
African American panel Zheng et al. (6) reported mean accuracies between 0.77 to 0.922
for HLA-A, -B, -C, -DQB1 and -DRB1 (Table 4) for East Asian popu-
The imputation of HLA alleles into our own African American
lations using their respective HLA imputation panels. HLA-DPA1
data set achieved an average imputation accuracy on full context
or HLA-DRB3/4/5 is not considered in any of the publications for
four-digit level of 0.951 across all analyzed loci and of 0.937 on
East Asian ethnicities. For single loci the reported imputation
average for loci HLA-A, -B, -C, -DQB1 and -DRB1 only (Table 3).
accuracies vary between 0.656 (HLA-B with T1DGC reference for
Employing our multi-ethnic reference data set on G group level
Han Chinese in Beijing (CHB) and Japanese samples (JPT); (7)) and
(ii), we were able to impute alleles of the genes HLA-A, -B, -C,
0.984 (HLA-C with a Korean reference panel and the same test
-DQB1 and -DRB1 of the 1000 Genomes African ancestry data with
population; (13)).
a mean accuracy of 0.904 and highest accuracies for the Luhya
In the cross-validation benchmark the accuracy of locus HLA-
Kenyan samples alone (0.880–0.980; mean of 0.913; Table 2). In
A in the Chinese population (Fig. 3a) was decreased due to a
comparison, Zheng et al. (6) imputed HLA alleles of random
misclassification of A∗ 02:03 to A∗ 02:01 in 32% of 37 samples in
subsets of their African American HLARES data combined with
which this allele occurred. This misclassification is due to the
the Yoruba Nigerians (YRI) HapMap samples with a reported
high similarity between these alleles (Supplementary Material,
mean accuracy of 0.818 using their tool HIBAG (Table 4b). Jia
Supplementary Text). When excluding A∗ 02:03 from accuracy
et al. (7) imputed the HLA alleles of YRI HapMap samples using
calculations for HLA-A, accuracies improved for the Chinese
their Caucasian Type 1 Diabetes Genome Consortium (T1DGC)
subpopulation from 0.900 to 0.954 (Table 3).
reference panel with accuracies between 0.203 (HLA-DRB1) and
0.984 (HLA-C) across all loci and an overall mean accuracy of
0.750 (Table 4a).
Iranian and Indian panels
Overall imputation accuracies for our Indian and Iranian panels
over all loci were 0.944 and 0.935, respectively. The accuracies
East Asian panel were high for all loci except HLA-B (0.875 and 0.885, respectively)
Employing our multi-ethnic reference data set (i) to impute and -DRB1 (0.924 and 0.862, respectively) (Table 3).
HLA alleles into our Chinese samples, we achieved accuracies The accuracy of the Iranian samples in the cross-validation
of 0.868 (HLA-B) to 1.000 (HLA-DRB3/4) and of 0.924 on average benchmark (Fig. 3a) at HLA-DRB1 was low due to a misclassi-
for HLA-A, -B, -C, -DQB1 and -DRB1. We imputed HLA alleles fication of DRB1∗ 11:04 to DRB1∗ 11:01 in 39% of the 36 Iranian
into our Japanese samples with accuracies of 0.936 (HLA-A) samples in which this allele occurs (Supplementary Material,
to 1.000 (HLA-DRB3/5) and 0.958 on average for HLA-A, -B, -C, Supplementary Text). When excluding the DRB1∗ 11:04 as well as
-DQB1 and -DRB1. For our Korean samples imputation accu- the DRB1∗ 04:04 and DRB1∗ 04:03 alleles (see below) from accuracy
racies of 0.918 (HLA-DRB1) to 1.000 (HLA-DRB4) were reached, calculations for HLA-DRB1, the accuracies improved from 0.862Human Molecular Genetics, 2019, Vol. 28, No. 12 2085
Table 4. Previously reported imputation accuracies: accuracies measured for HLA reference panels, which are mainly based on Caucasian and
Asian data, with origin of the publications and cohorts used for training and validation as well as a comparison to accuracies achieved with our
own multi-ethnic reference panel (i) in the cross-validation experiment on our own data (see also Table 3) and on the 1000 Genomes cohorts (see
also Table 2). Accuracies of the cross-validation (own) framework and of the imputation into the 1000 Genomes population are shown. Mean
accuracies are calculated across HLA-A, -B, -C, -DPB1 and -DRB1 (loci highlighted in bold). Mean accuracies of the listed reference panels are lower
compared to our own reference panel in the majority of the cases, especially in the non-European population. (a) Accuracies published with
SNP2HLA. The international T1DGC reference panel (7) published along with SNP2HLA was used to gain the accuracies on the 1948 British Birth
Cohort and the HapMap-CEPH Cohort, two European ancestry panels. The T1DGC panel was further used for imputing the Yoruban Nigerian
(YRI), the East Asian Han Chinese from Beijing (CHB) and the Japanese from Tokyo (JPT) samples of the 1000 Genomes data sets. For the East
Downloaded from https://academic.oup.com/hmg/article-abstract/28/12/2078/5261434 by MPI Evolutionary Biology user on 10 July 2019
Asian 1000 Genomes panels accuracies reached by later-published ethnic-specific references (12,13) are also listed. (b) Accuracies published
with HIBAG using the HLARES data from GlaxoSmithKline (GSK) clinical trials of specific ethnic background combined with 1000 Genomes data
sets (6). (c) Accuracies published with HLA∗ IMP:02 using different combinations of the Golden Set (GS = 1948 Birth Cohort/ HapMap CEU and
CEPH CEU+) and the HLARES data as references (8).
(a) SNP2HLA
Source Jia et al. (7) Okada et al. (12) Kim et al. (13)
imputation T1DGC Japanese Korean Korean
reference
# training 5,225 918 330 413
samples
test population 1948 British CEPH YRI CHB & JPT JPT random CHB & JPT
Birth Cohort subset
# test 918 90 not specified not specified 44 83 61
samples
A 0.981 0.991 0.699 0.981 0.908 0.908 0.91
B 0.968 0.968 0.905 0.656 0.943 0.859 0.893
C 0.969 0.991 0.984 0.688 0.989 0.928 0.984
DPA1 / / / / / / /
DPB1 / / / / / 0.95 /
DQA1 / 0.985 0.649 0.963 / / /
DQB1 0.983 0.991 0.961 0.964 0.894 0.937 0.893
DRB1 0.933 0.969 0.203 0.923 0.843 0.868 0.893
DRB3 / / / / / / /
DRB4 / / / / / / /
DRB5 / / / / / / /
mean 0.967 0.983 0.729 0.864 0.915 0.908 0.915
mean A-C, 0.967 0.982 0.75 0.842 0.915 0.9 0.915
DQB1, DRB1
mean A-C, own
DQB1, DRB1
GER 0.961 GER 0.961 AA 0.937 CHN 0.924 CHN 0.924 CHN 0.924 CHN 0.924
MLT 0.967 MLT 0.967 JPN 0.958 JPN 0.958 JPN 0.958 JPN 0.958
KOR 0.947 KOR 0.947 KOR 0.947 KOR 0.947
1000 Genomes
EUR 0.96 EUR 0.96 ASW 0.9 CHB 0.956 CHB 0.956 CHB 0.956 CHB 0.956
LWK 0.913 CHS 0.951 CHS 0.951 CHS 0.951 CHS 0.951
YRI 0.893 JPT 0.953 JPT 0.953 JPT 0.953 JPT 0.953
(b) HIBAG
Source Zheng et al. (6)
imputation HLARES data of Asian HLARES data of African American HLARES data of European
reference ancestry & CHB & JPT Hispanic ancestry HLARES data & ancestry
60 African YRI
# training samples 720 + 90 (minus test) 439 (minus test) 173 + 60 (minus test) 2668 (minus test)
test population random subset random subset random subset random subset
# test samples subset subset subset subset
A 0.921 0.934 0.924 0.982
B 0.875 0.75 0.768 0.966
C 0.966 0.962 0.885 0.988
DPA1 / / / /
(Continued).2086 Human Molecular Genetics, 2019, Vol. 28, No. 12
Table 4. Continued
(b) HIBAG
DPB1 0.898 0.931 0.8 0.947
DQA1 0.868 0.938 0.794 0.964
DQB1 0.96 0.957 0.742 0.992
DRB1 0.887 0.82 0.771 0.921
DRB3 / / / /
DRB4 / / / /
Downloaded from https://academic.oup.com/hmg/article-abstract/28/12/2078/5261434 by MPI Evolutionary Biology user on 10 July 2019
DRB5 / / / /
mean 0.911 0.899 0.812 0.966
mean A-C, DQB1, DRB1 0.922 0.885 0.818 0.97
mean A-C, DQB1, DRB1 own
CHN 0.924 AA 0.937 GER 0.961
JPN 0.958 MLT 0.967
KOR 0.947
1000 Genomes
CHB 0.956 PUR 0.913 ASW 0.9 EUR 0.96
CHS 0.951 LWK 0.913
JPT 0.953 YRI 0.893
(c) HLA∗ IMP:02
Source Dilthey et al. (8)
imputation GS HLARES EU GS & HLARES ALL
reference
# training 1,585 1,758 2,055
samples
test population HLARES_EU random subset African Americans Asians of Europeans of Hispanic of random
of random random subset random subset subset
subset
# test samples 1,060 872 1,008 (all populations)
A 0.96 0.97 0.73 0.79 0.96 0.82
B 0.9 0.95 0.73 0.68 0.95 0.63
C 0.96 0.96 0.97 0.82 0.97 0.92
DPA1 / / / / / /
DPB1 / 0.90 (2-digit) / / / /
DQA1 0.87 0.97 1 0.73 0.96 0.93
DQB1 0.98 0.98 0.87 0.83 0.97 0.97
DRB1 0.88 0.91 0.71 0.72 0.9 0.8
DRB3 / 0.94 (2 digit) / / / /
DRB4 / 0.98 (2 digit) / / / /
DRB5 / 0.99 (2 digit) / / / /
mean 0.93 0.95 0.84 0.76 0.95 0.85
mean A-C, 0.94 0.95 0.8 0.77 0.95 0.83
DQB1, DRB1
mean A-C, own
DQB1, DRB1
GER 0.961 GER 0.961 AA 0.937 CHN 0.924 GER 0.961
MLT 0.967 MLT 0.967 JPN 0.958 MLT 0.967
KOR 0.947
1000 Genomes
EUR 0.96 EUR 0.96 ASW 0.9 CHB 0.956 EUR 0.96 PUR 0.913
LWK 0.913 CHS 0.951
YRI 0.893 JPT 0.953
to 0.956 (Table 3). Mean sensitivity values for DRB1∗ 11:04 for The improvement of the overall accuracy by excluding these
the cross-validation runs were 0.307 for the Iranian popu- alleles in the Indian samples (0.924 to 0.952) was not as big as in
lation and 0.208 for the Indian population (Supplementary the Iranian samples because of the lower allele frequency (AF).
Material, Table S8). The frequency of this allele was 2.82% Previously reported sensitivity values for the DRB1∗ 11 alleles
and 13.85%, respectively (Supplementary Material, Table S5). (Supplementary Material, Tables S5–S8 of Zheng et al. (6)) rangeHuman Molecular Genetics, 2019, Vol. 28, No. 12 2087
from 0.627 (DRB1∗ 11:04) to 0.993 (DRB1∗ 11:01) in the European lyzed loci, with one allele having a smaller number of reads that
population. In this previous study, misclassifications occurred aligned to it. In further six samples we found one of the excep-
for DRB1∗ 11:04, too, which was called as DRB1∗ 11:01 in 93% of tions described in the literature. One Maltese sample did not
cases when a misclassification occurred in European samples have HLA-DRB4 while DRB1∗ 07:01 was present and five African
(6). This is in line with our own results. American samples did not have HLA-DRB5 while DRB1∗ 15:03 or
DRB1∗ 16:02 was present.
Frequencies of HLA-DRB3/4/5 are shown in Table 1. Overall,
Imputation for non-reference populations HLA-DRB3 is the most variable of those genes according to its
The Latin American admixed populations of the 1000 Genomes frequency spectrum, with DRB3∗ 02:02 being the most common
Downloaded from https://academic.oup.com/hmg/article-abstract/28/12/2078/5261434 by MPI Evolutionary Biology user on 10 July 2019
data set (containing Amerindian and European, for Puerto non-null allele with an AF ranging from 8.82% in our Japanese
Rico also West African ancestral admixture, here grouped panel to 37.98% in our Iranian panel. For HLA-DRB4, DRB4∗ 01:03
into Mexican, Columbian and Puerto Rican populations) were is the most common non-null allele with frequencies ranging
imputed with mean accuracies ranging from 0.821 for the from 8.71% in the African American to 32.09% in the Japanese
Mexican, 0.855 for the Columbian to 0.913 for the Puerto Rican panel. DRB5∗ 01:01 is the most common non-null allele in all but
population (Table 2). In particular, HLA-B and -DRB1 showed the Iranian and Japanese panels with frequencies of 5.43% in the
low imputation accuracies (0.688 to 0.857 and 0.598 to 0.821, Iranian to 21.53% in the Chinese panel, while DRB5∗ 01:02 has a
respectively) while all remaining loci had accuracies higher than frequency of 20.59% in the Japanese panel and a frequency of
0.857 (Table 2). Overall, the Puerto Rican data set showed highest 6.98% in the Iranian panel. Our data suggest that DRB1∗ 15:01 is
accuracies and only 40 out of 134 total measured alleles had located on the same haplotype as DRB5∗ 01:01, while DRB1∗ 15:02
sensitivity values of lower than 1.000 (Supplementary Material, (which is very common in Japanese samples) is located on
Table S9). Out of these 40 alleles, 22 have an AF 0.971; Table 3 and Fig. 3a). Sensitivity measures for the HLA-
(Table 2). DRB3/4/5 are generally high; however, for low frequency variants
(e.g. DRB3∗ 02:24 in the Iranian, Maltese and German panels
at frequencies of 1%)
-DQB1 and -DRB1 but only a few studies have reported on the classified with mean sensitivity values of lower than 0.800 (0.375,
imputation of the HLA-DRB3, -DRB4 and -DRB5 (HLA-DRB3/4/5) 0.739, 0.690, respectively). We also observed, using the tool Dis-
loci, such as Dilthey et al. (8), who analyzed HLA-DRB3/4/5 entangler (18), that the phasing of HLA-DRB3/4/5 alleles might
imputation in Caucasian data sets (Table 4c). These genes can present a challenge, with many of the null alleles occurring on
be present or absent in an individual depending on the HLA- haplotypes with HLA-DRB1, when the respective HLA-DRB3/4/5
DRB1 genotype. For the evaluation of the imputation of these allele is present (Supplementary Material, Fig. S4; HLA-DRB3/4/5
genes and to elucidate which HLA-DRB3/4/5 loci are known are excluded here). The analysis of this particular topic, however,
to be located on the same haplotype as a specific HLA-DRB1, is beyond the scope of this paper.
we conducted an extensive literature review and present the
results below. We mainly focus on the information reported
by Holdsworth et al. (14), Robbins et al. (15) and Bontrop et al.
(16). According to literature, alleles of the HLA-DRB3/4/5 loci
Discussion
occur within a specific HLA-DRB1 context, being present in some We compiled three different imputation panels as pre-trained
haplotypes and absent in others. The results of this review are HIBAG models that can be used for HLA imputation in different
summarized in Figure 4. Haplotypes with HLA-DRB1 always carry ethnicities: (i) a multi-ethnic reference with four-digit full
the pseudogene HLA-DRB9, which is located downstream of HLA- context HLA alleles and (ii) a multi-ethnic reference with four-
DRB1 and that consists of two exons (17). DRB1∗ 01, DRB1∗ 08 and digit HLA alleles as G groups. Both panels include HLA-A, -B, -C,
DRB1∗ 10 are not found with any HLA-DRB3/4/5 allele. Haplotypes -DQA1, -DQB1, -DPA1, -DPB1, -DRB1 and -DRB3/4/5 and (iii) a multi-
with DRB1∗ 03, ∗ 11, ∗ 12, ∗ 13 and ∗ 14 are found with HLA-DRB2 ethnic reference panel combined with the 1000 Genomes data
and -DRB3. DRB1∗ 04, ∗ 07, ∗ 09 are found with HLA-DRB4 as well as (including data from HLA-A, -B, -C, -DQB1, -DRB1, -DPA1, -DPB1 at a
-DRB7 and -DRB8. Finally, DRB1∗ 15 and ∗ 16 are reported to be four-digit G group resolution). Our reference panels have high
located on the same haplotype as HLA-DRB5. Exceptions to his accuracy values across different ethnicities and subsets of
rule have been described for DRB1∗ 15 and ∗ 16, where especially the data and also achieve high accuracies in non-reference
in African Americans HLA-DRB5/6 can be missing. DRB1∗ 07 has ethnicities (Tables 2 and 3). The accuracies in non-reference
been reported to occur with a non-expressed form of DRB4∗ 04:01 ethnicities are high, but lower than for our reference data sets,
(15) and DRB1∗ 08 has also been previously identified together as even though our reference is highly diverse the worldwide
with DRB3∗ 03:01 (15). diversity of the HLA is still not sufficiently captured. Average
We investigated our herein-described multi-ethnic data on accuracies of our multi-ethnic reference are larger than 0.924.
HLA-DRB1 and -DRB3/4/5 for congruence with these previous Tabulated results describing the accuracy measures of panels
findings. In short, we determined the HLA-DRB1 alleles for every (ii) and (iii) are presented in Supplementary Material, Tables S1
sample and checked whether we could also find the expected and S2. Using our reference data, few alleles remain challenging
HLA-DRB3/4/5 alleles or the absence of these in the same sample. to impute. This affects alleles of the HLA-DRB1 locus, like the
All but four samples followed the haplotype structures depicted DRB1∗ 11 and DRB1∗ 04 group, which has already been described
in Figure 4. After re-analysis of the remaining four samples we as problematic in previous benchmarks of other imputation
concluded that these samples must have been contaminated, reference panels (6–8) as well as alleles of the highly diverse
since three or more alleles could plausibly be called for all ana- HLA-A and -C genes. We therefore recommend using a two-2088 Human Molecular Genetics, 2019, Vol. 28, No. 12
Downloaded from https://academic.oup.com/hmg/article-abstract/28/12/2078/5261434 by MPI Evolutionary Biology user on 10 July 2019
Figure 4. Known architecture of HLA-DRB3/4/5: HLA haplotypes that usually contain a specific HLA-DRB1 allele (HLA-DRB1 column) are shown. Two-digit alleles are
denoted. All loci are depicted in order of their genomic location. HLA-DRA, HLA-DRB1 and HLA-DRB9 coincide with all haplotypes. The remaining loci are present or
absent depending on the haplotype. The most prevalent haplotypes with the known exceptions are shown in the rows below. Exceptions are sometimes seen for
DRB1∗ 08, DRB1∗ 07, DRB1∗ 15 and DRB1∗ 16. DRB1∗ 08 can occur with HLA-DRB3, DRB1∗ 07 can occur without an expressed form of HLA-DRB4 and DRB1∗ 15 and DRB1∗ 16
can occur without HLA-DRB5/6. Loci that usually occur together are joined by a line. The name of the corresponding serotype is shown on the left and haplotypes are
ordered by serotype name. Information for this figure was retrieved from Bontrop et al., Holdsworth et al. and Robbins et al. (14–16).
digit resolution for these alleles and to consider the imputation representatives from every ethnicity for these efforts. Still, most
difficulties in the interpretation of association results for these genetic research focuses on Caucasian ancestry cohorts and
alleles. We further suggest that the interpretation of specificity neglects large segments of human populations. Decreasing
and sensitivity measures should be done separately by ethnic costs of high-resolution NGS-based HLA typing approaches—
background, since measures can vary between ancestries, including phased data sets from long-read technologies—will
i.e. haplotypes for an allele that are highly predictive in one further fuel the development of more comprehensive and even
ethnicity may not be highly predictive in another ethnicity. more accurate imputation reference panels.
We also verified that SNPs missing in the data set for which
HLA alleles are imputed—and that exist in the reference—
can negatively affect the imputation accuracy. This was the Materials and Methods
case for DRB1∗ 04:03 and DRB1∗ 04:04, where exclusion of 4.4%
of the SNPs used by the HIBAG had a major impact on the Resolution of imputation reference panels
imputation accuracy for these alleles (Supplementary Material, Several imputation references have been published in the past
Supplementary Text). We therefore suggest, as a general rule, using various genotyping chips, allowing for the imputation
to cautiously investigate the coverage of SNPs used by any of different HLA genes at different resolutions, i.e. full context
imputation reference panel prior to imputation with the four-digit (two-field), G group and P group resolution (as defined
respective panel into a data set. Posterior probabilities are by the IMGT/HLA database) or custom groups (mostly before
often used to improve the quality of the data set. Indeed, 2010). Full context four-digit levels provide information on the
we also observe that the accuracies improve when using a gene name, their allele group and the protein sequence of the
posterior probability threshold. However, for some alleles similar HLA molecule (i.e. A∗ 01:02—Gene: A; allele group: 01; protein:
haplotype structures can cause incorrect calls despite high 02). Alleles that are within the same G group have identical
posterior probabilities. Especially for rare alleles, correct calls nucleotide sequences for exons 2 and 3 (HLA class I) or exon
are possible at a very low posterior probability. We therefore 2 only (HLA class II) and may differ in sequence in the other
suggest using the sensitivity and specificity tables we provide exons. Alleles that are within the same P group encode for
in Supplementary Material, Table S8 to perform data filtering as identical amino acid sequences in exons 2 and 3 or exon 2
well as checking the posterior probability. only. P and G group annotations were introduced in 2010 and a
In summary, imputing HLA alleles into multi-ethnic genome- major update in allele naming was conducted (ftp://ftp.ebi.ac.uk/
wide association data sets with our reference panels provides pub/databases/ipd/imgt/hla/Nomenclature_2009.txt), amongst
accurate results and can aid HLA fine mapping studies especially others the separator ‘:’ was introduced and alleles were renamed
in non-Caucasian populations in the future. It allows for HLA especially alleles of the HLA-A, -B, -C and -DPB1 genes. Notably,
imputation using the most recent HLA allele nomenclature at a HLA allele calling conducted before this time, with alleles typed
full context four-digit resolution and a high diversity of different only at exons 2 and 3 or exon 2, may not follow the known G
populations. group and P group conventions published by the IMGT/HLA, i.e.
Nevertheless, larger sample sizes and even more diverse HLA alleles might be grouped in custom groups and some of
reference panels are needed to adequately cover the existing the alleles will carry outdated allele names. This issue should
global HLA polymorphism and frequency spectrum particularly be considered when merging reference panels, such that all
for the ethnicities not included in our panel and also to impute included alleles should map to the same allele groups and
especially rare HLA alleles with high accuracy. DRB1∗ 01:03, for also in benchmarking studies using external data. G grouping
instance, is an allele that has a higher frequency in North published by the IMGT/HLA database is based on the highest
American Caucasians (0.9–1.9%) than European Caucasians resolution that is recorded for an allele (i.e. eight digits or lower).
(∼0.6%) (19). As over a million of samples will have been Note that the post-calling G grouping based on four-digit alleles
genotyped and whole-genome sequenced in the near future, is problematic for some alleles listed in Supplementary Material,
it is just a matter of warranting global coverage, thus to include Table S11.Human Molecular Genetics, 2019, Vol. 28, No. 12 2089
Cohorts & data preparation as DRB3∗ 00:00, DRB4∗ 00:00 and DRB5∗ 00:00 in the following) or
as one functional HLA-DRB3/4/5 allele in combination with two
Multi-ethnic data set. DNA of 96 healthy individuals and 96
of the HLA-DRB3/4/5 null alleles. For a detailed overview we
UC patients were collected from different studies of Chinese,
compiled Figure 4. A total of 312 African American (158 Controls,
German, Indian, Iranian, Japanese, Korean and Maltese popula-
154 UC cases), 162 German (78 Controls, 84 Cases), 140 Chinese
tions that have been published and described elsewhere (20,21).
(68 Controls, 72 Cases), 143 Indian (78 Controls, 65 Cases), 132
In short, Chinese samples were collected in and around Hong
Iranian (63 Controls, 69 Cases), 189 Japanese (96 Controls and
Kong (Chinese University of Hong Kong), Korean samples in
93 Cases), 122 South Korean (81 Controls and 41 Cases) and 160
South Korea (Yonsei University College of Medicine and Asan
Maltese (75 Controls and 85 Cases) samples were available for
Medical Centre, Seoul), Japanese samples in Tokyo (Institute of
Downloaded from https://academic.oup.com/hmg/article-abstract/28/12/2078/5261434 by MPI Evolutionary Biology user on 10 July 2019
construction of HLA imputation models with HIBAG.
Medical Science, University of Tokyo, RIKEN Yokohama Institute
and Japan Biobank), Iranian samples were collected in Tehran
(Tehran University of Medical Science), Indian samples in North 1000 Genomes data set. Using the Phase 3 [version from
India (Dayanand Medical College and Hospital, Ludhiana), 20130502] 1000 Genomes reference data set (24) and Vcftools
all self-reported North Indian which was consistent with (version 0.1.12b), we extracted 174,538 phased SNPs that are
their genetically determined background, German samples in present in both the Phase 3 data set and on the Illumina
North Germany and Maltese samples in Malta (Department of Immunochip used for the main part of our trans-ethnic
Gastroenterology, Mater Dei Hospital, Msida, Malta). In addition data. We then performed quality control as described in the
to the data from the published UC studies, DNA samples were Supplementary Material, Supplementary Methods leaving out
obtained from 192 healthy controls and 192 UC patients, all self- batch and population stratification analyses. HLA data were
reported as African American, which was consistent with their downloaded from ftp://ftp.1000genomes.ebi.ac.uk/vol1/ftp/
genetically determined background as each had an admixture technical/working/20140725_hla_geotypes/. Publicly available
of West African and European ancestry (22). These subjects data from the 1000 Genomes data set do not include HLA-DPA1,
were recruited in the United States of America and Canada -DPB1, -DQA1 and DRB3/4/5 allele calls. In total 162 samples of
by the Johns Hopkins Multicenter African American IBD Study African Ancestry, 193 samples of South American Ancestry, 260
as well as other Genetics Research Centers of the NIDDK IBD samples of East Asian ancestry and 322 samples of European
Genetics Consortium. We also received 192 (96 healthy, 96 UC) ancestry were available for construction of HLA imputation
pre-analyzed Japanese samples directly from RIKEN Yokohama models with HIBAG. The HapMap data used in other studies
Institute. (Table 4) are a part of the 1000 Genomes data set.
High density SNP-array data interrogating a wide proportion
of the extended HLA region were produced for these samples Calling of HLA-DRB3/4/5 alleles. Data were analyzed visually
using the Illumina, Immunochip (all but Malta) with 196,524 using HLAssign (10). HLAssign does not calculate phases of
markers addressing immune relevant genes or the Illumina the HLA alleles and thus does not make hemizygous calls (i.e.
Infimum ImmunoArray 24 (Malta only) with 253,702 markers recognize null alleles) such that HLA-DRB3/4/5 genotypes were
and subjected to strict quality control criteria as described in edited with respect to the HLA-DRB1 allele post calling. For
the Supplementary Material, Supplementary Methods. DNA was consistency with the HLA-DRB3/4/5 with the literature (Fig. 3), we
isolated and processed as described previously (10) in prepara- introduced null alleles DRB3∗ 00:00, DRB4∗ 00:00 or DRB5∗ 00:00
tion for sequencing. Sequencing was performed on an Illumina when the HLA-DRB1 locus was called as DRB1∗ 01, DRB1∗ 08
HiSeq2500 (http://systems.illumina.com) with 100 bp or 125 bp or DRB1∗ 10, respectively. DRB3∗ 00:00 was assigned if no HLA-
paired-end runs on a panel of both case and control data in a DRB3 was present in the corresponding HLA-DRB1 haplotype.
pool of 96 libraries per lane. A total of 192 Japanese samples Equally, DRB4∗ 00:00 and DRB5∗ 00:00 were assigned if haplotypes
were provided by the RIKEN Yokohama Institute and sequenced corresponding to the absence of HLA-DRB4 or -DRB5 were
using 125 bp paired-end runs on the HiSeq2500 with pools of 94 called. Samples with inconclusive HLA-DRB3/4/5 detected during
libraries per lane. Four-digit HLA alleles for all classical HLA I and HLAssign analysis were re-analyzed using HLAReporter (25).
HLA II genes HLA-A, -B, -C, -DQA1, -DQB1, -DPA1, -DPB1, -DRB1 HLAReporter performs de novo assembly on the NGS reads within
as well as -DRB3/4/5 were manually curated and called using the investigated HLA locus using the alignment tool TASR (26)
HLAssign (10). In short, only reads mapping exactly to a reference and compares these to either G groups or full context alleles
based on HLA sequences published with the IMGT/HLA database known in the IMGT/HLA database with the parameters (-m 50,
version 3.27.0 (23) were used for calling, taking into consideration -o 5, -r 0.7, -u 0, -i 1, -t 0, -e 33, -c 0) for on target reads. Contigs
evenness of read mapping, read equality and specific read map- for samples with equal G group predictions were aligned against
ping as described by Wittig et al. (10). We also cautiously looked at each other to generate longer overlapping regions using contigs
cross-mapping events (reads mapping to multiple HLA loci) and with a coverage higher than 15 and then realigned to the known
SNP patterns to identify e.g. alleles originating from concatena- IMGT/HLA reference alleles.
tion of true alleles. In total 1,360 samples were used in this study,
having been sequenced and called successfully based on their
DNA quality and internal HLAssign measures, i.e. sufficiently MDS analysis. Relative allele frequencies were calculated for
large read coverage and also having passed our stringent criteria each allele across the entire multi-ethnic and 1000 Genomes
for the quality control of the Illumina Immunochip array data HLA data within the HLA-A, -B, -C, -DQ and -DR loci. For the
(Supplementary Material, Supplementary Methods). The HLA- MDS analysis alleles with an allele frequency of less than 1%
DRB3/4/5 calls were additionally evaluated for plausibility with in any subpopulation are excluded to avoid a clustering biased
respect to the called HLA-DRB1 genotype. HLA-DRB3/4/5 alleles, by similarity in low frequency variants. The MDS analysis was
according to reported studies (14–16), occur on certain haplo- performed using R and the stats-Package (cmdscale) with a
types in tight linkage with specific HLA-DRB1 variants and can Euclidean distance measure. For the MDS analysis across all loci
either be present or not present at all (i.e. null allele, described we used HLA loci HLA-A, -B, -C, -DQB1 and -DRB1.2090 Human Molecular Genetics, 2019, Vol. 28, No. 12
HLA imputation benchmark ing data of each analyzed population (Supplementary Material,
Fig. S1), using the genomic position as the identifier. HLA calls
Training of the reference panel. We performed HLA imputation
were calculated and stored with their respective posterior prob-
using the published imputation tool HIBAG (6). This is a
abilities. Accuracies and the number of samples to be excluded
machine learning tool implemented in R that employs ensemble
were calculated for different posterior probability thresholds and
classifiers built on bootstrap samples that has been shown to
compared between the different populations.
perform with high accuracy in HLA imputation across multi-
ethnic data sets (6). In short, a training set with both HLA alleles
and SNPs typed in the HLA region on chromosome 6, between 29 Calculation of accuracies. Imputation accuracies were calculated
and 34 Mb, is used to build several classifiers based on bootstrap on best-guess alleles compared with the known alleles of the
Downloaded from https://academic.oup.com/hmg/article-abstract/28/12/2078/5261434 by MPI Evolutionary Biology user on 10 July 2019
samples and a subset of SNPs, similarly to random forest as typed data. Accuracies for best-guess alleles were calculated by
proposed by Breiman et al. (27) that minimize the out-of-bag counting the number of alleles imputed correctly per locus and
errors. Once a model is trained, it can be used as reference dividing by the number of samples multiplied by two. Per locus
to predict HLA alleles from unknown samples using their and per allele accuracies were evaluated. We also calculated sin-
respective SNP genotype information, utilizing the posterior gle allele specificity and sensitivity values if possible. For this we
probability as measure of confidence. For the benchmark, we evaluated each allele separately, counting the number of times
performed a 5× cross-validation using HIBAG (6) and HLA and an allele was predicted correctly as present (True Positive; TP)
SNP genotype data from the following two sources: our multi- or absent (True Negative; TN) and the number of times an allele
ethnic cohort described above and the publicly available 1000 was incorrectly predicted as present (False Positive; FP) or absent
Genomes data set (24). The 1000 Genomes data set was typed (False Negative; FN). We then used the standard definitions to
for HLA-A, -B, -C, -DPB1 and -DRB1, while the multi-ethnic data calculate sensitivity and specificity from these values.
set contained all classical HLA class I and class II loci and
additionally HLA-DRB3/4/5. For the 1000 Genomes data set, Sensitivity = TP/(TP + FN)
typed HLA data were available for samples of the following
ethnicities: African, South American Ancestry, East Asian and Specificity = TN/(TN + FP)
European. We grouped our data into three different data sets:
(i) our multi-ethnic reference containing eight different cohorts Accuracy = (TP + TN)/(TP + TN + FP + FN)
described above, (ii) the same reference as in (i) with HLA alleles
transformed into their respective G groups (G groups combine For the calculation of the accuracy, specificity and sensitivity
alleles with identical exon 2 and 3 (HLA Class I) or exon 2 (HLA values within the cross-validation, the mean values across the
Class II) nucleotide sequence) using hla nom g.txt downloaded different runs were calculated for each locus or allele, as well
from hlaalleles.org date: 2017-07-10, IPD-IMGT/HLA version as median, minimum and maximum values for comparison. To
3.29.0) and (iii) our multi-ethnic panel and the 1000 Genomes establish which alleles might have low sensitivity and specificity
data set combined. In total we used 1,360 samples and 7,428 values in a general setting for (i), we calculated these measures
SNPs within the HLA region for the multi-ethnic reference, as using a model based on the entire population (i).
well as 937 samples from the 1000 Genomes data and 7,551
SNPs within the HLA region from the 1000 Genomes data set,
with 2,297 samples and 7,126 SNPs for the combined data set as Imputation reference panels for comparison
well as their respective HLA calls. For the 1000 Genomes panel,
A Caucasian reference panel based on genotypes retrieved from
we checked for nomenclature issues, making sure that all of
the T1DGC (29), as well as a Pan Asian data set (30) using
the HLA alleles used in the 1000 Genomes panel mapped to the
three different Asian populations, were published along with
nomenclature for HLA alleles used since April 2010 (ftp://ftp.ebi.
SNP2HLA (7) and are available on request from the SNP2HLA
ac.uk/pub/databases/ipd/imgt/hla/Nomenclature_2009.txt). For
authors. Here, loci HLA-A, -B, -C, -DQA1, -DQB1, -DPB1 and -DRB1
alleles with unambiguous G groups (Supplementary Material,
were typed (Table 4a). Two additional Asian reference panels
Table S11), we assigned the lower number allele for reference
based on SNP2HLA were published at a four-digit resolution.
panels (ii) and (iii). Genotype data were prepared as described in
First, a Korean reference panel was published in 2014 (13) for the
Supplementary Material, Supplementary Methods. Samples
imputation of amino acids and HLA alleles into East Asian pop-
with typed HLA information were extracted from each quality-
ulations for HLA-A, -B, -C, -DQB1, -DPB1 and -DRB1 and second,
controlled, genotyped data set. The different cohorts were
a Japanese reference data set was published in 2015 by Okada
merged and those SNPs with a consistent minor allele frequency
et al. (12) with an evaluation of loci HLA-A, -B, -C, -DQB1 and
(MAF) ofYou can also read