A SMALL SCALE CLEW ANALYSIS OF THE CAPE TOWN REGION - DIVA
←
→
Page content transcription
If your browser does not render page correctly, please read the page content below
A Small Scale CLEW Analysis of the
        Cape Town Region

Estimating the Effects of Climate Change on the
                Water Provision

                    Lydia Petschelt

                   Master of Science Thesis
       KTH School of Industrial Engineering and Management
             Energy Technology EGI-2013-063MSC
               Division of Energy System Analysis
                      SE - 100 44 Stockholm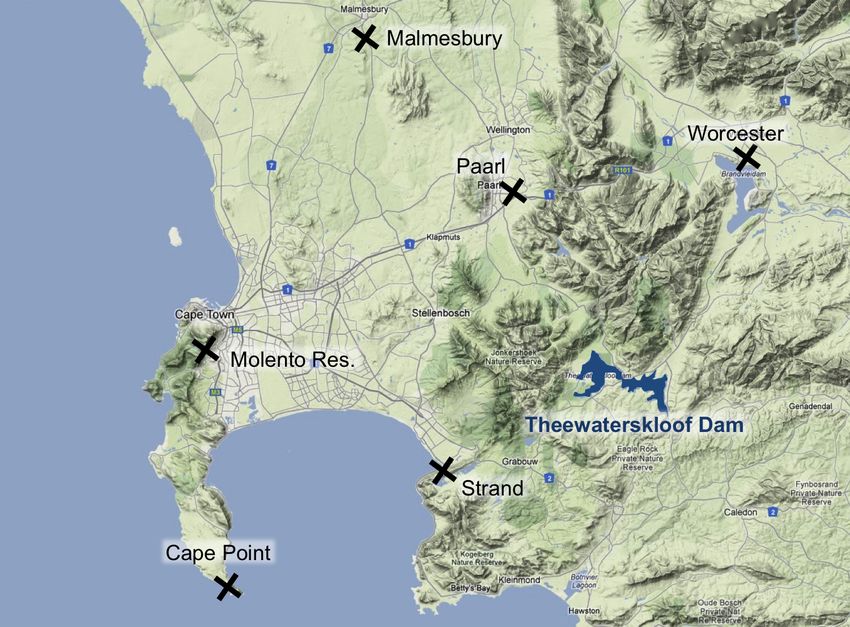
A Small Scale CLEW Analysis of the Cape Town Region I
Master
of
Science
Thesis
EGI-‐2013-‐063MSC
A
S mall
S cale
C LEW
A nalysis
o f
the
C ape
T own
Region
Estimating
the
Effects
of
Climate
Change
on
the
Water
Provision
Lydia
Petschelt
Approved
Examiner
Supervisor
2013/09/24
Mark
Howells
Sebastian
Hermann
Abstract
The knowledge of the influences climate change can have on a regional scale is still
very limited. Generally it is known that the climate, land use, energy and water
resources are intertwined. The CLEW strategy focuses on an approach to quantify
these interrelations. In South Africa, experiencing a fast development, water
resources are vital for a continuous prosperous growth. Through a methodological
approach the local impacts of climate change on water supply and demand for the
City of Cape Town are analysed. The focus lies on the Theewaterskloof Dam in the
Riviersonderend catchment. For this study, the future climate data are generated in
MarkSim for different SRES scenarios. Using the Water Evaluation And Planning
system simulation software WEAP the catchment of interest is modelled to estimate
future variation in water availability. For all scenarios the findings are consistent with
prior studies forecasting an increase in the annual mean temperatures and a
decrease in the annual precipitation. The reduction in annual precipitation
consequently leads to a decreased water availability in the Riviersonderend
catchment. Despite of the fact that the water resources are likely to diminish, the
fixed annual water demand supplied by the Theewaterskloof reservoir is expected to
be covered in the future without limitations.
Keywords: City of Cape Town, CLEW, climate change, local scale, precipitation,
water availability, WCWSS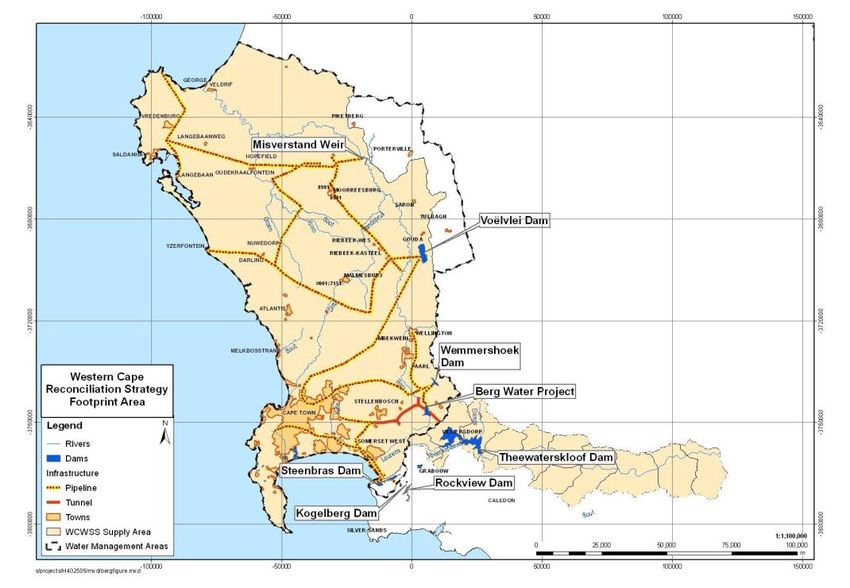
A Small Scale CLEW Analysis of the Cape Town Region                                                                 II

Table of Contents

A
   Index of Figures................................................................................ III

B
   Index of Tables ................................................................................. V

C
   Nomenclature .................................................................................. VI

1
   Introduction ........................................................................................ 1

  1.1
   Objectives............................................................................................. 1

2
   Background........................................................................................ 2

  2.1
   The City of Cape Town......................................................................... 2

     2.1.1
   Historical Demand .......................................................................... 3

     2.1.2
   Future Demand .............................................................................. 5

  2.2
   Historical Supply................................................................................... 6

  2.3
   Future Supply ....................................................................................... 8

  2.4
   Historical Climate ............................................................................... 10

  2.5
   Future Climate .................................................................................... 12

3
   Methodology .................................................................................... 13

  3.1
   WEAP ................................................................................................. 13

     3.1.1
   Sub-Catchment Data ................................................................... 14

     3.1.2
   River Data .................................................................................... 16

     3.1.3
   Reservoir Data ............................................................................. 16

     3.1.4
   Demand CCT Data ...................................................................... 16

     3.1.5
   Demand Berg WMA and Others Data .......................................... 17

     3.1.6
   Gauge Data .................................................................................. 17

  3.2
   MarkSim ............................................................................................. 17

     3.2.1
   Future Emission Scenarios .......................................................... 17

     3.2.2
   Application ................................................................................... 18

  3.3
   Limitations .......................................................................................... 19

4
   Results and Discussion ................................................................... 21

  4.1
   Future Climate .................................................................................... 21

     4.1.1
   Adapted Future Climate ............................................................... 22

  4.2
   Water Supply and Demand ................................................................ 26

     4.2.1
   Sensitivity Analysis of the CCT Demand ..................................... 31

5
   Conclusion ....................................................................................... 35

D
   References ..................................................................................... VII

E
   Appendix ......................................................................................... IX
A Index of Figures III
A Index of Figures
Figure 2.1: Mismatch between Supply and Demand in the CCT 2003
(H6R001) ....................................................................................... 2
Figure 2.2: Western Cape Water Supply System (CCT, 2012) ......................... 3
Figure 2.3: Historical Population Trend in Greater Cape Town 1970-2001
(South Africa. DWAF, 2007b) .......................................................... 4
Figure 2.4: Historical Annual Water Demand for the CCT 1971-2004
(Ogutu, 2007) .................................................................................. 4
Figure 2.5: Distribution of Urban Water Demand ............................................. 5
Figure 2.6: Historical Population Trend and Projections for Cape Town
1996-2031 (CCT, 2012c) ................................................................ 5
Figure 2.7: Historical Annual Water Demand and Future Projections (South
Africa. DWAF, 2007b) ..................................................................... 6
Figure 2.8: Storage within the WCWSS (South Africa. DWAF, 2009d) .............. 7
Figure 2.9: Riviersonderend Catchment with its Gauges (South Africa.
DWAF, 2009c) ................................................................................ 8
Figure 2.10: Reconciliation of Supply and Requirements for the 2011
Reference Scenario ....................................................................... 9
Figure 2.11: Precipitation at the TWK Dam and Temperature of the CCT
Region for the Year 2003 ............................................................ 10
Figure 2.12: Historical Precipitation at the Theewaterskloof Dam for the
Period 1970 to 2004 .................................................................... 11
Figure 2.13: Historical Temperature Measurements for the Period 1970 to
2004............................................................................................. 11
Figure 3.1: Flowchart of Methodological Approach ........................................ 13
Figure 3.2: WEAP Model of Riviersonderend Catchment .............................. 14
Figure 3.3: Weather Stations near the City of Cape Town ............................. 15
Figure 3.4: Precipitation Runs at Sonderend Mountain Location for
Scenario A2 from MarkSim.......................................................... 20
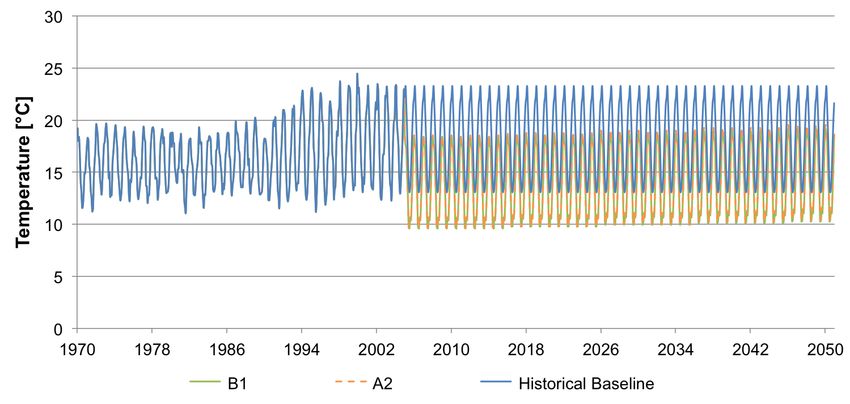
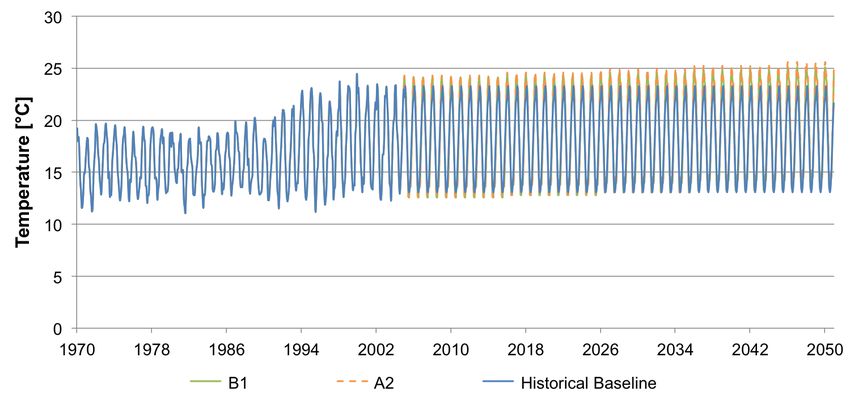
Figure 4.1: Monthly Temperature Trend for Sub-Catchment TWK ................ 21
Figure 4.2: Annual Precipitation Trend for Riviersonderend Catchment ........ 22
A Index of Figures IV
Figure 4.3: Monthly Temperature Trend with Adapted Data for Sub-
Catchment TWK .......................................................................... 23
Figure 4.4: Monthly Averaged Temperatures for the Period 2005-2050 ........ 24
Figure 4.5: Annual Precipitation Trend with Adapted Data for
Riviersonderend Catchment ........................................................ 24
Figure 4.6: Annual Precipitation Trend for the Period 2005-2050 for
Riviersonderend Catchment ........................................................ 25
Figure 4.7: Monthly Averaged Precipitation for the Period 2005-2050 for
Riviersonderend Catchment ........................................................ 25
Figure 4.8: Annual Runoff Flow for Riviersonderend Catchment ................... 26
Figure 4.9: Annual Runoff Flow for the Period 2005-2050 for
Riviersonderend Catchment ........................................................ 27
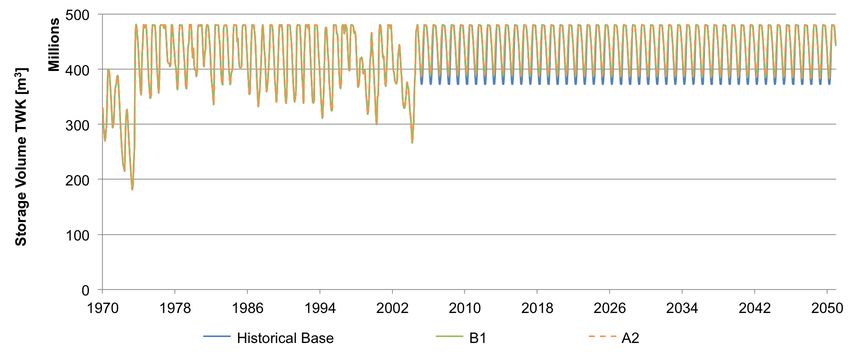
Figure 4.10: Comparison of Storage Volume of the TWK Dam for the
Period 1970-2004 ........................................................................ 27
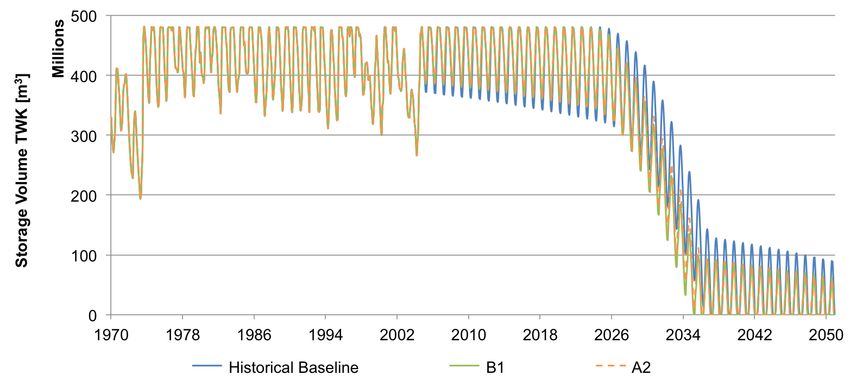
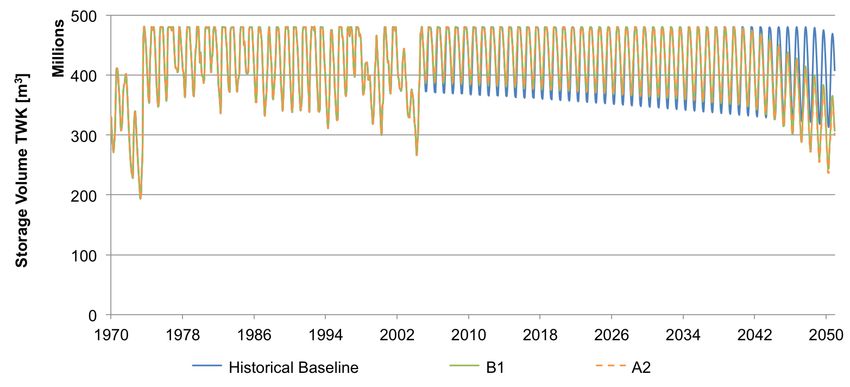
Figure 4.11: Monthly Storage Volume of the TWK Dam ................................ 28
Figure 4.12: Monthly Averaged Storage Volume for the Period 2005-2050 .. 28
Figure 4.13: TWK Dam’s Inflows and Outflows for Scenario A2 .................... 29
Figure 4.14: Supply-Demand-Coverage for Riviersonderend Catchment...... 30
Figure 4.15: Percent of Time Exceeded Demand Coverage ......................... 31
Figure 4.16: Low and High Growth Rates for the CCT Demand .................... 32
Figure 4.17: Monthly Storage Volume of the TWK Dam for the Low Growth
Rate ............................................................................................. 32
Figure 4.18: Monthly Storage Volume of the TWK Dam for the High Growth
Rate ............................................................................................. 33
Figure 4.19: Supply-Demand-Coverage for Riviersonderend Catchment for
Low Growth Rate ......................................................................... 33
Figure 4.20: Supply-Demand-Coverage for Riviersonderend Catchment for
Low Growth Rate ......................................................................... 34
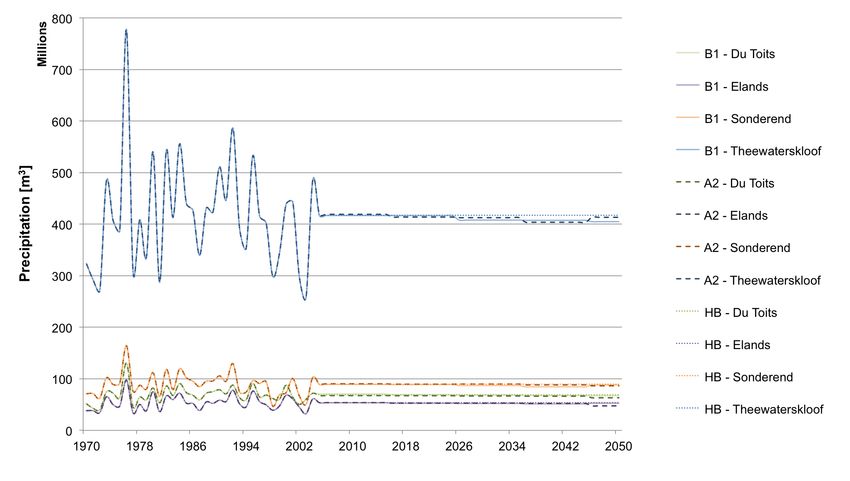
Figure E.1: Annual Precipitation for Each Sub-Catchment .............................. X
Figure E.2: TWK Dam’s Inflows and Outflows for Scenario B1 ...................... XI
Figure E.3: TWK Dam’s Inflows and Outflows for Scenario HB ...................... XI
B Index of Tables                                                                                 V

B         Index of Tables

Table 2.1: Major storage dams of the WCWSS (South Africa. DWAF, 2011a) .. 3

Table 2.2: Cape Town’s allocation form the WCWSS (CCT, 2012) .................. 7

Table 2.3: Intervention Options for the Reference Scenario ............................ 9

Table 3.1: Gauged Sub-Catchments in Riviersonderend Catchment ............ 15

Table 3.2: General Circulation Models used in MarkSim ............................... 19

Table 4.1: Correcting Factors for MarkSim .................................................... 22


Table E.1: Weather Generation Locations for MarkSim .................................. IX
C Nomenclature                                               VI

C       Nomenclature

BWAAS            Berg Water Availability Assessment Study
CCT              City of Cape Town
CLEW             Climate, Land Use, Energy, Water
CMA              Catchment Management Area
DWAF             Department of Water Affairs and Forestry
GCM              General Circulation Model
IPCC             Intergovernmental Panel on Climate Change
MAP              Mean Annual Precipitation
SRES             Special Report on Emission Scenarios
TWK              Theewaterskloof
WCWSS            Western Cape Water Supply System
WMA              Water Management Area
1 Introduction                                                                        1

1        Introduction

Today a vast majority of the scientific community agrees on the impact human
activities have on climate change. The following changes over time are not the same
all over the world, but depend on local conditions. As global climate models are very
complex and require manifold information, their resolution does not yet allow a more
locally oriented forecast. Therefore there is only little knowledge of the impact on
local climate.
The human impact on climate change is affected by the use of the world’s resources
of land, energy and water. The use of one of these resources not only affects its own
demand, but also that of the others. Moreover the climate itself has an effect on
these resources. The CLEW strategy, standing for Climate, Land-use, Energy and
Water, is an approach to develop quantified interrelations between these resources.
This approach was developed to support future guidance of human activities and
decision making, in order to lower their impact on climate change. In the past policies
where designed considering only issues of these resources. The unanticipated
adverse effects a strictly energy or land or water policy could have on the other
resources respectively were often kept unnoticed. The aim of a CLEW analysis
therefore is a system approach that considers these interdependencies.
In countries with high development like South Africa, the resource water, next to
energy, is essential for life and progress. Especially in fast growing urban areas the
provision of water is an inevitable issue requiring special attention.
As the climate is strongly intertwined with water resources, it is of utmost importance
to study the interrelations to forecast possible impacts of climate change on water
supply. Obvious examples are drought and heat waves followed by water shortages.
This particularly affects the surface and atmospheric water resources, representing
just 0,1% of global water (Moore, 1989). This water resource however is the main
supplier of the bulk water in the Western Cape (CCT, 2012).
The special focus of this study lies in the provision of a methodological approach to
assess the local impacts of climate change. The linkage between climate, water
supply and demand for the City of Cape Town (CCT) are reviewed. A site-specific
investigation on a storage dam, analysing impacts of climate change on water
resources, is conducted.

1.1      Objectives
The aim of this thesis project is to investigate the interrelation of CLEW in the south-
western region of South Africa, focusing on the City of Cape Town. The climate
dependency of the water supply and availability of the area is to be analysed by
focusing on potential impacts of climate change on reservoirs and dams in the target
region.
First a review of study objects will be conducted to determine the best suited site to
be investigated. A dam and reservoir having a significant contribution to the water
supply of CCT will be selected. In a second step a data collection and evaluation is to
be performed. Herby the focus lies on historical and future demand data and
historical supply data. Using the Water Evaluation And Planning system simulation
software (WEAP) a link between this collection of data and historical climate data of
precipitation and temperature is modelled. This step uses the determination of the
historical trends as a baseline for future forecasts. Next future climate scenarios will
be projected for the target region using the climate downscaling tool MarkSim. Future
projections on water supply as well as likely changes in the availability are to be
presented in the fourth and final step.
2 Background                                                                              2

2        Background

2.1      The City of Cape Town
The City of Cape Town is located in the Western Cape Province of South Africa.
Cape Town’s topography is mainly characterized by flat plains, known as Cape Flats,
as well as hills and mountains. The rivers and the water storage capacity of CCT
itself are comparatively small. Only 13% of the supplied water comes from sources
within municipal boundaries (CCT, 2012). Therefore most of the water supply has to
be delivered from outside of the catchment management area (CMA) of CCT.
Additionally to the Sonderend and Palmiet rivers, the Berg River and its tributaries
are the main suppliers.
The annual precipitation in the City of Cape Town is averaged to 515 mm per year,
its mean temperature amounts to 16,7 °C. In the CMA of CCT the precipitation
mainly takes place during winter months. In summer, when the water demand is the
highest, the lowest runoff is available (cf. Figure 2.1). This mismatch requires a bulk
water supply system to ensure the water provision to CCT during the normally dry
summers by means of stored water from the winter precipitation period. (CCT, 2008)

Figure 2.1: Mismatch between Supply and Demand in the CCT 2003 (H6R001)

The City of Cape Town is supplied with water by the Western Cape Water Supply
System (WCWSS). There are four water management areas (WMA) contributing to
this system. These are Breede, Gouritz, Olifants/Doorn and Berg WMA. The water of
the first three WMAs is mainly used for agricultural irrigation purposes, the water
form the Berg WMA for both the urban and agricultural sector. As the ground water
supply in the area is very scarce, surface water sources cover 98,5 % of the water in
the WCWSS (CCT, 2012). A network of six major dams interlinked by tunnels and
pipelines try to minimize spillage (cf. Figure 2.2). Notice that the major dams are
situated to the east of the City of Cape Town in the Cape Fold Mountains (CSIR,
2010).
pipelines, supplies water to Cape Town, neighboring towns and urban areas and agriculture.
The various components of the WCWSS are owned and operated by the City, the
2Department
  Background of Water Affairs and Eskom. The WCWSS is shown in Figure 1.                   3

Figure 2.2: Western Cape Water Supply System (CCT, 2012)

The  dams
 Figure    are owned
        1: Western    byWater
                   Cape  the CCT   andSystem
                              Supply    the Department
                                               (WCWSS) of Water Affairs and Forestry
(DWAF). A list of the dams, their capacity and the owners can be found in Table 2.1
below. In total the WCWSS provides 905,017 Mm3 of storage capacity. The City of
Cape Town allocates 72 % of the annual yield of 556 Mm3 of the WCWSS (CCT,
2012). The remainder is used for agricultural purposes and other urban areas.
Table 2.1: Major storage dams of the WCWSS (South Africa. DWAF, 2011a)

               Major Dams                  Capacity                      Owner
                                            [Mm3]                         [-]
         Theewaterskloof                             480,4               DWAF              2.149
         Voëlvlei                                    168,0               DWAF
         Berg River Dam                              130,0               DWAF
         Wemmershoek                                  58,6                CCT
         Steenbras Lower                              36,2                CCT
         Steenbras Upper                              31,8                CCT

2.1.1     Historical Demand
A study on future water requirements by the DWAF uncovered a strong correlation
between population growth, economic growth and water demand for the City of Cape
Town (South Africa. DWAF, 2007b). The population has been growing continuously
since 1970, more intensely in recent years. This trend is visible in Figure 2.3. In 1970
1,9 million people lived in the greater Cape Town area. In 2001 this number has
more than doubled to 4,5 million inhabitants.
2 Background 4 Figure 2.3: Historical Population Trend in Greater Cape Town 1970-2001 (South Africa. DWAF, 2007b) The water demand of the City of Cape Town has also increased steadily since the 1970’s. While in the year 1971 the City’s demand was 89 Mm3, in the year 2000 it rose to 321 Mm3. This corresponds to an increase of more than 3,5 times during that time period of thirty years. The development of the historical water demand can also be seen in Figure 2.4. Figure 2.4: Historical Annual Water Demand for the CCT 1971-2004 (Ogutu, 2007) In the past, the water supply did not always cover the required urban demand. To eliminate these shortages, regulations had to be introduced to reduce the demand. To decide on constraints the WCWSS is assessed at the end of each year. As an example, from the year 2000 to 2001 a policy was implemented requiring reduction of demand of 10 %. This reduction of water demand as consequence of the restriction is also visible in Figure 2.4. From 2004 to 2005 an even greater reduction of 20 % was necessary. (South Africa. DWAF, 2007b) When analysing the sectoral distribution of the urban water demand for the City of Cape Town, it becomes apparent that the residential sector is the driving force with a
2 Background 5
demand of 60 to 70 %. Compared to that the commercial and industrial sectors both
only have a share of 15 to 18 % of the demand. This distribution is displayed in
Figure 2.5. (Ahjum, 2012)
3 DRIVERS OF URBAN GROWTH 3.1.1 Urbanisation
Population growth
Cape Town is experiencing rapid urbanisation as a result of both
3.1 Key drivers of urban growth in Cape Town natural growth and in-migration. The city’s population expanded
by 36,4% between 1999 and 2007,1 and growth in 2010 was
As a fast-growing metropolitan area in South Africa, Cape Town
estimated at 3% per annum.2 Similar to other metropolitan cities
is faced with a number of developmental challenges and trends,
in South Africa, it is expected that urbanisation will remain an
which inform the way the city grows and functions. These
important trend for a number of years. The city’s population is
challenges and trends can be best understood by examining
expected to continue to grow significantly each year, both from
the key drivers of future growth and development in the city –
natural growth (although at a slower rate, with fertility levels
urbanisation and economic growth – as well as the influences
declining) as well as from in-migration. The largest unknown
and constraints imposed by the natural environment. This section
variable in future growth projections is the nature and extent
will examine these key drivers and constraints, the main trends
of in-migration, both internal and transnational. The estimated
underpinning each of them, and their implications for spatial
population for Cape Town in 2010 is 3,7 million;3 this could
forward planning. It should be noted that a shift in any of these
increase to close to five million people by 2030. Figure 3.1
implies a different future growth scenario. Therefore, the section
illustrates different population growth scenarios as projected by
concludes with various future growth scenarios based on changes
Figure 2.5: Distribution of Urban Water Demand the ‘Dorrington reports’.4
in the key drivers behind growth, as well as their implications for
spatial planning.
Urbanisation is a positive global phenomenon that allows for the
development of productive, urban-based, modern economies, and
2.1.2 Future Demand is associated with sustained improvements in standards of living.
However, it also brings challenges such as congestion, crime,
As established above, the historical development indicates
informality and towards
inadequate living conditions.a Itcorrelation
is thus important
1 between theOverview
City of Cape Town (2011) increase ofSocio-economic
of Demographic and urbanCharacteristics
waterof demand that theand theaspects
negative population
of urbanisationand economic
are managed while the
growth. With
Cape Town, Strategic continuous
Development urbanization takingbenefits
Information and GIS Department. place in the
of urban living City ofgreater
(including Cape Town
economic, and
educational,
2 Ibid. health, social and cultural opportunities) are maximised and
3
expected
Ibid.
to intensify in the upcoming years, this correlation is the basis for many
future made accessible to all communities. If planned for and managed,
4 Dorrington, Rwater demand
(2005) Projection of the Populationprojections for the
of the City of Cape Town 2001–2021 and City of Cape Town.
Dorrington, R (2000) Projection of the Population of the Cape Metropolitan Area 1996–2031. urbanisation can contribute towards the building of an
5 InCity Figure 2.6
of Cape Town (2011) the
Overview historical
of Demographic population
and Socio-economic Characteristics of development is presented
economically, environmentally by the
and socially redcity.
sustainable line.
Different
Cape Town, Strategicforecasting scenarios
Development Information and GIS Department. by Dorrington from his studies from 1999 and 2005
are also presented (Dorrington, 2005). While the forecast made in 1999 did not depict
the actual population development over the recent years, the trends estimated in
2005 picture the actual development much closer. It can be deduced that the high
trend 5forecast
400
from 2005 presents the most accurate predication of future population
development.
5 200
5 000
4 800
4 600
4 400
POPULATION (thousands)
4 200
4 000
3 800
3 600
3 400
3 200
3 000
2 800
2 600
2 400
1996 2000 2004 2008 2012 2016 2020 2024 2028 2032
Dorrington 1999 - high Dorrington 1999 - medium Dorrington 2005 - high Dorrington 2005 - medium Population
Figure 2.6: Historical Population Trend and Projections for Cape Town 1996-2031 (CCT, 2012c)
Figure 3.1: Cape Town population trends and projections:
1996–20315
CTSDF STATUTORY REPORT 2012 182 Background 6
Figure 2.7 shows the historical water demand and the future projections based on
Dorrington’s different population forecasts as well as projected economic
developments. While the projections from baseline year 2003 are very optimistic, not
taking in consideration possible restrictions, the projections from 2006 indicate a
more realistic approach since the restrictions 2004 to 2005 are considered. The low
trend water demand (low economic, low population) results in a growth rate of 1,43%
per year starting from the base year 2006. As the population seems to be following
the
Determination highWater
of Future trend scenario (cf. Figure 2.6), it bases the assumption, that the water
Requirements 15
demand for the CCT will most likely follow the high trend line (high economic, high
population) from the base year 2006. For this scenario the resulting average growth
Town. It was therefore considered appropriate to use 2003 as the base year for the high water
rate of water requirements per year from 2006 until 2030 is estimated to 3,09%.
requirement scenario and 2006 for the low water requirement scenario.
(South Africa. DWAF, 2007b)
800
Actual
2003 baseline (low eco, low population)
700 2003 baseline (high eco, high population)
2006 baseline (low eco, low population)
2006 baseline (high eco, high population)
Annual Water Demand (million m^3 per annum)
600
500
400
300
200
100
0
72
74
76
78
80
82
84
86
88
90
92
94
96
98
00
02
04
06
08
10
12
14
16
18
20
22
24
26
28
30
19
19
19
19
19
19
19
19
19
19
19
19
19
19
20
20
20
20
20
20
20
20
20
20
20
20
20
20
20
20
Figure 3.4 Historical
Figure 2.7: Sensitivity of theDemand
Annual Water forecastand
to the choice
Future of base
Projections yearAfrica. DWAF, 2007b)
(South
Even when considering the lowest estimation scenario (low population growth, slow
economic growth) the water Trends demand forandthe
in base CCTdemands
seasonal is expected to exceed the available
supply by 2020 (South Africa. DWAF, 2007c). With the very likely higher water
350000 0.5
requirement growth rates, a guarantied water supply will be given for an even shorter
period.
300000 Additionally, studies foresee that the consequences ofdemand
the climate
45Mcm/a reduction - about 13% of
domestic change
0.45
will
Ratio of seasonal to total demand
46 Mcm/a
stress the availability of water supply even further (Western Cape.reduction DEADP,0.4 2011;
Lumsden
250000
et al., 2011). 0.35
Khayalitsha & Ikapa projects (14.5Mm3/a)
Demand (Ml)
0.3
200000
2.2 Historical Supply 0.25
150000
0.2
The 100000
Western Cape Water Supply System (WCWSS),
Urban growth in drier Northern Suburbs &
the interlinked network
22Mcm/a reduction (50% of total)
0.15 of
reservoirs that provides
Restrictions in early '70s the City of Cape Town with water, consists of six0.1 major
installation of automated irrigation systems
dams.50000
It is designed to minimize spillage losses. The main provider to the WCWSS
25Mcm/a reduction (54% of total) 0.05
is the Theewaterskloof
0
(TWK) dam on the Sonderend river in the Breede WMA.
0
As
shown in Figure 2.8, the dam provides 53% of the bulk storage of the WCWSS.
71
72
73
74
75
76
77
78
79
80
81
82
83
84
85
86
87
88
89
90
91
92
93
94
95
96
97
98
99
00
01
02
03
04
05
06
19
19
19
19
19
19
19
19
19
19
19
19
19
19
19
19
19
19
19
19
19
19
19
19
19
19
19
19
19
20
20
20
20
20
20
20
Year
Basedemand Seasonal demand Total demand (from Prev Nov) Ratio of Seasonal to base
Figure 3.5 Trends in seasonal demand
It must be noted that predicting future water requirements from 1999/2000 is complicated by the fact that
water restrictions were imposed in 2000/2001 and then again in 2003/2004. In parallel to this, the City
continued to implement water demand management initiatives. Future water requirements should be
monitored and the base year for projections revised when better data is available and the imposition of
water restrictions lifted.2 Background 7
Figure 2.8: Storage within the WCWSS (South Africa. DWAF, 2009d)
The TWK dam is the most significant contributor not only to the WCWSS itself, but
also when considering the surface water supply for the CCT. As can be seen in
Table 2.2, the TWK dam provides 29,6% of the total allocation of the CCT. These
facts qualify the Theewaterskloof dam as the subject for further investigations in this
study.
Table 2.2: Cape Town’s allocation form the WCWSS (CCT, 2012)
Water Supply Share of Total
[Mm3/a] [%]
Theewaterskloof 118,0 29,6
Völvlei 70,4 17,7
Palmiet 22,5 5,6
Berg River 81,0 20,3
Wemmershoek 54,0 13,5
Steenbras 40,0 10,0
Others 12,8 3,3
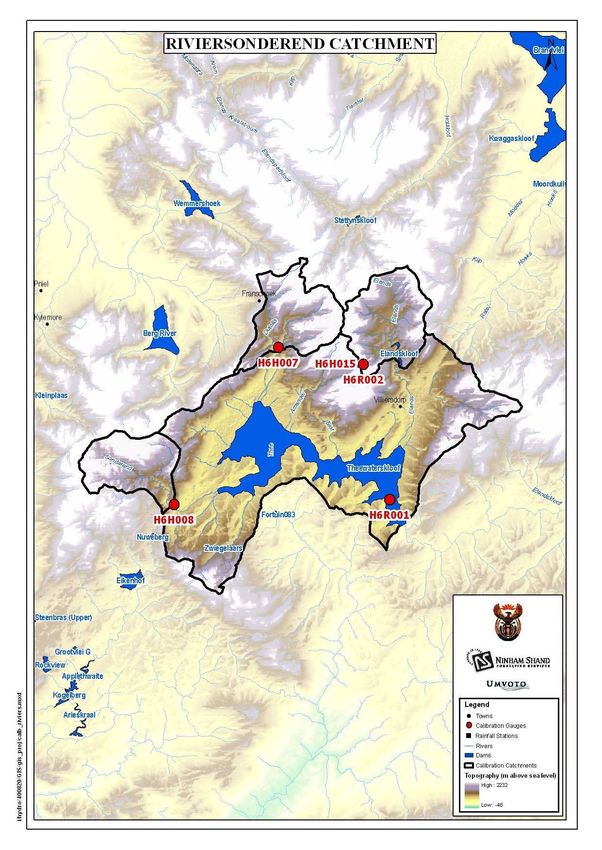
The Theewaterskloof Dam is situated in the Riviersonderend catchment and
surrounded by mountains to the north, west and south-west. The catchment area
comprises 509 km2. The water supply to the TWK dam is given through the
Sonderend river, flowing in south easterly direction, Du Toits river, flowing from the
north, as well as Elandspad and Waterkloof rivers, flowing from the east (South
Africa. DWAF, 2009c). The storage capacity of the TWK dam is 480,406 Mm3. The
gauge located TWK sub-catchment near the TWK dam is H6R001. There are three
more gauged sub-catchments in the area, namely H6H008 at the Nuweberg Forest,
H6H007 at the Du Toits River and H6R002 at the Elandskloof dam (South Africa.
DWAF, 2007d). The Riviersonderend catchment and the gauges can be seen in
Figure 2.9.2 Background 8
Figure 2.9: Riviersonderend Catchment with its Gauges (South Africa. DWAF, 2009c)
In the high lying regions, at the border of the catchment, mainly natural vegetation
can be found. Towards the centre of the catchment the topography flattens. In those
lower areas, agricultural cultivation is predominant and mostly fruit farming can be
found. The water for irrigation is mostly taken from several farm dams, but a small
share is extracted directly from the rivers (South Africa. DWAF, 2009b).
The catchment is situated in a winter rainfall region. The amount of precipitation in
the Riviersonderend Catchment varies between 600 mm in the flatter regions up to
2300 mm per year in the mountains (South Africa. DWAF, 2009c). The TWK dam is
connected to the Berg River and its tributaries in the neighbouring Berg WMA with a
tunnel system through the Franschhoek Mountains. The Berg catchment doesn’t
have sufficient storage capacity for the surplus of water during the winter, so it is
channelled through the tunnel to the TWK dam. It will be released back in the
summer with additional water from the Breede WMA, when the water demand
Figureexceeds the supply
2.4: Catchment of the Berg
calibration catchment.
gauges This export out of the TWK dam sums up
in the Riviersonderend
to 161 Mm3 per year. The surplus water in the summer from the Berg River into the
TWK dam amounts to 25 Mm3 per year. (South Africa. DWAF, 2009a)
The total 1:50 yield of the TWK dam amounts to 241,2 Mm3 per year. This includes
not only the water supply to the Berg WMA and the CCT, but also other minor water
users. An agreement between the DWAF and the CCT grants the CCT a fixed lawful
water use allocation of 90 Mm3 per year for urban usage as well as a temporary MAY 2009
irrigation surplus of 28 Mm3 per year. (South Africa. DWAF, 2007a)
2.3 Future Supply
As described in the previous section for the past, the future supply to the CCT will
have to be met by the WCWSS. In 2007 a reconciliation strategy study by the DWAF
was adopted to reconcile the future water demand and help decision makers on
planning. It is expected that under the forecasted growth of water demand the
existing WCWSS will suffice until 2014. When employing water conservation2 Background 9
measures the water supply shortage can be delayed until 2019. To be able to
continue the provision of water to the CCT, different intervention option are under
investigation and feasibility studies are being conducted. The supply side
interventions that could be implemented are an augmentation of surface water
schemes, development of groundwater, desalination of seawater and re-use of
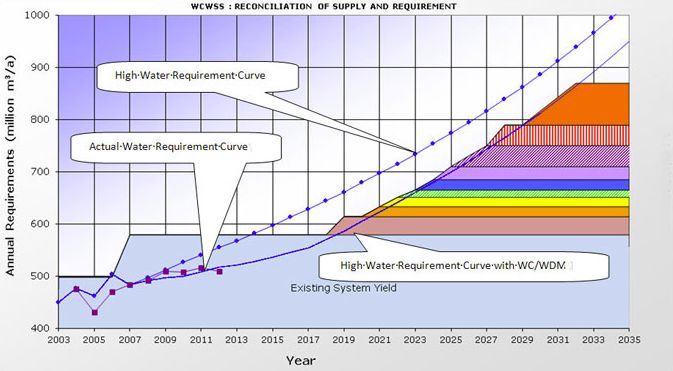
water. In Figure 2.10 those interventions can be seen for the 2011 reference
scenario, based on lowest cost per volume of water produced.
Figure 2.10: Reconciliation of Supply and Requirements for the 2011 Reference Scenario
Figure 2.10 depicts one of the possible path the future development of the WCWSS
could take. The single intervention options are listed in Table 2.3. (South Africa.
DWAF, 2011b)
Table 2.3: Intervention Options for the Reference Scenario
No Intervention Year of First Water Yield
[Mm3/a]
1 Voëlvlei Phase 1 2019 35
2 Lourens 2021 19
3 Cape Flats Aquifer 2022 18
4 DWAF: ASR: West Coast 2023 14
5 TMG Scheme 1 2024 20
6 Raise Lower Steenbras 2025 25
7 Re-use Generic 1 2026 40
8 Re-use Generic 2 2028 40
9 Desalination 2030 80
In addition to the growing water demand, causing the need of new water sources, the
possible impact of climate change on water availability needs to be taken into
account. This study aims to model the climate impact on the water availability in the
reservoir of the TWK dam.2 Background 10 2.4 Historical Climate To evaluate the consequences of climate change on the area of interest further down this study, the focus of the historical climate data lies especially in analysing the precipitation and temperature developments over the last years. The correlation of the temperature variation and precipitation distribution over one year is shown in Figure 2.11, exemplarily for the year 2003. It is apparent that the precipitation is lowest when the mean temperatures are the highest during the summer months. In contrast, during the winter months, when the temperatures are much lower the precipitation increases significantly. The figure therefore clearly shows the dynamics of a winter rainfall region. This correlation is important to understand the mismatch of water supply and demand for the City of Cape Town (cf. Figure 2.1). While the water demand is highest during the hotter period, there is not always enough water that can be supplied through precipitation to cover this demand. For this reason the water supply system, which is partially analysed in this study, is of essential importance. Figure 2.11: Precipitation at the TWK Dam and Temperature of the CCT Region for the Year 2003 The Riviersonderend catchment is located in a winter rainfall region. The annual precipitation at this location varies between 2300 mm in the mountain to 600 mm in the flat land. As being typically for a region where the precipitation takes place during the winter months, the evaporation rates are rather high in the summer months with 230 to 250 mm per month compared to an evaporation rate of 40 to 50 mm per month during the winter months. (South Africa. DWAF, 2009c) The historical precipitation, measured at the gauge station of the TWK dam, for the period from 1970 to 2004 can be seen in Figure 2.12. Hardly any visible variations can be found over the last 30 years. A decrease of less than 1‰ can be stated.
2 Background                                                                                   11

Figure 2.12: Historical Precipitation at the Theewaterskloof Dam for the Period 1970 to 2004

In Figure 2.13 the historical average daily temperatures of different weather stations
in the location of interest are shown (South African Weather Service, 2013). The
temperature measurements of all stations follow the same trend and do not deviate
more than 6% from the mean value. The trend line in Figure 2.13 indicates an
increase of the mean temperatures over the last 30 years. In this period the annual
average temperatures rose by 3 °C.

Figure 2.13: Historical Temperature Measurements for the Period 1970 to 2004
2 Background                                                                               12

2.5      Future Climate
One goal of this study is to investigate the future climate and to analyse the impact of
climate change on its development. In Section 3.2 of this report the forecast tool to
project different future climate scenarios will be introduced.
As already demonstrated in the historical review of the climate data, a tendency of
increased temperatures in the Western Cape region can be observed. The
temperature increase of 3°C over the period from 1970 to 2004 is a strong indicator
that there will be a rising impact caused by climate change. Other studies confirm
this trend and foresee additional impacts due to climate change for Cape Town and
the Western Cape. On a global level the IPCC reports that the precipitation cycles
will also alter due to climate change. This represents a challenge for the supply of
fresh water resources (Bates et al., 2008). On a local level a study additionally points
out that the climate change will impact the water availability in south-west region of
South Africa (Schulze, 2011). In the Water Service Development Plan for CCT the
most likely impacts of the climate change for CCT are listed as an increase in the
annual mean temperature and a decrease of precipitation (CCT, 2012). This is
especially the case in the winter season wherefore the stored water resources in the
region will be diminished. The increased impact of climate change will possibly lead
to more frequent and intensive extreme weather occurrences.
3 Methodology                                                                              13

3         Methodology

The methodology applied in this study can be divided into the categories of data
collection, data generation, data processing and data evaluation. A flowchart
demonstrating the steps of this process is given in Figure 3.1.
The data collection process is conducted through a thorough literature review
focussing on the required parameters needed to model the water system of the
Riviersonderend catchment. This includes providing information on the historical
climate, supply side and demand side as well as future demand requirements.
The future supply side will be provided through future climate files. The latter will be
generated in the data generation process. Here the stochastic generator of daily
weather data MarkSim will be used.
In the next step all information on water demand, water supply and climate will be
handled in the data processing step. With the help of the Water Evaluation And
Planning system simulation software (WEAP) the water system of the
Riviersonderend catchment can be modelled.
As a final step the results form the WEAP model can be evaluated. Hereby special
focus will lie on the development of the climate, the water availability in the
catchment and the coverage of the water demand of the City of Cape Town.
In the next sections the simulation software WEAP and the weather generator
MarkSim will be described and their application explained.

Figure 3.1: Flowchart of Methodological Approach

3.1       WEAP
To model the Riviersonderend catchment, situated in the Breede WMA, the Water
Evaluation And Planning system simulation software (WEAP) will be used. This
simulation software was developed by the Stockholm Environment Institute to
support experienced water resource planners. The distribution of limited water
3 Methodology                                                                           14

resources between agriculture, urban demand and nature is a challenging task of
water management. WEAP includes different aspects and needs of the above-
mentioned groups to support a suitable and sustainable water resource planning.
The simulation software enables one to recreate a local water system based on
geographical, climatological as well as water availability and consumption data.
Different scenarios can be developed to foresee the changes in water availability.
For this study a representative model of the Riviersonderend catchment will be built
to estimate the inflow to the TWK dam. This inflow represents the available supply
and it can be evaluated if the lawful fixed water allocation to the CCT of 90 Mm3 per
year can also be covered in the future. While historical data are available for the
period 1970-2004, future projections will reach 2050.
As the first step the catchment area of the Riviersonderend catchment is defined as
shown in Figure 2.9. Afterwards the catchment and its major components are
assembled as given in Figure 3.2. For this study the components are the river
Sonderend, receiving its head flow from the sub-catchment H6H008 Sonderend,
three other sub-catchments (H6H007 Du Toits, H6R002 Elands, H6R001 TWK), the
reservoir of the TWK dam, the demand CCT, the demand Berg WMA and Others, as
well as the gauge H6R001 comparing the naturalized flow to the simulated stream
flow results from WEAP. Third, historical data for the period 1970 to 2004 are
integrated according to the requirements of the components. As a fourth step
different climate scenarios generated in MarkSim are created for the target region
and the produced data sets are also integrated into WEAP. The data input and its
integration into the model are described in more detail in the following sections.

Figure 3.2: WEAP Model of Riviersonderend Catchment

3.1.1    Sub-Catchment Data
For the gauged sub-catchments H6H008 Sonderend, H6H007 Du Toits, H6R002
Elands and H6R001 TWK information on the area, latitude, precipitation and
temperature have to be integrated. Additionally information on the evaporation and
the crop coefficient Kc have to be provided.
The area, latitude and mean annual precipitation (MAP) are given in The
Assessment of Water Availability in the Berg Catchment Report (BWAAS) and are
summarized in Table 3.1 (South Africa. DWAF, 2009c). An exception is the latitude for
3 Methodology                                                                              15

the gauge station H6R001 Theewaterskloof taken from MarkSim™ DSSAT weather
file generator (International Livestock Research Institute, 2010-2011).
Table 3.1: Gauged Sub-Catchments in Riviersonderend Catchment

                   Gauge Station                    Area    Latitude     MAP
                                                    [km2]      [°]       [mm]
            H6H008 Sonderend                      39,06     -34,062222   2320
            H6H007 Du Toits                       46,02     -33,938611   1455
            H6R002 Elands                         49,90     -33,964722   1042
            H6R001 Theewaterskloof               374,20     -34,078056   1099

The monthly precipitation data are also taken from The Assessment of Water
Availability in the Berg Catchment Report (South Africa. DWAF, 2009c). As in the
report the figures are presented in percentage of mean annual precipitation (%MAP),
for WEAP these need to be converted into mm per month with the given MAP values
of each gauge.
The South African Weather Service has six weather stations with available historical
temperature data in the proximities of the area of interest. These are Malmesbury,
Worcester, Paarl, Molento Reservoir, Strand and Cape Point and their location can
be found in Figure 3.3. As there are no exact data available for the gauge stations in
the Riviersonderend catchment, the average of the regional data will be considered
in this case. An analysis of all data sets from the different weather stations indicates
that the temperatures follow the same trend without much variation (less than 7%).
This supports the decision to take the averaged regional values for the sub-
catchments being analysed. Therefore daily averages between maximum and
minimum temperatures of the six weather stations are included into WEAP.

Figure 3.3: Weather Stations near the City of Cape Town
3 Methodology 16 The chosen method for determining the internal sub-catchment water demand is the rainfall runoff method (soil moisture model). This model is taken, because no evapotranspiration data was made available for the sub-catchments under investigation. Given the latitude of the site, WEAP is able to determine the evapotranspiration with the help of the specified precipitation and temperature data. The crop coefficient Kc takes into account certain properties of the plants on the surface and is used to predict the evapotranspiration of the vegetation. Such properties include the plant type, plant variety and the stage of development of the plant. Also the resistance to transpiration, crop height, roughness, reflection, ground cover and rooting characteristics count as properties and will be reflected in the Kc value (Allen et al., 1998). Since no Kc values could be found for the sub-catchment, they are dealt within the key-assumptions section and are not directly integrated into the sub-catchments. Three exemplary Kc values, forest (conifer tree) (Kc=1), vineyard (Kc=0,7) and fruit tree (apples, cherries or pears) (Kc=1,2), are created in the key- assumptions (Allen et al., 1998). It is now possible to access the desired value over the branches in the input field of the Kc value for each catchment. This way allows more flexibility to add or change the Kc values. It is thereby possible to analyse the influence of different types of cultivation on the results. 3.1.2 River Data The Sonderend River flows in a south-easterly direction. It has its source in the Hottentots Holland mountain range. In the model the head flow of the river is therefore given through the inflow from sub-catchment H6H008 Sonderend presented in Section 3.1.1. 3.1.3 Reservoir Data For the reservoir information on the storage capacity, reservoir elevation, net evaporation and the surface area are needed. The storage capacity of the Theewaterskloof dam is 480,406 Mm3 (South Africa. DWAF, 2011a). The initial storage volume for the simulation amounts to 358,83 Mm3. This is the end month volume for December 1969, with the simulation starting in the year 1970. To create the volume-elevation curve, the monthly historical observed volume and the reservoir elevation are taken from the BWAAS Report No. 8 on System Analysis Status Report (South Africa. DWAF, 2008). The data for the net evaporation from the reservoir are also taken from the BWAAS Report No. 8 on System Analysis Status Report (South Africa. DWAF, 2008). As the data are given in m3 per second, for WEAP they needed to be converted into mm per month by aid of the reservoir surface area of 50,59 km2 (South Africa. DWAF, 2011a). In order to achieve more realistic results the future net evaporation is integrated into WEAP by means of an average of the historical net evaporation from 1970 until 2004. 3.1.4 Demand CCT Data As input parameters for the demand CCT for WEAP the annual water use rate and the monthly variation are required. The historical water use rate of the CCT from the TWK dam is given through the lawful fixed water allocation of 90 Mm3 per year (South Africa. DWAF, 2007a). This value will also be considered as fixed for the future, as it is unlikely that the dam can suddenly provide a different amount of water to the CCT. The growing total demand of the CCT will need to be met by other suppliers and sources as presented in Section 2.3. The monthly variation of the fixed annual water use rate is deduced from the monthly water demand of the CCT. The historical water demand of CCT is provided in the
3 Methodology                                                                                  17

thesis work from Ogutu at Tshwane University of Technology (Ogutu, 2007). In order
to achieve more realistic results the future monthly variation is integrated by means
of an average of the historical monthly variations from 1971 until 2004.
3.1.5    Demand Berg WMA and Others Data
Apart from the CCT demand the Berg WMA Demand is the second main water user
of TWK dam. Additionally, the other allocations of the TWK dam to minor water users
are included in the model. For the integration of the Berg WMA and Others demand
data, the annual water use rate and its monthly variation are required. The tunnel
system connecting the Berg River and other smaller water users to the TWK dam is
an important component of the interlinked WCWSS. For this reason it is
schematically included in the WEAP model. In the Reconciliation Strategy Study by
the DWAF, data on the water allocations of the TWK dam are available (South Africa.
DWAF, 2007a). As described in Chapter 2.2 the annual water allocation sums up to
241,2 Mm3 per year, of which 151,2 Mm3 per year are supplied to the Berg WMA and
the other minor water users. As there was no monthly variation made available for
the Berg WMA and Others demand, the monthly variation of the annual water use
rate of the CCT demand is taken and integrated into WEAP. This is done in order to
obtain more realistic results.
3.1.6    Gauge Data
In general gauges are useful to built more detailed simulations. In this study, the
gauge just upstream of the TWK reservoir provides the basis to verify the reliability of
the WEAP model against real data. At the gauge the cumulative naturalised flows of
the sub-catchment H6H008 Sonderend, H6H007 Du Toits, H6R002 Elands and
H6R001 TWK dam are to be found. These cumulative flow values can be found in
the BWAAS (South Africa. DWAF, 2009c).

3.2      MarkSim
To model the future climate for the Riviersonderend catchment the weather
generator MarkSim provided by the International Livestock Research Institute is
used. The tool is available on the International Center for Tropical Agriculture website
(International Livestock Research Institute, 2010-2011). It is designed to model local daily
weather data based on downscaled global climate model outputs for agricultural
modelling applications.
MarkSim is a third order Markov weather generator using a combination of different
downscaling methods. Downscaling implies considering esoteric results generated
by a General Circulation Model (GCM) in relation to existing locations somewhere in
the world (Jones & Thornton, 2013). The GCMs were not developed to model the
weather itself, but to deliver an average temperature of a certain cell resolution in the
atmosphere. In these models the precipitation estimations can be determined with
the help of a latent heat balance. For weather estimations of local climate,
information on the topography, storms, fronts, local and orogenic effects are
necessary. Having assembled climate anomalies from historical local climate
records, the GCMs can be downscaled to a higher, site-specific resolution. MarkSim
uses a combination of stochastic and hierarchical downscaling as well as climate
typing methods to produce daily data for temperatures and precipitation. (Jones &
Thornton, 2013)
3.2.1    Future Emission Scenarios
The data sets used from the General Circulation Models include different scenarios
developed in the Special Report on Emission Scenarios (SRES) published by the
Intergovernmental Panel on Climate Change (IPCC). There are four qualitative
3 Methodology                                                                               18

scenario families, namely A1, A2, B1 and B2, which include key indicators for the
upcoming development, emphasizing on different driving forces. The focus of each
scenario differs, resulting in a higher economic focus for scenario families A1 and A2
and a more environmental focus for the families B1 and B2. The scenario families
also describe different international integration of the world. On the one hand
scenario families A1 and B1 have a homogenous view on the development of the
world, i.e. assuming that globalisation will be of key importance. On the other hand
scenario families A2 and B2 describe a more heterogeneous world in which
regionalisation is most likely to be found.
MarkSim includes the scenarios A1B, A2 and B1. The scenario A1 specifically is
characterized by a fast economic growth as well as a fast development and an
introduction of efficient and new technology. In consequence this leads to a global
integration due to a decline in regional differences. One of the scenario groups of A1
is a balanced importance across all energy technologies (A1B). The foreseen
increase in the global mean temperature for this scenario lies between 1,4 and
6,4 °C. The scenario A2 emphasizes on regionally orientated economic
development. It describes a development with a focus on preservation of local
identities and self-reliance. The predicted global mean temperature increases by 2,0
to 5,4 °C. Scenario B1 instead will have a focus on global environmental
sustainability. It describes a world dominated by a service and information economy
that reduces the intensity of material use and introduces clean and resource-efficient
technologies. Additionally to those sustainable measurements there will be no
climate initiatives, resulting in a rise of the global mean temperature of 1,1 to 2,9 °C.
(IPCC Working Group III, 2000)
3.2.2    Application
As a first step the locations of the gauge stations need to be selected. It has been
found that a selected location has a large impact on the generated outcomes of the
data files. This phenomenon arises especially when looking at larger areas
containing both mountainous and flat land regions. In these cases, the amount of
precipitation and the temperatures can vary significantly. In general it can be said
that the amount of precipitation is higher and the temperatures are lower in the
mountains compared to lower laying regions. Therefore, additionally to the sub-
catchments’ gauge stations Sonderend, Du Toits and Elands a second location in the
mountains of the sub-catchments is chosen. This is done to provide more realistic
data representing the entire sub-catchment. As the sub-catchment Theewaterskloof
is significantly larger compared to the other sub-catchments, three additional
locations to the gauge location are chosen. The coordinates for latitude and longitude
selected for the calculations as well as the corresponding altitude can be found in
Table E.1 in the Appendix (South Africa. DWAF, 2009c; International Livestock Research
Institute, 2010-2011).
Next, the desired General Circulation Model has to be chosen. The web-based tool
includes six different GCMs as well as an average climatology of the same six
CGMs. The developing institution and their corresponding GCMs can be found in
Table 3.2.
3 Methodology                                                                                 19

Table 3.2: General Circulation Models used in MarkSim

      Model Name (Date)                                 Institution             Country
   BCCR_BCM2.0 (2005)               Bjerknes Centre for Climate Research        Norway
                                    (University of Bergen)
      CNRM-CM3 (2004)               Centre National de Recherches               France
                                    Météorologiques
      CSIRO-Mk3.5 (2005)            Commonwealth Scientific and Industrial      Australia
                                    Research Organisation
        ECHam5 (2005)               Max Planck Institute for Meteorology        Germany

      INM-CM3_0 (2004)              Institute for Numerical Mathematics         Russia

MIROC3.2 (medres) (2004)            Center for Climate System Research           Japan
                                    (University of Tokyo), National Institute
                                    for Environmental Studies and Frontier
                                    Research Center for Global Change

In this study the average of the above-mentioned six models is considered to
generate the weather data. This allows the prediction to become more reliable, but
being limited to those six models (International Livestock Research Institute, 2010-2011).
As a third option it is possible to choose between the different SRES scenarios A1B
(medium emission scenario), A2 and B1. Here the scenarios A2, as high emission
scenario, and B1, as low emission scenario, will be taken into consideration and
integrated into WEAP for further investigation.
The daily weather data are generated for an averaged ten year time period extending
5 years to either side of the selected simulation year. As this report intends to
investigate the occurrences of climate change until the year 2050, the time slices
2010, 2020, 2030, 2040 and 2050 are taken into account.
In order to increase the reliability of the climate files five random replications for each
respective location, scenario and selected year are produced. This results in a total
of 300 climate files containing daily precipitation as well as minimum and maximum
temperatures. The average temperature is determined by the arithmetic mean of
maximum and minimum temperatures. The random replications are averaged for
each location, scenario and year.
The integration of the generated weather data into WEAP is done in the same way
as for the historical climate data considering the three different scenarios (cf. Section
3.1.1). For a better comparison, an additional baseline scenario is added into WEAP
using monthly averaged values of the historical data. As described in Section 2.4, the
average precipitation over the period from 1970 until 2004 was almost constant. For
this reason the monthly averages of the entire period will be used for the base
scenario to achieve the most realistic results. The temperatures on the other hand,
showed a clear tendency of increase within this period. Due to this fact, only the
monthly averages of the last five years are chosen from the historical data to built the
baseline scenario.

3.3       Limitations
When reviewing the limitations of the Riviersonderend catchment model it is possible
to distinguish between limitations imposed by WEAP and MarkSim.
You can also read