Development and Testing of an UltraBattery-Equipped Honda Civic Hybrid
←
→
Page content transcription
If your browser does not render page correctly, please read the page content below
INL/EXT-12-28003
                                                               Revision 0

Development and
Testing of an
UltraBattery-Equipped
Honda Civic Hybrid

Sally (Xiaolei) Sun
Tyler Gray
Pattie Hovorka
Jeffrey Wishart
Donald Karner
James Francfort

August 2012

The INL is a U.S. Department of Energy National Laboratory
operated by Battelle Energy Alliance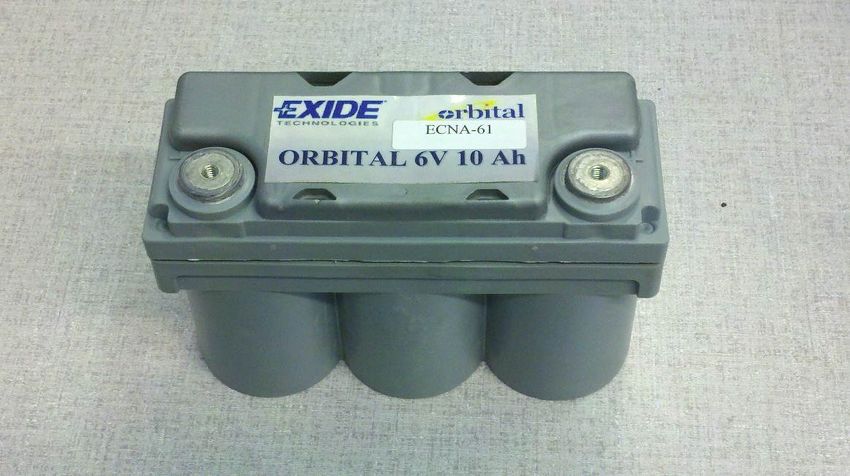
DISCLAIMER
     This information was prepared as an account of work sponsored by an
agency of the U.S. Government. Neither the U.S. Government nor any
agency thereof, nor any of their employees, makes any warranty, expressed
or implied, or assumes any legal liability or responsibility for the accuracy,
completeness, or usefulness, of any information, apparatus, product, or
process disclosed, or represents that its use would not infringe privately
owned rights. References herein to any specific commercial product,
process, or service by trade name, trade mark, manufacturer, or otherwise,
does not necessarily constitute or imply its endorsement, recommendation,
or favoring by the U.S. Government or any agency thereof. The views and
opinions of authors expressed herein do not necessarily state or reflect
those of the U.S. Government or any agency thereof.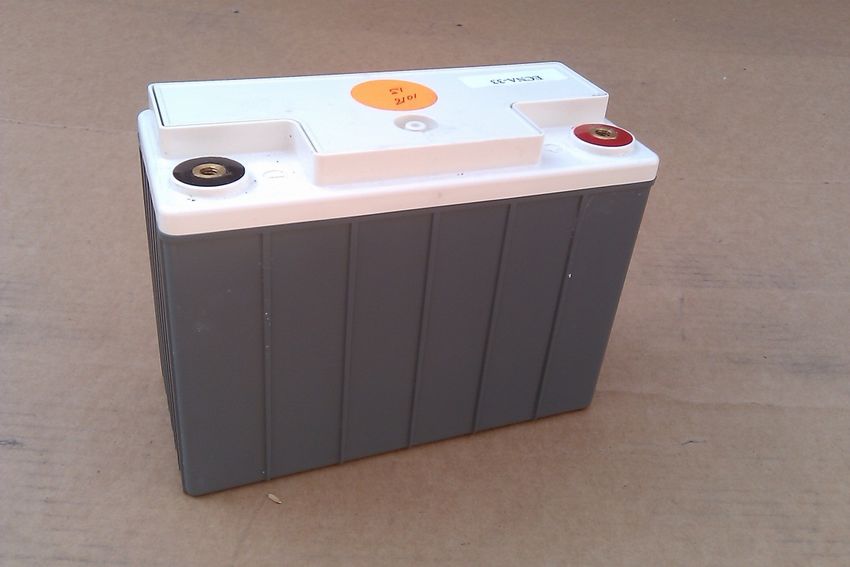
INL/EXT-12-28003
                                                   Revision 0

      Development and Testing of an
UltraBattery-Equipped Honda Civic Hybrid

                Sally (Xiaolei) Sun
                    Tyler Gray
                  Pattie Hovorka
                 Jeffrey Wishart
                  Donald Karner
                 James Francfort

                   August 2012

          Idaho National Laboratory
           Idaho Falls, Idaho 83415

              http://www.inl.gov

                 Prepared for the
            U.S. Department of Energy
             Office of Nuclear Energy
         Under DOE Idaho Operations Office
           Contract DE-AC07-05ID14517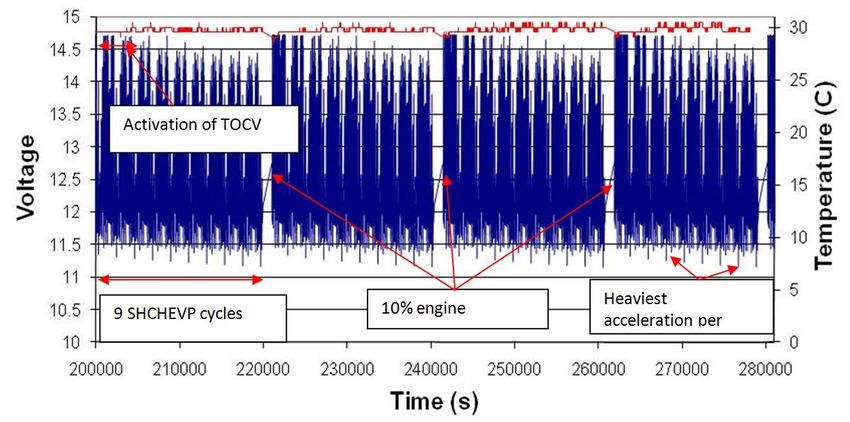
EXECUTIVE SUMMARY
    The UltraBattery Retrofit Project DP1.8 and Carbon Enriched Project C3,
performed by ECOtality North America (ECOtality) and funded by the U.S.
Department of Energy and the Advanced Lead Acid Battery Consortium
(ALABC), are established to demonstrate the suitability of advanced lead battery
technology in hybrid electrical vehicles (HEVs).
     A profile, termed the “Simulated Honda Civic HEV Profile” (SHCHEVP)
has been developed in Project DP1.8 in order to provide reproducible laboratory
evaluations of different battery types under real-world HEV conditions. The
cycle is based on the Urban Dynamometer Driving Schedule and Highway Fuel
Economy Test cycles and simulates operation of a battery pack in a Honda Civic
HEV. One pass through the SHCHEVP takes 2,140 seconds and simulates
17.7 miles of driving. A complete nickel metal hydride (NiMH) battery pack was
removed from a Honda Civic HEV and operated under SHCHEVP to validate the
profile. The voltage behavior and energy balance of the battery during this
operation was virtually the same as that displayed by the battery when in the
Honda Civic operating on the dynamometer under the Urban Dynamometer
Driving Schedule and Highway Fuel Economy Test cycles, thus confirming the
efficacy of the simulated profile.
      An important objective of the project has been to benchmark the performance
of the UltraBatteries manufactured by both Furukawa Battery Co., Ltd., Japan
(Furakawa) and East Penn Manufacturing Co., Inc. (East Penn). Accordingly,
UltraBattery packs from both Furakawa and East Penn have been characterized
under a range of conditions. Resistance measurements and capacity tests at
various rates show that both battery types are very similar in performance. Both
technologies, as well as a standard lead-acid module (included for baseline data),
were evaluated under a simple HEV screening test. Both Furakawa and East
Penn UltraBattery packs operated for over 32,000 HEV cycles, with minimal loss
in performance; whereas the standard lead-acid unit experienced significant
degradation after only 6,273 cycles. The high-carbon, ALABC battery
manufactured in Project C3 also was tested under the advanced HEV schedule.
Its performance was significantly better than the standard lead-acid unit, but was
still inferior compared with the UltraBattery. The batteries supplied by Exide as
part of the C3 Project performed well under the HEV screening test, especially at
high temperatures. The results suggest that higher operating temperatures may
improve the performance of lead-acid-based technologies operated under HEV
conditions—it is recommended that life studies be conducted on these
technologies under such conditions.
    Individual Furakawa UltraBatteries have been operated according to the
SHCHEVP under a range of state of charge (SOC) windows and temperatures.
Battery cycling was conducted using three different SOC windows (43 to 53%,
53 to 63%, and 63 to 73%) and three different battery temperatures (10°C [50°F],
30°C (86°F), and 58°C [136°F]). The results suggest that an adequate
compromise between vehicle acceleration and charging efficiency during
regenerative braking is provided with a SOC window of 53 to 63%. Also, low
operating temperatures severely decrease the energy returned by simulated
regenerative braking. At 30°C (86°F), the number of simulated vehicle miles
covered before a simulated engine recharge is required is 142 miles; the number

                                        ii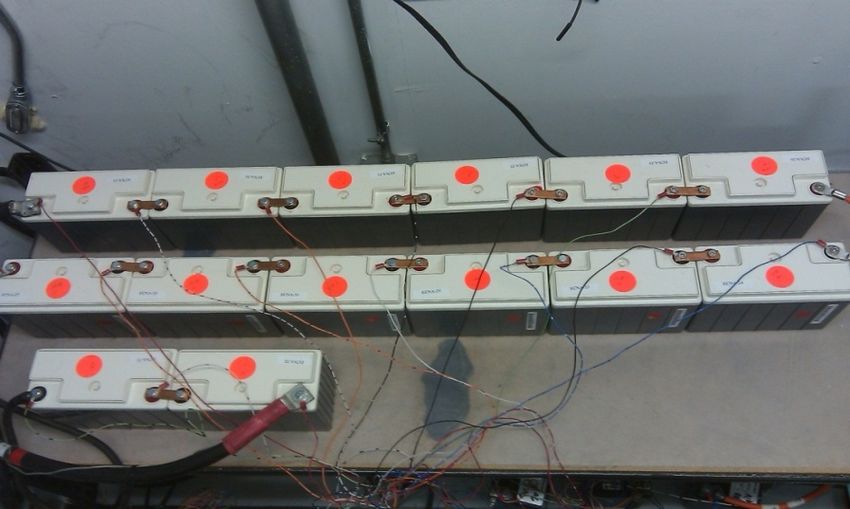
of miles drops to less than 18 miles at 10°C (50°F). As a result, operation in
cooler climates, where trip distances are short (i.e., where there is insufficient
time for batteries to heat up), will result in increased fuel usage. The lower
temperatures also decrease the available discharge power, although this change is
small relative to the effect on charging efficiency.
     In another test, an individual 12-volt (V) East Penn UltraBattery was cycled
for 167,700 simulated vehicle miles under SHCHEVP (at 30°C [86°F]). While
the discharge capacity decreased from 7.6 to 4.5 Ah, the battery was still capable
of providing the power required for acceleration. Also, the battery’s ability to
accept energy from regenerative braking decreased significantly during the
operating period. However, the effect of this behavior on fuel economy is not
known. This aside, the result is considered very promising, because the
SHCHEVP used to cycle the battery has the same discharge/charge intensity and
frequency that is used for the NiMH battery currently in the Honda Civic Hybrid
(i.e., the power levels were not decreased for the UltraBattery). This result
demonstrates that the UltraBattery packs can last the design life of modern
HEVs.
    A 12-V, NiMH module (from the Honda Civic vehicle) was tested for almost
80,000 simulated vehicle miles under SHCHEVP (at 30°C [86°F]), and its
capacity and performance remained unchanged during the test period. It
consistently delivered 159 simulated vehicle miles between simulated engine
recharges. The performance of the NiMH module also decreased when the
temperature was lowered, although this drop was not as severe as for the
UltraBattery. For example, at 10°C (50°F), the NiMH battery is still capable of
operating for 71 simulated vehicle miles between simulated engine recharges,
compared to only 18 miles for the UltraBattery. Therefore, the fuel usage at low
temperatures of an NiMH-based HEV is expected to be lower than that of an
equivalent UltraBattery-powered HEV. However, the extent of such a difference
is not known. An individual 12-V, high-carbon ALABC module also was
operated under SHCHEVP, but failed after providing 40,391 miles of simulated
service.
     A Furakawa UltraBattery pack operated trouble free for 60,000 simulated
miles under SHCHEVP (at 30°C [86°F]), with a minimal drop in performance. A
vehicle-sized pack of East Penn UltraBattery packs also delivered 60,000 miles
under SHCHEVP (at 30°C [86°F]). While there was an initial battery failure in
this pack (at 10,000 miles), logging of individual 12-V modules has shown that
all units were still very close in performance at the end of the cycling period.
These results are very promising and, combined with the results for the
individual module cycling, they suggest that UltraBattery packs may be capable
of lasting the design life of a modern HEV (e.g., 160,000 miles). In the C3
Project, a vehicle-sized pack of the high-carbon ALABC modules was operated
under SHCHEVP, although it failed after 27,000 simulated miles. A
vehicle-sized, high-carbon, lead-acid battery from Exide also was cycled under
SHCHEVP, but it failed after 12,500 simulated miles.
     The DP1.8 Project also consists of a retrofit of the original NiMH battery
with a pack of 14 UltraBattery modules (manufactured by East Penn) in a new
2010 Honda Civic HEV. After completing the initial conversion, ECOtality
tested the HEV in accordance with, and in cooperation with, the Advanced

                                        iii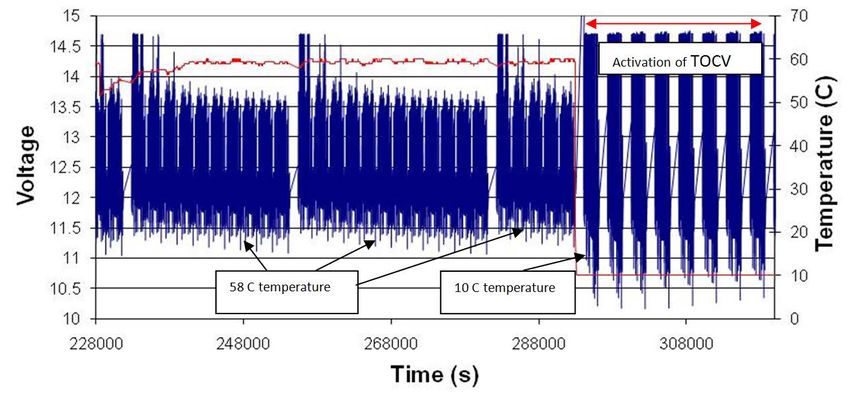
Vehicle Testing Activity of the Department of Energy’s FreedomCAR and
Vehicle Technologies Program.
    ECOtality conducted a full vehicle baseline characterization on the converted
Honda Civic HEV. A full dynamometer evaluation (e.g., measurement of fuel
economy under standard driving schedules on the dynamometer) was completed
by Argonne National Laboratory. This approach allowed direct performance
comparisons with the UltraBattery against the technologies used in the
unmodified HEV.
    In October 2011, the converted HEV was put into ECOtality’s fleet of test
vehicles in Phoenix, Arizona, and currently is accumulating approximately
5,000 miles per month. As of the end of August 2012, the vehicle has
accumulated more than 60,000 miles and has experienced a wide range of driving
conditions. The battery capacity was 7.54 Ah (at a C1 rate) after 51,000 miles
driven, which is a very minimal capacity loss when comparing an average
7.55 Ah for the new modules. The vehicle delivers an average of a 44-mpg fuel
economy when driving under mild temperature and in reasonably flat terrain.
This number does drop to approximately 35 mpg when the temperature increases
and the terrain become hillier.
    The individual module voltages are being measured separately on a monthly
basis. Comparisons of the module voltage deviation between December 2011 and
August 2012 indicate the battery modules are still in good health.

                                       iv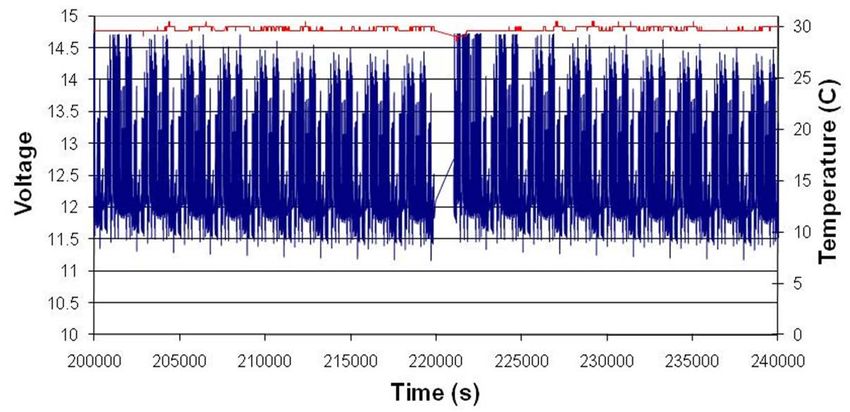
CONTENTS
1.   INTRODUCTION ............................................................................................................................ 13

2.   OBJECTIVES................................................................................................................................... 13

3.   WORK PROGRAM ......................................................................................................................... 14

4.   DP1.8 PROJECT PROGRESS ......................................................................................................... 14

     4.1      Task 1 - Simulated Honda Civic Hybrid Electric Vehicle Profile ......................................... 14

     4.2      Task 2 – Assembly, Benchmarking, and Characterization of Furakawa and East
              Penn UltraBattery Modules .................................................................................................... 17

              4.2.1       Task 2.1 – Capacity of UltraBattery Modules .......................................................... 17
              4.2.2       Task 2.2 - Resistance and Open-Circuit Voltage – State-of-Charge
                          Relationship of UltraBattery Packs ........................................................................... 19
              4.2.3       Task 2.3 - Benchmarking of UltraBattery Modules Under the Simple Hybrid
                          Electric Vehicle Screening Test ................................................................................ 21
              4.2.4       Task 2.4 – Hybrid Pulse Power Characterization Testing of UltraBattery
                          Modules..................................................................................................................... 24

     4.3      Tasks 3 – Optimize Operating Protocol for the UltraBattery................................................. 26

              4.3.1       Characterization of 12-V Furakawa UltraBattery Modules under the
                          Simulated Honda Civic Hybrid Electric Vehicle Profile at Different
                          State-of-Charge Windows ......................................................................................... 26
              4.3.2       Characterization of 12-V Furakawa UltraBattery Modules Under the
                          Simulated Honda Civic Hybrid Electric Vehicle Profile at Different
                          Temperatures............................................................................................................. 31
              4.3.3       Long-term Testing of 12-V East Penn UltraBattery and 12-V Nickel Metal
                          Hydride Modules Under the Simulated Honda Civic Hybrid Electric Vehicle
                          Profile........................................................................................................................ 32
              4.3.4       Operation of a Furakawa UltraBattery Pack (Three, 12-V Modules) Under
                          the Simulated Honda Civic Hybrid Electric Vehicle Profile for 60,000 Miles......... 35
              4.3.5       Operation of East Penn UltraBattery Vehicle Pack (14, 12-V Modules)
                          Under Simulated Honda Civic Hybrid Electric Vehicle Profile for
                          60,000 Miles ............................................................................................................. 36

     4.4      Tasks 4 to 8 - Vehicle Preparation and Battery Management System Development............ 38

              4.4.1       Honda System Overview .......................................................................................... 38
              4.4.2       UltraBattery Retrofit and Control Hardware Implementation .................................. 38
              4.4.3       UltraBattery Control Strategy ................................................................................... 39
              4.4.4       Battery Management System .................................................................................... 39
              4.4.5       Pack Configuration and Battery Enclosure ............................................................... 40
              4.4.6       Vehicle and Battery Operation in the Field............................................................... 41
              4.4.7       Retrofitted Vehicle Fleet Testing .............................................................................. 46

5.   C3 PROJECT PROGRESS .............................................................................................................. 56

                                                                         v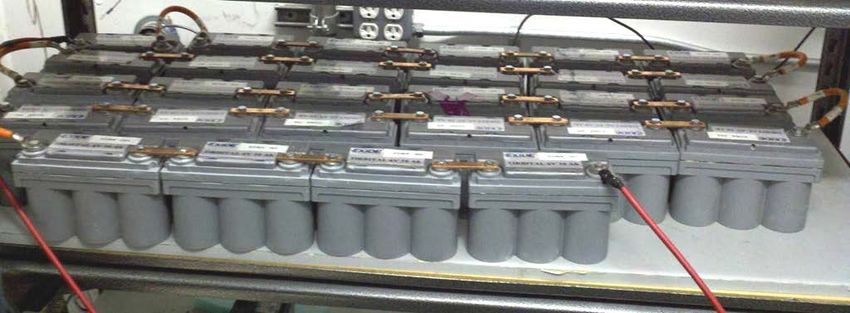
5.1      Task 1 - Manufacture of Advanced Lead-Acid Battery Consortium of High-Carbon
              Batteries ................................................................................................................................. 56

     5.2      Task 2 - Simulated Honda Civic Hybrid Electric Vehicle Profile ......................................... 57

     5.3      Task 3 - Performance of High-Carbon Advanced Lead-Acid Battery Consortium and
              Exide Modules ....................................................................................................................... 57

              5.3.1       Hybrid Electric Vehicle Screening Test.................................................................... 57
              5.3.2       Simulated Honda Civic Hybrid Electric Vehicle Profile Test .................................. 59

     5.4      Tasks 4, 5, 6, and 7 - Assemble, Commission and Cycle Packs Under the Simulated
              Honda Civic Hybrid Electric Vehicle Profile ........................................................................ 59

              5.4.1       Advanced Lead-Acid Battery Consortium High-Carbon Pack ................................. 59
              5.4.2       Exide Pack ................................................................................................................ 61

6.   CONCLUSION ................................................................................................................................ 63

7.   APPENDIXES .................................................................................................................................. 63

     Appendix A, Hybrid Pulse Power Characterization Results for the Furakawa UltraBattery
          Module ................................................................................................................................... 64

     Appendix B, Hybrid Pulse Power Characterization Results for the East Penn UltraBattery
          Module ................................................................................................................................... 68

     Appendix C, Hybrid Pulse Power Characterization Results for the Genesis Module ...................... 72

                                                                FIGURES
1.         Actual battery current and vehicle speed logged during operation on the dynamometer
           during one pass through the Urban Dynamometer Driving Schedule, followed by one
           pass through the Highway Fuel Economy Test .......................................................................... 15

2.         Battery current comprising the Simulated Honda Civic Hybrid Electric Vehicle Profile .......... 15

3.         Typical voltage behavior of a nickel metal hydride battery pack in a Honda Civic on
           dynamometer during one pass through the Urban Dynamometer Driving Schedule,
           followed by one pass through the Highway Fuel Economy Test ............................................... 16

4.         Voltage of the nickel metal hydride battery pack in the laboratory operating under four
           consecutive cycles of the Simulated Honda Civic Hybrid Electric Vehicle Profile ................... 16

5.         Voltage of the nickel metal hydride battery pack in the laboratory operating under one
           cycle of the Simulated Honda Civic Hybrid Electric Vehicle Profile ........................................ 17

6.         Discharge time of Furakawa UltraBattery modules for a range of discharge current ................ 19

                                                                         vi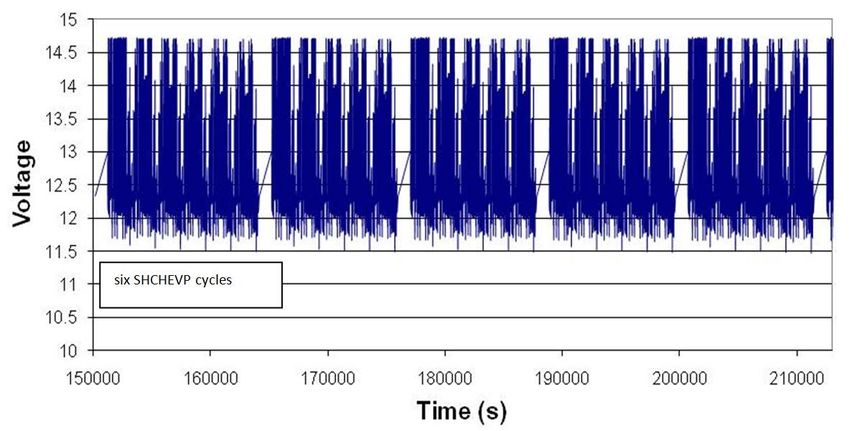
7.    Internal resistance of a Furakawa UltraBattery module (measured at the
      Commonwealth Scientific and Industrial Research organization).............................................. 20

8.    Voltage and temperature of Genesis module under the hybrid electric vehicle screening
      test............................................................................................................................................... 22

9.    Voltage and temperature of the Furakawa UltraBattery module under the hybrid electric
      vehicle screening test. ................................................................................................................. 22

10.   Voltage and temperature of the East Penn UltraBattery module under the hybrid
      electric vehicle screening test ..................................................................................................... 23

11.   Discharge and charge power of the Furakawa UltraBattery module before and after the
      hybrid electric vehicle screening test .......................................................................................... 25

12.   Discharge and charge power of an East Penn UltraBattery module before and after the
      hybrid electric vehicle screening test .......................................................................................... 25

13.   Discharge and charge power of a Genesis module before and after the hybrid electric
      vehicle screening test .................................................................................................................. 26

14.   Typical voltage of a Furakawa UltraBattery (ETA-134) operating under the Simulated
      Honda Civic Hybrid Electric Vehicle Profile, with a state-of-charge window of 43 to
      53% and battery temperature of 30°C (86°F). ............................................................................ 27

15.   Typical open-circuit voltage of a Furakawa UltraBattery (ETA-134) operating under
      the Simulated Honda Civic Hybrid Electric Vehicle Profile, with a state-of-charge
      window of 43 to 53%.................................................................................................................. 27

16.   Typical voltage of a Furakawa UltraBattery (ETA-132) operating under the Simulated
      Honda Civic Hybrid Electric Vehicle Profile, with a state-of-charge window of 53 to
      63% ............................................................................................................................................. 28

17.   Typical open-circuit voltage of a Furakawa UltraBattery (ETA-132) operating under
      the Simulated Honda Civic Hybrid Electric Vehicle Profile, with a state-of-charge
      window of 53 to 63%.................................................................................................................. 28

18.   Typical voltage of a Furakawa UltraBattery (ETA-129) operating under the Simulated
      Honda Civic Hybrid Electric Vehicle Profile with a state-of-charge window of 63 to
      73% ............................................................................................................................................. 29

19.   Typical open-circuit voltage of a Furakawa UltraBattery (ETA-129) operating under
      the Simulated Honda Civic Hybrid Electric Vehicle Profile, with a state-of-charge
      window of 63 to 73%.................................................................................................................. 29

20.   Typical voltage of a Furakawa UltraBattery (ETA-134) operating under the Simulated
      Honda Civic Hybrid Electric Vehicle Profile at a battery temperature of 30°C (86°F)
      (state-of-charge window of 43 to 53%) ...................................................................................... 31

                                                                       vii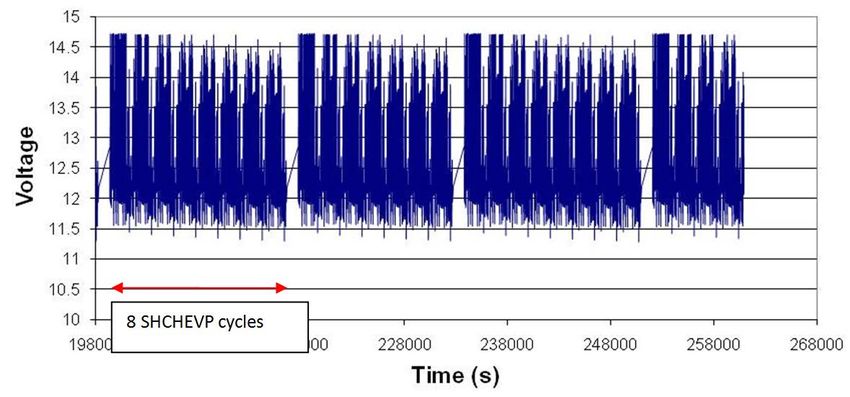
21.   Typical voltage of a Furakawa UltraBattery (ETA-134) operating under the Simulated
      Honda Civic Hybrid Electric Vehicle Profile at battery temperatures of 58°C (136°F)
      and 10°C (50°) (state-of-charge window of 43 to 53%) ............................................................. 32

22.   Voltage of Civic nickel metal hydride, 12-V module under the Simulated Honda Civic
      Hybrid Electric Vehicle Profile at 27°C (81°F) and 10°C (50°F) .............................................. 34

23.   Voltage of Civic nickel metal hydride, 12-V module under the Simulated Honda Civic
      Hybrid Electric Vehicle Profile at 10°C, expanded from Figure 22 (4 cycles or 71 miles
      of simulated driving between simulated engine recharges) ........................................................ 34

24.   Voltage of a Furakawa UltraBattery 12-V module under the Simulated Honda Civic
      Hybrid Electric Vehicle Profile at an operating temperature of 10°C (50°F)............................. 35

25.   Voltage response of three Furakawa UltraBattery modules (53 to 63% SOC, 30°C
      [86°F]) after 60,000 miles of simulated service ......................................................................... 35

26.   Voltage of weakest and strongest modules within the 12-module East Penn
      UltraBattery string during the Simulated Honda Civic Hybrid Electric Vehicle Profile
      duty (after 10,000 miles of simulated service; 50 to 60% state of charge) ................................. 37

27.   Voltage of weakest and strongest modules within the 12-module East Penn
      UltraBattery string during the Simulated Honda Civic Hybrid Electric Vehicle Profile
      Duty (after 45,135 miles of simulated service; 50 to 60% state of charge) ................................ 37

28.   Junction box and the cooling duct .............................................................................................. 40

29.   Battery compartment and its configuration in the vehicle .......................................................... 40

30.   UltraBattery modified 2010 Honda Civic Hybrid ...................................................................... 41

31.   Voltage of the weakest and strongest modules within the 14-module East Penn
      UltraBattery vehicle pack ........................................................................................................... 42

32.   Acceleration test chart of original Honda Civic hybrid electric vehicle with nickel metal
      hydride battery ............................................................................................................................ 43

33.   Acceleration test chart of UltraBattery-modified Honda Civic hybrid electric vehicle ............. 43

34.   Coastdown test of the UltraBattery-modified 2010 Honda Civic hybrid electric
      vehicle—velocity versus time..................................................................................................... 45

35.   Coastdown test of the UltraBattery-modified 2010 Honda Civic hybrid electric
      vehicle—force versus velocity ................................................................................................... 45

36.   Monthly and cumulative mileage of the retrofitted Honda Civic fleet test ................................ 47

37.   Monthly 5-mile urban drive for single module voltage monitoring ........................................... 47

38.   Monthly fuel economy of the retrofitted Honda Civic during the fleet test ............................... 48

                                                                   viii
39. 2006 MY Honda Civic hybrid electric vehicle fuel economy summary during the
160,000 miles fleet test ............................................................................................................... 48
40. Battery voltage versus drive speed on December 15, 2011, with a state-of-charge range
from 41 to 56% and battery temperature range from 18 to 21°C (64.4 to 69.8°F) in
Phoenix ....................................................................................................................................... 49
41. Battery discharge and regenerative power versus drive speed on December 15, 2011,
with a state-of-charge range from 41 to 56% and battery temperature range from 18 to
21°C (64.4 to 69.8°F) in Phoenix ............................................................................................... 50
42. Battery voltage versus drive speed on March 2012, with a state-of-charge range from
43 to 58% and battery temperature range from 30 to 31°C (86.0 to 87.8°C) in Phoenix ........... 50
43. Battery discharge and regenerative power versus drive speed on March 14, 2012, with a
state-of-charge range from 43 to 58% and battery temperature range from 30 to 31°C
(86.0 to 87.8°C) in Phoenix ........................................................................................................ 51
44. Battery voltage versus drive speed on August 22, 2012, with a state-of-charge range
from 33 to 49% and battery temperature range from 35 to 36°C (95.0 to 96.8°F) in
Phoenix ....................................................................................................................................... 51
45. Battery discharge and regenerative power versus drive speed on August 22, 2012, with
a state-of-charge range from 33 to 49% and a battery temperature range from 35 to
36°C (95.0 to 96.8°F) in Phoenix ............................................................................................... 52
46. Battery voltage versus drive speed on June 15, 2012, with a state-of-charge range from
23 to 31% and a battery temperature range from 43 to44°C (109.4 to 111.2°F) in
Phoenix ....................................................................................................................................... 52
47. Battery discharge and regenerative power versus drive speed on June 12, 2012, with a
state-of-charge range from 23 to 31% and a battery temperature range from 43 to 44°C
(109.4 to 111.2°F) in Phoenix .................................................................................................... 53
48. UltraBattery module voltage monitor for the road test on December 14, 2011.......................... 54
49. Difference between maximum and minimum module voltage for the road test on
December 14, 2011 ..................................................................................................................... 54
50. UltraBattery module voltage monitor for the road test on August 22, 2012 .............................. 55
51. Difference between maximum and minimum module voltage for the road test on
August 22, 2012.......................................................................................................................... 55
52. Maximum and minimum battery module voltage obtained for the road test from
December 2011 to August 2012 ................................................................................................. 56
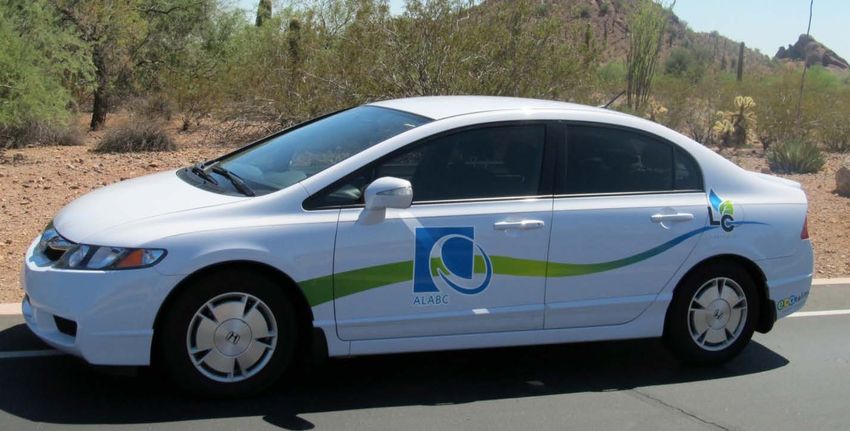
53. Picture of a 12-V, 10-Ah, Advanced Lead-Acid Battery Consortium high-carbon
battery ......................................................................................................................................... 56
54. Picture of a 6-V, 10-Ah, Exide high-carbon battery ................................................................... 57
ix55. Performance of a 12-V, 10-Ah, Advanced Lead-Acid Battery Consortium high-carbon
module under the hybrid electric vehicle screening test ............................................................. 58
56. Performance of two, 6-V Exide modules in series under the hybrid electric vehicle
screening test .............................................................................................................................. 58
57. Voltage of a 12-V Advanced Lead-Acid Battery Consortium high-carbon module under
the Simulated Honda Civic Hybrid Electric Vehicle Profile at the commencement of
duty (note five cycles, or 89 miles, between simulated engine recharges) ................................. 59
58. Picture of a vehicle-sized Advanced Lead-Acid Battery Consortium high-carbon pack
cycling in the laboratory ............................................................................................................. 60
59. Voltages of the weakest and strongest modules in the Advanced Lead-Acid Battery
Consortium carbon, vehicle pack during operation under the Simulated Honda Civic
Hybrid Electric Vehicle Profile .................................................................................................. 60
60. Voltages of the two weakest and the strongest modules in the Advanced Lead-Acid
Battery Consortium carbon vehicle pack at the end of cycling under the Simulated
Honda Civic Hybrid Electric Vehicle Profile ............................................................................. 61
61. Picture of a vehicle-sized Exide pack cycling in the laboratory ................................................. 61
62. Voltages of each 12-V block within the Exide vehicle pack at the commencement of
cycling under the Simulated Honda Civic Hybrid Electric Vehicle Profile ............................... 62
63. Voltages of each 12-V block within the Exide vehicle pack at the end of cycling under
the Simulated Honda Civic Hybrid Electric Vehicle Profile ...................................................... 62
TABLES
1. Capacity and open-circuit voltage of East Penn UltraBattery and Furakawa
UltraBattery modules .................................................................................................................. 18
2. Capacity of typical UltraBattery packs at different discharge rates ........................................... 18
3. Typical internal discharge resistance and open-circuit voltage-state of charge for an
East Penn UltraBattery module and cell (determined by ECOtality) ......................................... 19
4. Typical and internal discharge resistance and open-circuit voltage-state of charge for a
Furakawa UltraBattery module and cell (determined by ECOtality) ......................................... 20
5. Performance of 12-V East Penn UltraBattery and nickel metal hydride Insight modules
under Simulated Honda Civic Hybrid Electric Vehicle Profile duty (53 to 63% state of
charge and 30°C [86°F]) ............................................................................................................. 33
6. Capacity of East Penn UltraBattery vehicle battery bank during simulated cycling (53
to 63% state of charge, 30°C [86°F]) ......................................................................................... 36
x7. State of charge correction table based on average module open-circuit voltage ........................ 39
8. Acceleration performance comparison of UltraBattery-modified 2010 Honda Civic
hybrid electric vehicle versus the original 2006 Honda Civic hybrid electric vehicle ............... 42
9. Coastdown coefficients comparison ........................................................................................... 44
10. Coastdown test data comparison of the 2006 Honda Civic hybrid electric vehicle versus
the UltraBattery-modified 2010 Honda Civic hybrid electric vehicle ........................................ 44
11. Drive cycle fuel economy comparison of the UltraBattery-converted 2010 Civic Hybrid
and the 2006 Civic Hybrid.......................................................................................................... 46
12. Accessory impact on the UltraBattery-modified 2010 Civic drive cycle fuel economy ............ 46
xiACRONYMS
ALABC Advanced Lead-Acid Battery Consortium
BCM battery control module
CAN controller area network
CSIRO Commonwealth Scientific and Industrial Research organization
EODV end-of-discharge voltage
EPUB East Penn UltraBattery
FUB Furakawa UltraBattery
HEV hybrid electric vehicle
HWFET Highway Fuel Economy Test
LEODV lowest-end-of-discharge voltage
MCM motor control module
NiMH nickel metal hydride
OCV open-circuit voltage
SHCHEVP Simulated Honda Civic Hybrid Electric Vehicle Profile
SOC state of charge
TOCV top-of-charge voltage
UDDS Urban Dynamometer Driving Schedule
xiiDevelopment and Testing of an
UltraBattery-Equipped Honda Civic Hybrid
1. INTRODUCTION
With the population of hybrid electric vehicles (HEVs) increasing rapidly, the need for both low-cost
replacement and original equipment manufacturer battery packs for full, mild, and micro HEVs has
become acute.
Recent developments in advanced lead-acid battery technology have resulted in development of an
advanced lead-acid battery that incorporates the properties of an asymmetric supercapacitor (also known
as an ultracapacitor). Work conducted by the Advanced Lead Acid Battery Consortium (ALABC),
Commonwealth Scientific and Industrial Research Organization (CSIRO), and the Furukawa Battery Co.,
Ltd., Japan (Furakawa) has demonstrated very promising results for a version developed at CSIRO and
branded as the UltraBattery. A license to manufacture this battery in the United States has been secured
by East Penn Manufacturing Co., Inc. (East Penn), and they currently are transferring the technology for
production at their facility in Pennsylvania.
ALABC and Furukawa have previously demonstrated the capabilities of the UltraBattery by using it
to replace the nickel metal hydride (NiMH) battery in a Honda Civic HEV. ALABC and East Penn now
wish to prove the East Penn version of the UltraBattery technology in the same HEV that is tested
according to the U.S. Department of Energy testing protocol.
ECOtality tested the East Penn UltraBattery (EPUB) and the original CSIRO-Furakawa UltraBattery
(FUB) version in the laboratory under simulated schedules to assist with technology verification and
transfer. In the C3 Project, valve-release, lead-acid batteries containing high levels of carbon in the
negative electrode are being designed, manufactured, and evaluated under laboratory-simulated test
cycles. In order to streamline both research projects, the battery evaluation component of the C3 Project
has been combined with the current project (i.e., DP1.8). This report contains results from Projects DP1.8
and C3. Both projects were funded by the U.S. Department of Energy and ALABC.
2. OBJECTIVES
• To develop and optimize the UltraBattery operating protocols and test cycles
• To assemble and characterize the UltraBattery packs
• To compare performance of UltraBatteries manufactured by East Penn and Furakawa
• To convert a Honda Civic HEV to operate using an EPUB
• To maintain a minimum vehicle payload of 800 lb (i.e., four passengers plus 200 lb)
• To provide packaging favorable to battery life, but not integral with existing vehicle dimensions
• To provide a fuel economy equivalent to the unconverted Honda Civic Hybrid
• To maintain vehicle emissions performance equal to, or better than, the base vehicle
• To obtain an “Experimental Vehicle” permit from the California Air Resources Board for the
converted vehicle
• To install conversion components without violating the vehicle’s Federal Motor Vehicle Safety
Standard certification
• To baseline vehicle performance within the HEVAmerica test program
• To conduct fleet testing within the Advanced Vehicle Testing Activity.
133. WORK PROGRAM
The DP 1.8 work program is comprised of the following tasks:
Task 1 Develop initial vehicle operating protocols for UltraBattery use
Task 2 Assemble and characterize UltraBattery packs
Task 3 Optimize the UltraBattery operating protocol and test cycle
Task 4 Develop UltraBattery management system
Task 5 Prepare a new Honda Civic HEV for installation of UltraBattery packs
Task 6 Install UltraBattery packs and conduct vehicle startup
Task 7 Benchmark converted vehicle performance
Task 8 Conduct fleet testing of the converted Honda Civic
4. DP1.8 PROJECT PROGRESS
The following subsections include details on each task in the work program.
4.1 Task 1 - Simulated Honda Civic Hybrid Electric Vehicle Profile
ECOtality performed extensive studies on a fleet of standard Honda Civic HEVs. This included
160,000-mile road tests and operation on the dynamometer under multiple drive schedules to determine
fuel economy. All relevant battery parameters were monitored during this testing and, as a result,
ECOtality obtained a comprehensive understanding of how the batteries operate in such vehicles. The
Honda Civic HEV battery pack comprises 132 NiMH cells in series, with each cell having a nominal cell
voltage of 1.2 V and a rated capacity of 5.5 Ah.
Data obtained during dynamometer studies (Figure 1) and field operation of Honda Civic HEVs have
been used as a basis to formulate the Simulated Honda Civic HEV Profile (SHCHEVP; Figure 2) that
simulates the power requirements of the batteries in these vehicles. The profile is based on data derived
from one pass through the Urban Dynamometer Driving Schedule (UDDS), followed by one pass through
the Highway Fuel Economy Test (HWFET) schedule (i.e., average of five runs), as well as information
from the field regarding the effect of air conditioning, hill climbing, and so forth on battery state of charge
(SOC). The energy and power levels of SHCHEVP are, on average, equivalent to that experienced by the
battery when the vehicle is driven according to the UDDS and HWFET schedules. More specifically,
SHCHEVP mimics one pass through UDDS, followed by one pass through HWFET.
The time required for one pass of UDDS is 1,380 seconds. During this time, 7.5 simulated miles are
covered at an average speed of 19.5 mph. One pass through the HWFET takes 760 seconds and simulates
10.2 miles of driving at an average speed of 48.5 mph. In summary, one pass through SHCHEVP takes
2,140 seconds and provides 17.7 miles of operation at an average speed of 28.9 mph. Three months of
duty under the profile provide greater than 64,000 miles of simulated driving.
In terms of energy delivery, one pass through SHCHEVP (17.7 miles) requires the battery to deliver
approximately 2.5 Ah. On average, each mile of driving requires 0.14 Ah of discharge energy. Over the
design life of the vehicle (160,000 miles), the NiMH battery in the Honda Civic HEV would need to
deliver 22,400 Ah, or the equivalent of approximately 4,000 complete discharge cycles. Comparative
calculations performed by ECOtality for a Toyota Prius HEV battery pack indicate a delivery of almost
6,000 complete discharge cycles over the same distance.
14Figure 1. Actual battery current and vehicle speed logged during operation on the dynamometer during
one pass through the Urban Dynamometer Driving Schedule, followed by one pass through the Highway
Fuel Economy Test.
Figure 2. Battery current comprising the Simulated Honda Civic Hybrid Electric Vehicle Profile.
In order to further verify the efficacy of the profile, a standard Honda Civic NiMH battery pack was
instrumented and its operation logged in a Honda Civic HEV on the dynamometer performing
consecutive passes though the UDDS and the HWFET schedules. A typical voltage profile is shown in
Figure 3. These results were compared with those obtained when the same pack was operated under
SHCHEVP in the laboratory (Figure 4 and Figure 5). Figure 4 shows four repeats of SHCHEVP followed
by a simulated engine recharge. The engine recharge is required because the profile was designed so there
are slightly fewer Ah delivered during charge than discharge; therefore, there is a gradual reduction in
capacity. When the battery SOC drops below a specified level, a charge equivalent to 10% of the nominal
capacity is then delivered. Figure 5 shows the second of these four SHCHEVP cycles.
15Figure 3. Typical voltage behavior of a nickel metal hydride battery pack in a Honda Civic on
dynamometer during one pass through the Urban Dynamometer Driving Schedule, followed by one pass
through the Highway Fuel Economy Test.
Figure 4. Voltage of the nickel metal hydride battery pack in the laboratory operating under four
consecutive cycles of the Simulated Honda Civic Hybrid Electric Vehicle Profile.
16Figure 5. Voltage of the nickel metal hydride battery pack in the laboratory operating under one cycle of
the Simulated Honda Civic Hybrid Electric Vehicle Profile.
It can be seen that the voltage behavior of the battery operating in the vehicle (Figure 3) and in the
laboratory under the simulated profile (Figure 4 and Figure 5) are very similar. In addition, battery data
from five independent dynamometer runs were averaged and compared with that obtained from the
equivalent laboratory cycling. It was found that the energy delivered and accepted during both vehicle and
laboratory operation was virtually identical, thereby confirming that SHCHEVP mimics the drive cycles.
4.2 Task 2 – Assembly, Benchmarking, and Characterization of
Furakawa and East Penn UltraBattery Modules
One of the goals of this project is to compare the performances of EPUBs with those of FUBs. Both
battery types have been characterized according to the following schedule:
1. Determination of capacity at different rates of discharge
2. Determination of internal resistance
3. Long-term testing under a simple HEV screening test
4. Hybrid Pulse Power Characterization testing, both before and after the simple HEV screening test.
4.2.1 Task 2.1 – Capacity of UltraBattery Modules
Each of the 10 FUBs and 16 EPUBs were subjected to the following cycling conditions:
1. Charge at 2.64 A for 10 hours (EPUB top-of-charge voltage [TOCV] = 13.98 V; FUB TOCV =
14.34 V)
2. Discharge at 8 A until 10.5 V
3. Repeat 1 and 2.
Results are shown in Table 1. It can be seen that the capacity of the EPUB modules (7.00 to 7.75 Ah)
was very similar to that obtained for the FUBs (7.1 to 7.5 Ah). It should be noted that the EPUBs had a
significantly higher float current for a given TOCV compared to the FUBS. As a result, a lower TOCV
(13.98 V) was used for the former than used for the latter (14.34 V).
17Table 1. Capacity and open-circuit voltage of East Penn UltraBattery and Furakawa UltraBattery
modules.
Capacity Open-Circuit
(Ah) Voltage on
EPUB Measured at Measured at Arrival FUB Module Capacitya
Module East Penn ECOtalitya (V) (measured at ECOtality) (Ah)
A1 7.59 7.64 12.60 ETA-126 7.2
A2 7.41 7.54 12.60 ETA-127 7.2
A3 7.53 7.58 12.57 ETA-128 7.5
A4 7.68 7.47 12.63 ETA-129 7.3
A5 7.64 7.11 12.59 ETA-130 7.3
A6 7.62 7.23 12.60 ETA-131 7.5
A7 7.52 7.34 12.59 ETA-132 7.1
A8 7.41 7.12 12.61 ETA-133 7.3
A9 7.47 7.00 12.45 ETA-134 7.4
A10 7.64 7.75 12.58 ETA-135 7.3
A11 7.47 7.75 12.55 Average 7.3
A12 7.59 7.56 12.55
A13 7.73 7.52 12.58
A14 7.50 7.62 12.51
A15 7.46 7.71 12.58
A16 7.63 7.30 12.61
Average 7.55 7.41 12.57
a. The values shown are an average of three FUB values and two EPUBs values.
The capacity of an FUB and an EPUB module has been determined at various discharge rates and the
results are shown in Table 2 and Figure 6. It can be seen that the values obtained in this study are in
agreement with those obtained by CSIRO (Figure 6), although the capacity of the EPUB module is
slightly higher than that of the FUB unit at higher discharge rates.
Table 2. Capacity of typical UltraBattery packs at different discharge rates.
Discharge Current (A) End-of-Discharge Voltage (V) Capacity FUB (Ah) Capacity EPUB (Ah)
1.33 10.5 9.63 9.83
1.33 10.5 9.43 9.96
1.33 10.5 9.74 -
1.33 10.5 9.79 -
2.19 10.5 9.45 9.62
2.19 10.5 9.47 9.63
2.19 10.5 9.50 -
6.65 10.5 8.15 8.39
6.65 10.5 8.05 8.25
6.65 10.5 8.07 -
39.9 9.6 4.88 5.56
39.9 9.6 4.65 5.29
39.3 9.6 4.56 -
187
6
Discharg e tim e (h)
5
4
Values from this
3 study
CSIRO values
2
1
0
1 10 100 1000
Discharge current (A)
Figure 6. Discharge time of Furakawa UltraBattery modules for a range of discharge current.
4.2.2 Task 2.2 - Resistance and Open-Circuit Voltage – State-of-Charge
Relationship of UltraBattery Packs
The discharge resistance and open-circuit voltage (OCV)-SOC relationship of the UltraBattery packs
were determined using the following procedure:
1. Charge at 2.64 A for 10 hours (TOCV FUB = 14.34 V; TOCV EPUB = 13.98 V).
2. Discharge at 8 A for 6 minutes.
3. Rest for 90 seconds, measure OCV.
4. Discharge at 40 A for 2 seconds and then calculate resistance.
5. Repeat Steps 2 through 4 until 10.5 V reached during Step 2.
6. Repeat Steps 1 through 5 a total of three times.
The OCV-SOC (after 90 seconds rest) and resistance values determined are shown in Table 3 and
Table 4. (Note that values did not vary significantly between batteries; therefore, data in Table 3and
Table 4 are for a typical module.) The internal resistance was calculated after a discharge step and is
termed the discharge resistance. This is significant because resistance values calculated after a discharge
will differ markedly from those calculated after a charge. The discharge resistance of both types of
UltraBattery packs was very similar (as shown in Table 3 and Table 4). In a fully charged state, the
resistance of both technologies was between 14 to 15 mΩ. This did not change significantly until the SOC
decreased to 40%, at which point it increased to 16 to 18 mΩ. At 10% SOC, the resistance increased to 26
to 28 mΩ. The resistance and OCV-SOC values are in good agreement with those obtained by CSIRO for
the FUBs (Figure 7).
Table 3. Typical internal discharge resistance and open-circuit voltage-state of charge for an East Penn
UltraBattery module and cell (determined by ECOtality).
Percent SOC Resistance of Module (mΩ) Resistance Per cell (mΩ) OCV
90 14 2.3 12.75
80 14 2.4 12.57
70 14 2.4 12.47
60 15 2.5 12.33
19Table 3. (continued).
Percent SOC Resistance of Module (mΩ) Resistance Per cell (mΩ) OCV
50 15 2.6 12.20
40 16 2.7 12.05
30 18 3.0 11.91
20 21 3.5 -
10 28 4.7 -
Table 4. Typical and internal discharge resistance and open-circuit voltage-state of charge for a Furakawa
UltraBattery module and cell (determined by ECOtality).
Percent SOC Resistance of Module (mΩ) Resistance Per cell (mΩ) OCV
90 15 2.4 12.68
80 15 2.4 12.55
70 15 2.5 12.41
60 16 2.6 12.29
50 16 2.7 12.17
40 18 2.9 12.05
30 19 3.1 11.90
20 22 3.6 -
10 26 4.4 -
Figure 7. Internal resistance of a Furakawa UltraBattery module (measured at the Commonwealth
Scientific and Industrial Research organization).
204.2.3 Task 2.3 - Benchmarking of UltraBattery Modules Under the Simple
Hybrid Electric Vehicle Screening Test
UltraBattery modules have been tested under the simple HEV screening test that has the following
steps:
1. Discharge at 1 cycle for 30 minutes (until approximately 50% SOC is reached).
2. Rest for 10 seconds.
3. Charge at 2 cycles for 60 seconds; terminate test if voltage hits 17.5 V.
4. Rest for 10 seconds.
5. Discharge at 2-cycle A for 60 seconds; if battery temperature exceeds 50°C (122°F), cycling is
suspended until the temperature drops to 49.5°C (121.1°F).
6. Repeat Steps 2 through until the voltage during Step 5 drops to 11.5 V (at approximately 40% SOC)
and then go to Step 7.
7. Rest for 10 seconds.
8. Charge at 2 cycles with a TOCV of 15 V until the equivalent of 2 cycles for 60 seconds has been
returned.
9. Rest for 10 seconds.
10. Discharge at 2-cycles A for 59.1 seconds; if battery temperature exceeds 50°C (122°F), cycling is
suspended until the temperature drops to 49.5°C (121.1°F).
11. Repeat Steps 7 through 10 one hundre3d times (note that changing the discharge time from
60 seconds to 59.1 seconds results in the SOC of the cell increasing by 5% over the 100 repeats), then
go back to Step 2.
The schedule is based on a profile used extensively in past ALABC projects; however, in this work it
has an additional step that maintains the SOC above 40%, rather than allowing it to slowly decrease to
0%. This modification is considered to more closely mimic what happens to batteries in vehicles in the
field; therefore, it allows a more accurate assessment of the susceptibility of batteries to the problem of
negative electrode polarization. The results for the UltraBattery modules and a standard lead acid battery
(the Genesis model manufactured by EnerSys) are shown in Figure 8 through Figure 10.
Figure 8 summarizes the results for the Genesis battery and displays three lines. The blue (bottom)
line represents the battery voltage taken at the end of the 1-minute discharge periods (i.e., at the end of
Step 5 or Step 10 above), which is termed end-of-discharge voltage (EODV). The red (middle) line is
simply the temperature of the battery, as measured via a thermocouple attached to the side of the battery
(and covered with a small piece of insulating foam). The green (top) line represents the battery voltage
taken at the end of the 1-minute charge periods (i.e., the end of Step 3 or Step 8 above), which is the
TOCV. The TOCV values are the highest voltages achieved during charging. These are of significance
because the level to which they rise is a direct indication of how susceptible the particular technology is to
negative plate polarization. This polarization is important, because it is the major problem with the use of
lead-acid batteries in HEVs. If excessive, it results in a drop in the charging efficiency of the system,
which causes an increase in fuel consumption.
The EODV (blue, bottom line) started at 12 V and slowly decreased during 2,700 cycles until it
reached 11.5 V (at approximately 40% SOC). At this point, Step 10 was activated, which resulted in a
gradual increase in SOC of 5% over the following 100 cycles. (Note that for the sake of clarity, the data
during these 100 steps are not shown.) When the profile restarted at Step 2, the EODV had risen by
approximately 200 mV, and the gradual decrease in EODV recommences, although the time taken to
21reach 11.5 V was now less as the SOC started at approximately 45%, rather than the 50% at the
commencement of cycling. This process continued for 11 of these SOC corrections, at which stage the
TOCV reached 17.5 V (not shown on graph) and cycling was terminated (after 6,273 HEV cycles). In
effect, the number of SOC corrections in relation to the total number of cycles performed
(573 cycles/corrections) can be used as a simple measure of the charging efficiency of the battery under
these cycling conditions.
Figure 8. Voltage and temperature of Genesis module under the hybrid electric vehicle screening test.
Figure 9. Voltage and temperature of the Furakawa UltraBattery module under the hybrid electric vehicle
screening test.
2217 100
90
16
Module temperature (C)
80
15 70
Module voltage
60
14
50
13
40
12 30
20
11
10
10 0
0 5000 10000 15000 20000 25000 30000 35000
Number of HEV cycles
Figure 10. Voltage and temperature of the East Penn UltraBattery module under the hybrid electric
vehicle screening test.
The temperature of the battery (red, middle line) was 25°C (77°F) at the start of cycling, but increased
quickly to 40°C (104°F) within 170 cycles. The temperature then continued to rise gradually and had
reached over 50°C (122°F) when cycling was stopped. Temperature monitoring performed by ECOtality
in the field has shown that in-car temperatures can reach 60°C (140°F) if left in the sun on a black tarmac
during summer. Operating temperatures at this level will undoubtedly affect battery life; it is considered
that effective temperature management will be a crucial aspect of ensuring the success of this technology
in HEVs. Indeed, this issue will be even more important for lithium-ion battery systems.
The TOCV (green, top line) started at approximately 13.5 V and then increased to 16 V within the
next 1,000 cycles. It then remained at approximately 16 V until the completion of 2,700 cycles, at which
point the EODV had dropped to 11.5 V (approximately 40% SOC) and an SOC adjustment was activated
(i.e., Step 10). When normal cycling restarted, the TOCV jumped immediately to 16.8 V and then
decreased to 16.5 V over the next 50 cycles. During the 11 SOC corrections experienced by the battery,
the TOCV continued this upward zigzag behavior, until the 17.5-V cut-off was activated after
6,273 cycles. The initial capacity of the battery was 9 Ah, but this had dropped to just 5.6 Ah at the
completion of cycling.
The voltage behavior of the FUB and EPUB modules (Figure 9 and Figure 10) followed the same
general trends as the Genesis battery (Figure 8). However, there were several notable differences:
231. The FUB and EPUB performed many more cycles than the Genesis and were still in good condition
at the end of testing.
FUB: 32,000 cycles Initial capacity = 7.3 Ah Final capacity = 6.0 Ah
EPUB: 32,000 cycles Initial capacity = 7.5 Ah Final capacity = 7.0 Ah
Genesis: 6,273 cycles Initial capacity = 9.0 Ah Final capacity = 5.6 Ah
2. The FUB and EPUB performed more cycles before an SOC correction was required (especially the
EPUB).
FUB: 24 corrections over 32,000 cycles (1,333 cycles per correction)
EPUB: 12 corrections over 32,000 cycles (2,666 cycles per correction)
Genesis: 11 corrections over 6,273 cycles (570 cycles per correction)
3. The TOCV after an SOC correction and the overall average TOCV was much lower for the FUB and
EPUB.
FUB: Average TOCV less than 14.0 V Maximum TOCV = 16 V
EPUB: Average TOCV less than 14.5 V Maximum TOCV = 16.2 V
Genesis: Average TOCV greater than 16.0 V Maximum TOCV = 17.5 V
In summary, the FUB and EPUB are very resistant to polarization during HEV duty relative to
standard lead-acid, valve-release technology. The capacity and overall performance of the UltraBattery
packs changed little during cycling (32,000 cycles), whereas the Genesis battery was considered to have
failed after just 6,273 cycles. However, the UltraBattery packs do still experience the phenomenon of
polarization, especially after a charging SOC correction, albeit to a much lower extent than that of
standard lead-acid technology. However, with proper SOC management, this effect could be controlled.
4.2.4 Task 2.4 – Hybrid Pulse Power Characterization Testing of UltraBattery
Modules
The performance of FUB, EPUB, and Genesis 12-V modules have been evaluated according to the
Hybrid Pulse Power Characterization test schedule, as used in the FreedomCAR and AVTA program. The
most relevant results are those for available charge and discharge power; these are shown in Figure 11
through Figure 13, both before and after simple HEV testing. (Note that a complete summary of the
Hybrid Pulse Power Characterization test results is shown in the appendices of this document.)
Figure 11 shows the available 10-second charge and discharge power for the FUB module at various
SOCs. The two upper lines represent the 10-second discharge power that the battery can deliver both
before and after testing, while the two lower lines show the 10-second charge power that could be
accepted by the battery before and after testing. It can be seen that there is little difference within the pairs
of lines (i.e., between the data obtained before and after HEV cycling). It can be concluded that minimal
degradation of the battery has occurred as a result of the screening test, which is in agreement with the
results described above. As expected, the performance of the EPUB module (Figure 12) was similar to
that of the FUB module. By contrast, the Genesis module (Figure 13) deteriorated significantly as a result
of the HEV screening test.
24You can also read