Forecasting Intense Cut-Off Lows in South Africa Using the 4.4 km Unified Model - MDPI
←
→
Page content transcription
If your browser does not render page correctly, please read the page content below

climate
Article
Forecasting Intense Cut-Off Lows in South Africa
Using the 4.4 km Unified Model
Tshimbiluni Percy Muofhe 1,2, * , Hector Chikoore 3 , Mary-Jane Morongwa Bopape 4 ,
Nthaduleni Samuel Nethengwe 1 , Thando Ndarana 5 and Gift Tshifhiwa Rambuwani 4
 1    Department of Geography and Geo-Information Sciences, University of Venda, Thohoyandou 0950,
      South Africa; nthaduleni.nethengwe@univen.ac.za
 2    Global Change Institute, University of the Witwatersrand, Johannesburg 2000, South Africa
 3    Unit for Environmental Sciences and Management, North-West University, Vanderbijlpark 1900,
      South Africa; 32945280@nwu.ac.za
 4    South African Weather Service, Private Bag X097, Pretoria 0001, South Africa;
      mary-jane.Bopape@weathersa.co.za (M.-J.M.B.); Gift.Rambuwani@weathersa.co.za (G.T.R.)
 5    Department of Geography, Geoinformatics and Meteorology, University of Pretoria, Pretoria 0001,
      South Africa; thando.ndarana@up.ac.za
 *    Correspondence: 2385587@students.wits.ac.za

 Received: 11 August 2020; Accepted: 21 September 2020; Published: 7 November 2020

 Abstract: Mid-tropospheric cut-off low (COL) pressure systems are linked to severe weather,
 heavy rainfall and extreme cold conditions over South Africa. They occur during all the above
 and often result in floods and snowfalls during the winter months, disrupting economic activities
 and causing extensive damage to infrastructure. This paper examines the evolution and circulation
 patterns associated with cases of severe COLs over South Africa. We evaluate the performance of
 the 4.4 km Unified Model (UM) which is currently used operationally by the South African Weather
 Service (SAWS) to simulate daily rainfall. Circulation variables and precipitation simulated by the
 UM were compared against European Centre for Medium-Range Weather Forecast’s (ECMWF’s) ERA
 Interim re-analyses and GPM precipitation at 24-hour timesteps. We present five recent severe COLs,
 which occurred between 2016 and 2019, that had high impact and found a higher model skill when
 simulating heavy precipitation during the initial stages than the dissipating stages of the systems.
 A key finding was that the UM simulated the precipitation differently during the different stages of
 development and location of the systems. This is mainly due to inaccurate placing of COL centers.
 Understanding the performance and limitations of the UM model in simulating COL characteristics
 can benefit severe weather forecasting and contribute to disaster risk reduction in South Africa.

 Keywords: cut-off lows; circulation patterns; heavy precipitation; floods; forecast skill; unified model;
 GPM precipitation

1. Introduction
     Some of the major rain-producing weather systems over South Africa include cloud bands in
tropical-temperate troughs (TTTs) [1–3], cold fronts [4–6], cut-off lows (COLs) [7,8], tropical continental
lows [9,10], mesoscale convective systems [11] as well as landfalling tropical cyclones [12–14] from
the South West Indian Ocean. Whilst most of these systems have strong seasonality, South African
COLs occur throughout the year, with observed maxima in frequency of occurrence during the austral
autumn and spring seasons [7,15]. The peak season for COL events has also been observed to shift
from March–May to June–August, with location shifting from southwestern (~34◦ S) towards the
northeast of the subtropical southern Africa since the 1980s [7]. Thus, COL systems may be significant
contributors to winter rainfall over South Africa.

Climate 2020, 8, 129; doi:10.3390/cli8110129                                    www.mdpi.com/journal/climate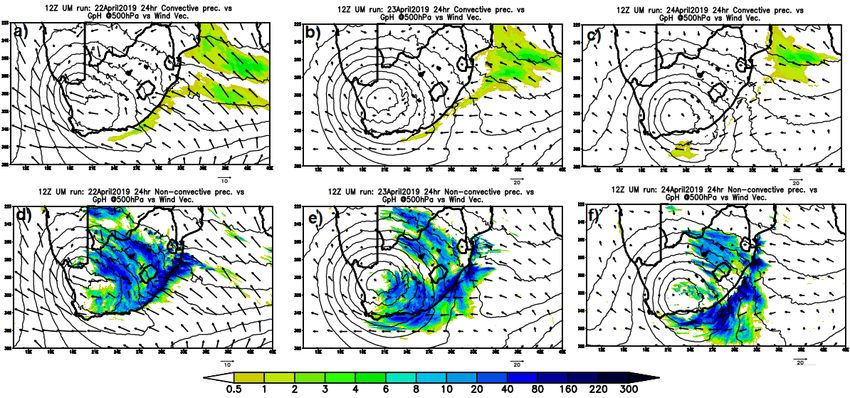
Climate 2020, 8, 129                                                                               2 of 20

     COLs are important synoptic-scale baroclinic systems typically known for their tempestuous
weather often resulting in heavy rainfall events and floods [8,16]. They tend to form and develop
over the mid-latitudes, on the equatorial-side of the tropospheric polar jet-stream ending up as closed
cyclones in the middle and upper troposphere. This occurs when the upper air system detaches from
the mean westerly flow of the mid-latitudes [17]. They are characterized by a cold-cored depression
that is produced by a westerly trough. This trough usually develops in the upper westerlies and
deepens to form a closed circulation which may extend to the surface [18,19]. This characteristic closed
circulation is induced by a high potential vorticity (PV) anomaly [20] that is caused by isentropic
transport of high PV stratospheric air, which in turn is associated with upper tropospheric Rossby wave
breaking processes [15]. Surface depressions may develop below these systems whilst cold air aloft
promotes deep convection and cloud development, resulting in persistent heavy rainfall. COLs may
also be associated with cold weather as they are often accompanied by ridging anticyclones that steer a
cold southerly airflow, facilitating moisture transport from the South West Indian Ocean [21–23].
     Several studies have detailed a climatology of COLs over southern Africa including their
geographical distribution, seasonality and frequency (e.g., [7,8,15,16]). A total of about 11 COLs
per year has been estimated to occur over southern Africa (24), often associated with strong surface
wind convergence and rising vertical motions, leading to high impact rainfall events causing floods.
They can produce 24-h rainfall totals which exceed the climatological monthly rainfall averages of an
area [24]. Typically characterized by slow movement, COLs may remain quasi-stationary over a region
for several days resulting in persistence of anomalous weather conditions. Often, the persistence and
slow-moving character of COLs is due to atmospheric blocking from the Mascarene High pressure
system over the South West Indian Ocean [25]. The study by [24] analysed a severe COL event over
the south coast of South Africa which caused heavy rainfall and flooding. They produced simulations
of the event using the Fifth-Generation Mesoscale Model (MM5) and found that warm sea surface
temperature enhanced low-level cyclogenesis whilst the coastal topography provided additional lifting.
     In other parts of the world, such as the European continent, the Mediterranean, Asia and
Australia, COLs are also associated with heavy precipitation which may persist for several days [26].
For instance, [27] found that most of the anomalous regional convective events which occur over
northern China are associated with the occurrence of COLs. In June and August 1998, COL events
led to record floods which caused severe damage to infrastructure and disruption of socio-economic
activities in northern China [28]. Over West Africa, a COL system led to rainfall of up to 116 mm in
24 h during the cool season from 9 to 11 January 1981 [16].
     Fewer COL studies have been undertaken in the Southern Hemisphere compared to the Northern
Hemisphere (e.g., [18]). This includes the lack of studies that have considered the effects of topography
as well as the influence of mid-latitude storms on COLs, which have been investigated in different
locations in the Northern Hemisphere (e.g., [29]). These aspects of COLs have not been considered
in South Africa, particularly in respect of operational model context. This has led to a lack of
understanding of the reasons that underpin the inaccuracies associated with operational model
forecasts over the country.
     The deep moist convection that is associated with COLs may lead to heavy rainfall and cold
conditions. It is therefore important to accurately forecast the area of deep moist convection in COLs
with adequate lead time in order to provide ample warning to the public and disaster management
authorities to prevent loss of life. Numerical Weather Prediction (NWP) models are the main tools
used to forecast weather up to a few days in advance (short to medium term timescale). The spatial
resolution used by these models affects the skill with which they can simulate different atmospheric
features. The latest generation of global NWP systems used for this time range are currently running
with grid spacings of less than 20 km at major international meteorological centers. For example,
the European Centre for Medium-Range Weather Forecasts (ECMWF) runs its Integrated Forecasting
System (IFS) with a grid spacing of 9 km, while the United Kingdom Met Office (UKMO) runs the
Unified Model (UM) Global Atmosphere with a grid spacing of 10 km [30]). All these have been shown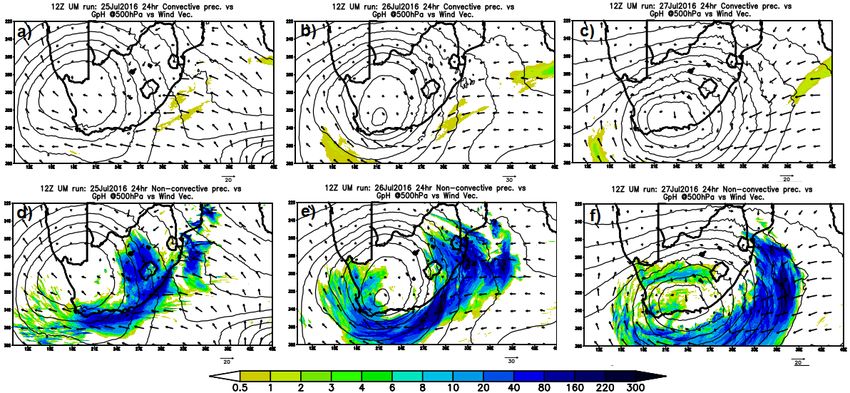
Climate 2020, 8, 129                                                                              3 of 20

to predict COLs with improved accuracy from the generation of NWP models that precede them,
which had a larger grid spacing.
      The reason for the above is that high-resolution models are able to resolve mesoscale features and
with convection being represented explicitly instead of parameterization schemes. Several studies
have demonstrated better representation of convectional weather systems as the grid space is reduced
towards 1 km [31,32]. Although regional NWP models can provide improved forecasts, there is still a
need to improve the realistic capability of these models to simulate cumulus convection accurately
mostly over the steep topography and regions of South Africa [33]. Simulation of convective rainfall
by NWP models is known to have relatively large biases which may lead to inaccurate forecasts.
Known challenges include the overestimation of rainfall over complex topography, early convection
initiation and a lack of severity in simulated thunderstorms (e.g., [34]).
      Sharma et al. [35] established that the UM overestimates the Indian monsoon summer rainfall due
to a greater number of rainy days. They also found the events to be displaced towards the west or south
west by an average 1◦ distance in the south west region of India. Sharma et al. [35] determined that the
UMs with a grid length of 4 and 1 km initiate convection later than the 12 km model, which initiated
convection about 1 to 2 hours earlier than observed. They found too few and too large cells in the 4 km,
which they attributed to convection not being resolved. Chan et al. [36] found the UM with a grid
spacing of 1.5 km to reproduce the heavy rainfall events in the UK better than the 12km model which
tended to produce “grid-point” storms. Prakash et al. [37] showed that reducing the global model grid
spacing from 22 km to 17 km improved the simulation of the Indian monsoon rainfall. Stein et al. [38]
evaluated the performance of the UM with a grid spacing of 10, 4.4 and 1.5 km over South Africa
and found the 4.4 model to delay in simulating clouds by 1 to 2 hours compared to the 1.5 km model.
They found the 4.4 and 1.5 km models to perform better than the 10 km one in terms of rainfall spatial
patterns, rainfall rate distribution and diurnal cycle, and additionally to be largely indistinguishable
when considering the temporal and spatial scales of rainfall.
      When analyzing the systematic properties of the 12, 4 and 1 km UM resolutions in simulating
rainfall over convective cases over southern England, [39] found that 4 and 1 km resolutions
simulate more realistic-looking precipitation as convection is represented explicitly instead of being
parameterized. However, the 4 km model tends to perform differently depending on whether the
convective parameterization scheme is present or not. Without convective parameterization, the model
delayed convective initiation but produced too much rainfall later due to the large grid length which
was unable to reproduce the convection explicitly. When the standard convective parameterization
is included, the model tends to underestimate the intensity of rainfall as the parameterization may
remove instability in the showers [39]. When analyzing the amount of rainfall over the Indian summer
monsoon region, the 4 km model simulated higher rainfall when compared with Global Precipitation
Measurement (GPM) and the 1.5 km model [40]. Inaccurate simulation of rainfall in the 4 km when
compared with 1.5 km has been possibly associated with poor moisture conservation promoting
extreme rainfall [41].
      The aim of this study is to analyze cases of severe COLs that were forecast by the operational
NWP system at the South African Weather Service in order to identify reasons for the inaccuracies in
the forecasts, with the aim of eventually improving this system. The paper is structured as follows:
in Section 2 the Data and Methods are presented and the analysis of the COLs cases is provided in
Section 3. Section 4 gives the conclusions.

2. Data and Methods

2.1. Methodology
     We present the structure, evolution and characteristics of COLs over South Africa using case
studies. To evaluate the performance of the UM in simulating the location of deep moist convection and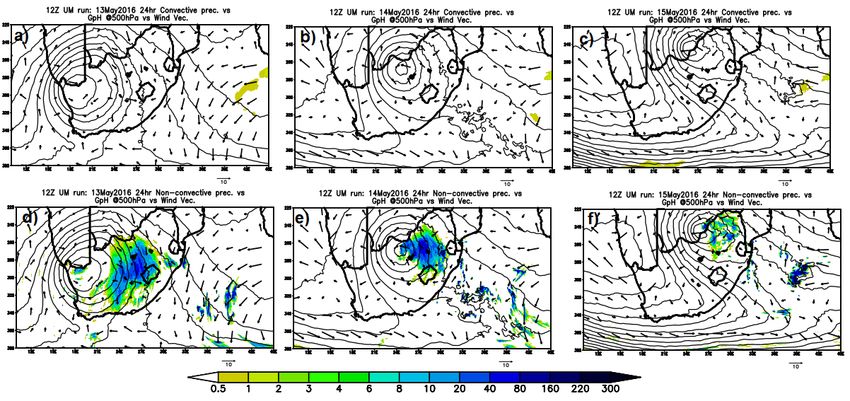
Climate 2020, 8, 129                                                                               4 of 20

heavy rainfall, this paper examined five recent (2016–2019) severe COL events which were associated
with anomalous meteorological structures, extreme rainfall and high impacts.

2.2. Observed and Reanalysis Data
     Key variables associated with the study of COLs include precipitation, mean sea level pressure,
geopotential heights, winds, vertical velocities, divergence and potential vorticity [42]. Reanalysis
datasets from the European Centre for Medium-Range Weather Forecasts (referred to as ERA Interim)
were used to analyze COL characteristics over South Africa for the period 2016–2019. We analysed
circulation variables from the ERA Interim reanalysis [43] which are available at a spatial resolution of
about 80 km. Daily geopotential height fields in the mid-troposphere (~500 hPa) were used to identify
closed centers associated with the occurrence of COLs. Daily fields of vertical velocity (omega, DP/Dt)
were used to investigate the location of rising motion in the COL to account for the skill of the model.
Areas of negative values of omega coincide with regions where uplift is taking place. GPM data from
the National Aeronautics and Space Administration (NASA) was used to evaluate the performance of
the model in simulating the location and amounts of rainfall during the five COL events.

2.3. Model Description and Forecasts
      The SAWS runs the UKMO UM [44] as its main operational NWP model, which is driven by
initial and lateral boundary conditions from the Met Office global model. The regional model is run
with a grid spacing 4.4 km over the southern Africa domain. The UM outputs (from the equator
to 38◦ S) are also available to national met services in southern Africa for their own severe weather
forecasting under a WMO initiated Severe Weather Forecasting Demonstration Project. The SAWS
updates the UM forecasts four times daily, with the 00h00, 06h00, 12h00 and 18h00 UTC analyses forced
by data from the Global Atmosphere (GA) version 6.1 (GA6.1) [30]. The science suite used is similar
to the one used by the Met Office in the European regional model (Euro4) [45]. The configuration
uses a convection scheme based [46] in a restricted way, while the microphysics scheme is based on
an adaptation of [47], which includes prognostic rain and graupel [48]. In addition to describing the
event from the observations, simulations from the UM are also evaluated in this study. Since these
simulations are produced on an operational basis at SAWS, they are part of the actual input information
that forecasters used to forecast and inform the public about these COL events.
      We analysed the model simulated geopotential heights at 500 hPa and precipitation from
simulations initiated with the 12 UTC analyses. The 24-hour precipitation simulations from the
4.4 km UM are compared with the GPM calibrated precipitation estimates using the visual inspection
technique. This technique involves comparing simulations with observation all together to determine
the accuracy of the model [49]. The study focuses on the performance of the model based on amount,
location and timing of geopotential heights and extreme rainfall associated with COLs.

2.4. Topography
     South Africa is characterized by a complex topography which can influence the atmospheric
circulation and modify characteristics of COL events. From the north there is a steep escarpment,
which runs from the Soutpansberg region, becoming Drakensberg over the south eastern regions,
and the northern parts of the Eastern Cape Province (Figure 1). Over Lesotho there are the Maluti
Mountains, which peak at altitudes of over 3 km. This sharp escarpment gives rise to enhanced
orographic lifting of surface winds and plays a significant role when COLs are located above these
large topographic gradients. The eastern escarpment of South Africa and Lesotho can interact with a
low-level flow of westerly waves and enhance the ascent of moist air through topographic lift [50].
When the frontal systems move near or over complex terrain, the poleward flow of warm-sector air
tends to rise leading to the development of precipitating cloud with high rainfall over the ridges
and lower in the valleys [51]. The precipitation is often accelerated by the moist air from low-level
pressure ahead of the system. As a result, the eastern escarpment region is often characterized by deep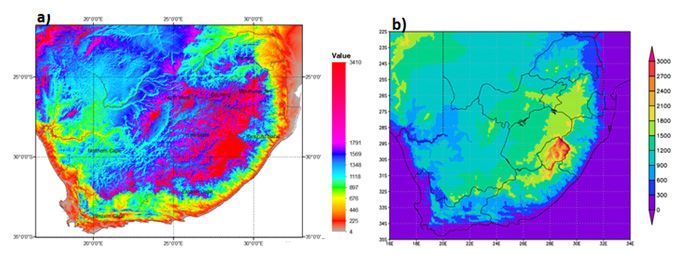
Climate 2020, 8, 129 5 of 20
Climate 2020, 8, x FOR PEER REVIEW 5 of 21
convection and highand
deep convection annual
highrainfall
annual totals [33].
rainfall Whilst
totals [33]. the UMthe
Whilst model
UM topography closelyclosely
model topography resembles
the reality, some
resembles thelocal peaks
reality, someare notpeaks
local veryare
well
notresolved
very well(Figure 1b).
resolved (Figure 1b).
Figure 1. The
Figure Shuttle
1. The Radar
Shuttle RadarTopography
Topography Mission (SRTM)from
Mission (SRTM) fromNASA
NASA(a)(a)
vs.vs. Unified
Unified Model
Model (UM)(UM)
topography
topography (b) (b)
(in (in meters)
meters) overSouth
over SouthAfrica.
Africa.
3. Results
3. Results
3.1. Event of 13–15
3.1. Event May
of 13–15 2016
May 2016
A cut-off
A cut-offlowlowsystem system was wasobserved
observed over
overSouth
SouthAfrica
Africa between
between thethe13–15th
13–15thofofMayMay 2016,
2016, andand
thisthis is
confirmed by theby
is confirmed satellite imagery
the satellite [52]. The
imagery [52]. core
The andcore upper
and upper levellevel
circulation associated
circulation with
associated thethe
with system
was system was wellby
well observed observed by theimage
the satellite satellite image
over theover
north thewestern
north western
parts of parts
theof the country.
country. The
The weather
weather
system led to system
heavy ledrainfall
to heavy ofrainfall
between of between
25 and 10025 andmm 100over
mmtheovernorthern
the northern
andand central
central parts
parts of the
of the country as it remained quasi-stationary during its development
country as it remained quasi-stationary during its development stages. The system also led to the cool stages. The system also led to
the cool to cold conditions over the eastern half of the sub-continent.
to cold conditions over the eastern half of the sub-continent.
Through the use of the reanalysis geopotential height at 500 hPa, the core of the system was
Through the use of the reanalysis geopotential height at 500 hPa, the core of the system was
clearly identified covering the north western parts of the country on the 13th of May, extending into
clearly
the identified
Atlantic Ocean covering
(Figure the2a).north
Over western
its easternparts
flank,ofthethe country
system wason the 13th ofbyMay,
accompanied extending
negative values into
the Atlantic Ocean (Figure 2a). Over its eastern flank, the system was accompanied
of vertical velocity (~ −0.3 Pa/s) indicating an area of low-level convergence and uplift of moisture. by negative values
of vertical
The model velocity
simulated(~−0.3 thePa/s)
centerindicating
of the system an area of low-level
covering convergence
the most north and uplift
western parts of the of moisture.
country
The (Figure
model simulated
2d). Rainfallthe centerbetween
amounts of the system
10 and 38 covering the most
mm associated withnorth western
the system wereparts of theover
observed country
(Figure 2d). Rainfall
the central and northernamounts partsbetween 10 and spreading
of the country, 38 mm associated with the system
to the south-eastern parts ofwere observed
Botswana
over(Figure 2g). The
the central andmodelnorthern simulated
parts rainfall of between
of the country, 10 and 40tomm
spreading the over the central parts
south-eastern parts ofof South
Botswana
Africa (Figure 2d). Over the area of deep moist convection
(Figure 2g). The model simulated rainfall of between 10 and 40 mm over the central parts and rainfall between 38° S and 20° S, of
andSouth
along the 25° E longitude, the model simulated the diurnal cycle
Africa (Figure 2d). Over the area of deep moist convection and rainfall between 38 S and 20◦ S, rainfall peak of 38 mm between
◦ 29°
S and 31° S (Figure 2j). At the same time, the highest observed rainfall of 40 mm was observed
and along the 25◦ E longitude, the model simulated the diurnal cycle rainfall peak of 38 mm between
◦ between ◦27° S and 29° S (Figure 2j). This suggests that the UM model slightly underestimated the
29 S and 31 S (Figure 2j). At the same time, the highest observed rainfall of 40 mm was observed
rainfall by about 2 mm and placed it 2° southward than the actual longitudinal co-ordinate.
betweenThe 27◦ core
S and 29◦COL
of the S (Figure
shifted2j). This suggests
eastwards to lie overthat
the the UM model
far central northernslightly underestimated
parts of the country on the
rainfall by about 2 mm and placed it 2◦ southward than the actual longitudinal co-ordinate.
14 May (Figure 2b). At this stage, the system was characterized by enhanced uplift over its eastern
The The
side. coreUM of the COL shifted
simulation for theeastwards
14 May locatedto lietheover
coretheoffar
thecentral
system northern parts ofparts
over the northern the country
of the on
14 May (Figure
country 2b). At(Figure
as observed this stage, the model
2e). The system was characterized
simulated by enhanced
rainfall of between 30 and 64 uplift overcentral
mm over its eastern
side.parts
The whilst
UM simulation for the was
the actual rainfall 14 May located
observed the core
shifted overof thethe
farsystem over the
north-eastern northern
parts parts of the
of the country
(Figure
country 2e,h). When
as observed tracing2e).
(Figure the The
pointmodel
of the highest
simulated rainfall associated
rainfall with the
of between 30system
and 64between
mm over 20°central
S
and 38° S, and along the 27° E longitude, the model simulated maximum
parts whilst the actual rainfall was observed shifted over the far north-eastern parts of the country rainfall located between 26°
S and
(Figure 28° SWhen
2e,h). while tracing
the actual theobserved
point ofrainfall of 58 mm
the highest was associated
rainfall located betweenwith 21°
theSsystem
and 24°between
S (Figure20◦ S
2k).
and 38◦ S, and along the 27◦ E longitude, the model simulated maximum rainfall located between 26◦ S
and 28◦ S while the actual observed rainfall of 58 mm was located between 21◦ S and 24◦ S (Figure 2k).
The COL shifted to the north central parts of the country on the 15th of May (Figure 2c).
The location of the center of the system was simulated over the north-eastern parts of the country at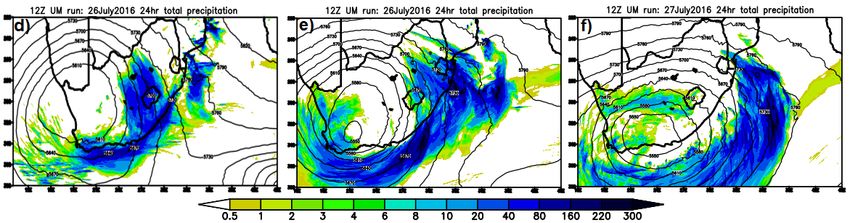
between the simulated and observed rainfall was less than 10 mm except for the last day where the
      model overestimated the rainfall by approximately 40 mm. Further, a comparison between
      convective and non-convective precipitation in the UM shows that a large percentage of the total
      precipitation is from the non-convective precipitation. This shows that for this COL case the total
      precipitation is influenced by the large scale vertical synoptic scale vertical uplift in the model (see
      top
Climate   panels
        2020, 8, 129in Figure 2 than it is influenced by the convection scheme (Figure 3). This suggests that 6 of 20
      the precipitation in the model is produced by means of microphysical processes in this case.
      Therefore, the microphysics scheme of the model is more important than the cumulus convection
this stage
      scheme, (Figure
                 and so2f).   The model
                         to improve         simulated
                                      the biases observed some    rainfall
                                                             in Figure     activity
                                                                       2j,k,l         towards
                                                                              the former  wouldthe   eastern
                                                                                                  have        parts of the
                                                                                                       to be adjusted
      to suite
country         local2f)
          (Figure     South  Africanlittle
                         although     conditions.
                                           rainfall activity was observed over the south eastern side of the COL
           Note
(Figure 2i).   Asthat   topography
                    a result,         does notrainfall
                              the observed       appearhadto be  playing
                                                               two  peaks,a critical
                                                                            over the role in this case
                                                                                       southern        because
                                                                                                   coast (33◦ Sof the30◦ E)
                                                                                                                and
and over the tip of the far north eastern part of the country (22 S and 30 E) (Figure 2l). The1).model
      location   of the vertical motion,   which  is largely  located to the  west
                                                                                ◦  of the  escarpment
                                                                                             ◦         (see Figure
      To attest to this observation, the rainfall amounts (bottom panels of Figure 2) are similar, it is the
placed the peak of the rainfall at 26◦ S and 30◦ E.
      timing of their occurrence that is different.

      Climate 2020, 8, x FOR PEER REVIEW                                                                       7 of 21

     FigureFigure   2. Geopotential
              2. Geopotential       heightatat500
                                 height        500hPa
                                                   hPa(thin
                                                       (thin black
                                                             black contours)
                                                                   contours)together  vertical
                                                                               together         velocity
                                                                                         vertical        (shaded)
                                                                                                    velocity (shaded)
           (a,b,c), at 12Z UM 24 h on the 13th, 14th and 15th May 2016. The second-row panels (d,e,f) show total
     (a–c), at 12Z UM 24 h on the 13th, 14th and 15th May 2016. The second-row panels (d–f) show total
           precipitation (shaded) and geopotential height at 500 hPa, at the same as time as in the top panels.
     precipitation (shaded) and geopotential height at 500 hPa, at the same as time as in the top panels.
           The third-row panels (g,h,i) show the total precipitation and geopotential height at 500 hPa for the
     The third-row panels (g–i) show the total precipitation and geopotential height at 500 hPa for the ERA
           ERA Interim for the same time as in (a,b,c). The bottom panels (j,k,l) show model (blue curve) and
     Interim  for the same time as in (a–c). The bottom panels (j–l) show model (blue curve) and observation
           observation (orange curve) diurnal cycle precipitation for the same times as in (a,b,c).
     (orange curve) diurnal cycle precipitation for the same times as in (a–c).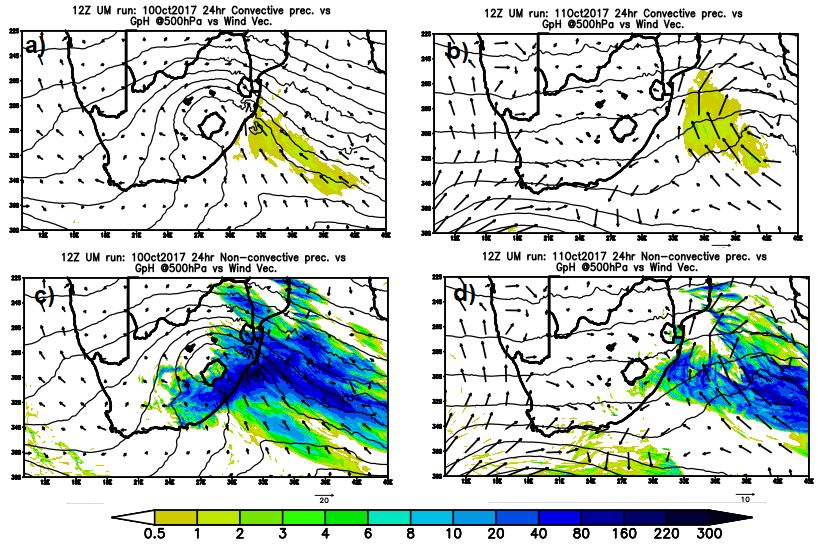
Climate 2020, 8, 129                                                                                               7 of 20

     During all the three days of the event, the model simulated the location of the highest rainfall south
of the actual location of the observed rainfall by 2◦ , 3◦ and 4◦ , respectively. The difference between
the simulated and observed rainfall was less than 10 mm except for the last day where the model
overestimated the rainfall by approximately 40 mm. Further, a comparison between convective and
non-convective precipitation in the UM shows that a large percentage of the total precipitation is from
the non-convective precipitation. This shows that for this COL case the total precipitation is influenced
      Figure 2. Geopotential height at 500 hPa (thin black contours) together vertical velocity (shaded)
by the large scale vertical synoptic scale vertical uplift in the model (see top panels in Figure 2 than it is
      (a,b,c), at 12Z UM 24 h on the 13th, 14th and 15th May 2016. The second-row panels (d,e,f) show total
influenced by the convection scheme (Figure 3). This suggests that the precipitation in the model is
      precipitation (shaded) and geopotential height at 500 hPa, at the same as time as in the top panels.
produced by means of microphysical processes in this case. Therefore, the microphysics scheme of the
      The third-row panels (g,h,i) show the total precipitation and geopotential height at 500 hPa for the
model is more important than the cumulus convection scheme, and so to improve the biases observed
      ERA Interim for the same time as in (a,b,c). The bottom panels (j,k,l) show model (blue curve) and
in Figure 2j–l the former would have to be adjusted to suite local South African conditions.
        observation (orange curve) diurnal cycle precipitation for the same times as in (a,b,c).

       Figure3.3.Geopotential
      Figure      Geopotentialheights
                                heightsatat 500
                                          500   hPa
                                              hPa    (thin
                                                  (thin    contours)
                                                         contours)    together
                                                                   together    with
                                                                             with    convection
                                                                                  convection      precipitation
                                                                                              precipitation     (a,b,c
                                                                                                             (a–c) at
      12Z UM 24 h on the 13th, 14th and 15th May 2016. Bottom panels (d–f) are for the same time as in (a–c)as
       ) at 12Z  UM  24 h  on the 13th, 14th  and 15th  May   2016. Bottom   panels (d,e,f) are for the same  time
       in for
      but (a,b,c )but for non-convective
              non-convective                precipitation.
                               precipitation. The vectors The   vectors
                                                            represent therepresent the wind
                                                                          wind vectors  at 10 vectors
                                                                                              m aboveatthe
                                                                                                         10ground.
                                                                                                             m above
       the ground.
     Note that topography does not appear to be playing a critical role in this case because of the
 3.2. Event
location  of of
             thethe 25–27 July
                  vertical      2016which is largely located to the west of the escarpment (see Figure 1).
                           motion,
To attest to this observation, the rainfall amounts (bottom panels of Figure 2) are similar, it is the timing
       Between 25 and 27 July 2016, a COL system was associated with strong winds over the central
of their occurrence that is different.
 parts of the country. The system was also associated with persistent cold conditions over the western
 parts
3.2.    of the
     Event      country
            of the        as well
                   25–27 July  2016as light snowfalls over the Nuweveld and Swartberg Mountain ranges
 [53]. Extreme weather conditions damaged vehicles, uprooted roofs and more than 200 people were
     Between
 treated         25 andin27the
          for injuries       July 2016, a COL
                               country’s       system
                                          central      wasProvince.
                                                  Gauteng   associated with
                                                                     Over   strong
                                                                          the southwinds  overinthe
                                                                                    east coast        central
                                                                                                    KwaZulu-
parts of the country. The system was also associated with persistent cold conditions over the western
parts of the country as well as light snowfalls over the Nuweveld and Swartberg Mountain ranges [53].
Extreme weather conditions damaged vehicles, uprooted roofs and more than 200 people were treated
for injuries in the country’s central Gauteng Province. Over the south east coast in KwaZulu-Natal,
the COL was associated with heavy rains and flash floods which caused mudslides, car accidents
and also flooded and collapsed several houses. Approximately three people were discovered buried
beneath 2 m of mud as several shacks were flattened by landslides [54].
     The core of the COL was located over the western parts of the country on the 25th July 2016 as
shown in the geopotential height plot at 500 hPa level (Figure 4a). The system was accompanied by
moisture uplift over its eastern side as indicated by negative values of vertical velocity (Figure 4a).
As observed, the model simulated the core of the system covering the northern and western parts of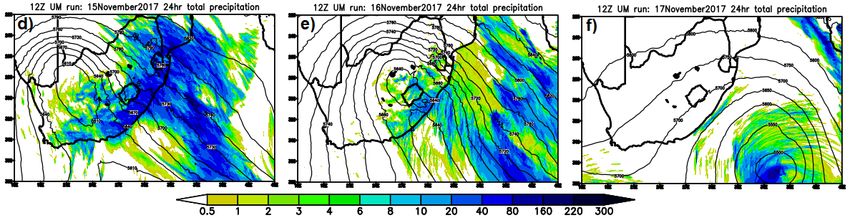
Climate 2020, 8, 129                                                                                                              8 of 20

the country (Figure 4d). As complemented by negative values of vertical velocity over the eastern side
of the system, the model accurately simulated the area associated with deep convection and heavy
rainfalls (Figure 4d). Rainfall amounts of between 40 to 120 mm were simulated over the central and
south-eastern parts of the country (Figure 4d) whilst the actual rainfall observed was also located over
the same regions of the country (Figure 4g). The precipitation timing plot for the first day between
38◦ S and   20◦2020,
        Climate  S, and     along
                     8, x FOR      the 26◦ E longitude, indicates that the model placed the rainfall
                              PEER REVIEW                                                       9 of 21peak of
220 mm between 34 S and 36◦ S while the actual rainfall peak of 120 mm was experienced at 31◦ S and
                         ◦
        precipitation
33◦ S (Figure   4j). forecasts are affected by the model microphysics and topography for COLs whose
          vertical uplift is located east of the escarpment.

               Figure 4. Geopotential height at 500 hPa (thin black contours) together vertical velocity (shaded)
      Figure 4. Geopotential height at 500 hPa (thin black contours) together vertical velocity (shaded) (a–c),
              (a,b,c), at 12Z UM 24 h on the 25th, 26th and 27th July 2016. The second-row panels (d,e,f) show UM
      at 12Z UM    24 h on the 25th, 26th and 27th July 2016. The second-row panels (d–f) show UM total
              total precipitation (shaded) and geopotential height at 500 hPa, at the same as time as in the top panels.
      precipitation   (shaded)
              The third-row       and(g,h,i)
                               panels   geopotential      height
                                              show the total       at 500 hPa,
                                                                precipitation andat  the same height
                                                                                   geopotential  as time     as in
                                                                                                        at 500     the
                                                                                                                 hPa fortop
                                                                                                                         the panels.
      The third-row    panels
              ERA Interim    for(g–i) show
                                 the same     theastotal
                                           time           precipitation
                                                    in (a,b,c). The bottomand   geopotential
                                                                             panels (j,k,l) showheight
                                                                                                  modelat    500curve)
                                                                                                          (blue   hPa for
                                                                                                                        andthe ERA
      Interim observation
              for the same  (orange
                               time curve)   diurnal
                                     as in (a–c).     cycle
                                                    The     precipitation
                                                         bottom    panelsfor  the show
                                                                            (j–l) same times  as (blue
                                                                                          model  in (a,b,c).
                                                                                                        curve) and observation
      (orange curve) diurnal cycle precipitation for the same times as in (a–c).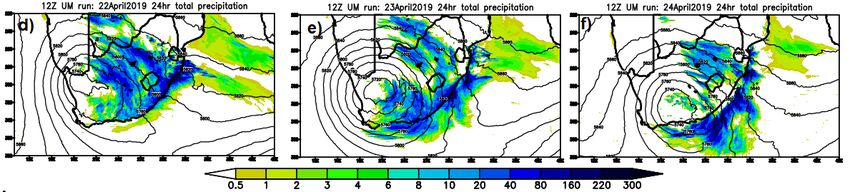
Climate 2020, 8, 129                                                                                               9 of 20

      On 26th July 2016, the center of COL was observed over the most northern parts of the country
(Figure 4b). The model simulated the center of the system more south compared to the observations
(Figure 4e,h). Coinciding with areas of enhanced uplift (Figure 4b), rainfall of between 60 to 220 mm
was simulated over the eastern and southern parts of the country (Figure 4e). The observation showed
rainfall amounts of between 100 to 300 mm over the eastern and southern parts with high figures
over the northern, central and the east southern parts of the country as well as in Lesotho (Figure 4h).
When analyzing the area which was associated with heavy precipitation between 38◦ S and 20◦ S,
and the 28◦ E longitude, the model simulated the peak of the 220 mm rainfall between 34◦ S and 36◦ S
whilst the actual peak of more than 300 mm rainfall was observed between 29◦ S and 31◦ S (Figure 4k).
      On 27th July 2016, the core of the system was located over the south-western and central parts
of the country, with the area where the most uplift is expected located over the south Indian ocean
(Figure 4c). The GPM rainfall estimate indicates the highest amount of rainfall over Mozambique,
with rainfall extending south into South Africa, where rainfall is observed over most of the southern
half of the country (Figure 4i). The model simulated the center of the system slightly covering the
south-western and eastern parts of the country with rainfall amounts of between 60 to 180 mm over
the central interior and western parts of the country (Figure 4f). When tracing the location of high
rainfall between 20◦ S and 38◦ S, and along the 30◦ E longitude, the model placed the peak of 180 mm
rainfall at 33◦ S while the peak of about 100 mm actual rainfall was observed at 30◦ S (Figure 4l).
      During the occurrence of this system the model also placed the location of the highest rainfall south
of the actual rainfall location by 3◦ , 4◦ , 3◦ for all three days, respectively. The model underestimated
the rainfall over the areas identified with highest figures within the country for the first two days but
overestimated the rainfall during the last day of the event. The UM simulated rainfall over the adjacent
oceans that according to GPM is observed over land for both the 26 and 27th of July 2016. This shows
the likely effect on the types of warnings forecasters issue where sometimes warnings are issued for
the locations or not issued at all because of the wrong placement of systems and rainfall in the model
simulations. This event also shows that the contribution of convective precipitation is too small in this
event relative to non-convective precipitation (Figure 5). It is also significant that all the convective
rainfall is being simulated off shore, over the southwest Indian Ocean.
     Climate 2020, 8, x FOR PEER REVIEW                                                                     10 of 21

           Figure 5. Geopotential heights at 500 hPa (thin contours) together with convection precipitation (a,b,c)
      Figure  5. Geopotential heights at 500 hPa (thin contours) together with convection precipitation (a–c) at
           at 12Z UM 24 h on the 25th, 26th and 27th July 2016 . Bottom panels (d,e,f) are for the same time as in
      12Z UM 24 h on the 25th, 26th and 27th July 2016. Bottom panels (d–f) are for the same time as in (a–c)
           (a,b,c) but for non-convective precipitation. The vectors represent the wind vectors at 10 m above the
      but for non-convective precipitation. The vectors represent the wind vectors at 10 m above the ground.
           ground.

     3.3. Event of 10–11 October 2017
          On 10th October 2017, a COL system associated with gale force winds up to 90 km/h and heavy
     rainfall flooded houses and roads, delayed flights, submerged cars and caused sink holes and
     accidents across much of the south eastern country, in KwaZulu-Natal [55]. This system was clearly
     identified as a COL by closed geopotential heights at 500 hPa located over the central parts of the
     country (Figure 6a). The uplift activity was observed in the eastern part of the COL which covered
     the eastern coastal area of the country as well as the South Indian Ocean (Figure 6a). The UM model
     simulated an upper-air trough covering the central and eastern parts of the country. Rainfall of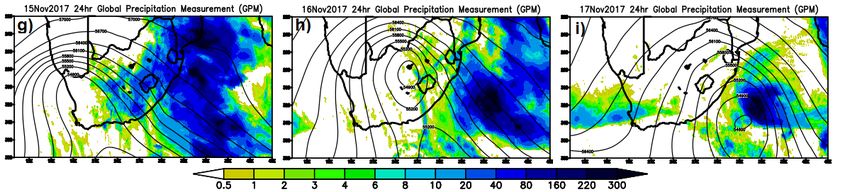
Climate 2020, 8, 129                                                                               10 of 20

     For this case the role of topography is quite clear as indicated by the large differences in the
maximum rainfall amounts. Because of the location of the vertical motion, relative to the escarpment
and the westward direction of the flow, vertical motion would be expected to be a combination of
synoptic dynamical processes and orographic uplift. The fact that the UM topography does not match
that which is observed, as it is less steep, means that the vertical motion in the model would be expected
to be weaker than observed. For that reason, the rainfall would be weaker. Therefore, precipitation
forecasts are affected by the model microphysics and topography for COLs whose vertical uplift is
located east of the escarpment.

3.3. Event of 10–11 October 2017
      On 10th October 2017, a COL system associated with gale force winds up to 90 km/h and heavy
rainfall flooded houses and roads, delayed flights, submerged cars and caused sink holes and accidents
across much of the south eastern country, in KwaZulu-Natal [55]. This system was clearly identified as
a COL by closed geopotential heights at 500 hPa located over the central parts of the country (Figure 6a).
The uplift activity was observed in the eastern part of the COL which covered the eastern coastal area
of the country as well as the South Indian Ocean (Figure 6a). The UM model simulated an upper-air
trough covering the central and eastern parts of the country. Rainfall of between 10 and 60 mm was
simulated spreading from the south-eastern parts of the country through Lesotho to the Indian Ocean
(Figure 6c). With a clearly visible low, observations also indicated high rainfall over the eastern parts
of the country extending to Mozambique and the Indian Ocean (Figure 6e). High rainfall activity
was observed located over the Indian Ocean (Figure 6e). When analyzing the location of the highest
precipitation within the country between 20◦ S and 38◦ S and the 30◦ E longitude, the model simulated
the peak of 80 mm rainfall located between 29◦ S and 32◦ S whilst the actual rainfall was also observed
between 30◦ S and 31◦ S (Figure 6g).
      On 11 October, the COL shifted to the South Indian Ocean (Figure 6b) as the model simulated the
upper trough over the Indian Ocean but with no rainfall over the country (Figure 6d). Most of the
rainfall activity was observed over the Indian Ocean during this stage (Figure 6f). Tracing the area
associated with deep convection and rainfall over the South Indian Ocean between 20◦ S and 38◦ S,
and along the 40◦ E longitude, the model simulated the highest rainfall of 85 mm between 31◦ S and
32◦ S while the observed rainfall peak of 80 mm was located between 28◦ S and 30◦ S (Figure 6h).
      During this event, the model placed the peak of the precipitation closer to the observation during
the first day but simulated the peak of the precipitation 3◦ south in relation to the actual location for
the observed peak. For the rainfall amount over the area of deep convection and rainfall, the model
overestimated the rainfall by 40 mm in the first day and by 5 mm in the second day (Figure 6g,h).
Again, the convective precipitation was simulated over the Indian Ocean (Figure 7), with non over the
land, most of the total precipitation was simulated due to non-convective or dynamic processes.
Climate 2020, 8, 129 11 of 20
Climate 2020, 8, x FOR PEER REVIEW 11 of 21
Figure 6. Geopotential height at 500 hPa (thin black contours) together vertical velocity (shaded) (a,b),
Figure 6. Geopotential height at 500 hPa (thin black contours) together vertical velocity (shaded)
at 12Z UM 24 h on the 10th and 11th October 2017. The second-row panels (c,d) show UM total
(a,b), at 12Z UM 24 h on the 10th and 11th October 2017. The second-row panels (c,d) show UM total
precipitation (shaded) and geopotential height at 500 hPa, at the same as time as in the top panels.
precipitation (shaded) and geopotential height at 500 hPa, at the same as time as in the top panels.
The third-row panels (e,f) show the total precipitation and geopotential height at 500 hPa for the ERA
The third-row panels (e,f) show the total precipitation and geopotential height at 500 hPa for the ERA
Interim for the same time as in (a,b). The bottom panels (g,h) show model (blue curve) and
Interim
observationsame
for the time
(orange as in diurnal
curve) (a,b). The bottom
cycle panels for
precipitation (g,h)
theshow
same model
times as(blue curve) and observation
in (a,b).
(orange curve) diurnal cycle precipitation for the same times as in (a,b).Climate 2020, 8, 129 12 of 20
Climate 2020, 8, x FOR PEER REVIEW 12 of 21
Figure
Figure 7. Geopotentialheights
7. Geopotential heightsat
at500
500 hPa
hPa (thin
(thincontours)
contours)together with
together convection
with precipitation
convection (a,b) (a,b),
precipitation
at 12Z UM 24 h on the 10th and 11th Oct. 2017. Bottom panels (c,d) are for the same time as in(a,b)
), at 12Z UM 24 h on the 10th and 11th Oct. 2017. Bottom panels (c,d) are for the same time as in (a,b) but
but for non-convective
for non-convective precipitation.
precipitation. The vectors
The vectors represent
represent the wind
the wind vectors
vectors at 10 at
m 10 m above
above the
the ground.
ground.
3.4. The Event of 15–17 November 2017
3.4. The Event of 15-17 November 2017
On 15th November 2017, a deep upper-air trough was observed over the western parts of South
On 15th November 2017, a deep upper-air trough was observed over the western parts of South
Africa (Figure 8a,g). This event was associated with rainfall activity to its east (10 to 50 mm), with most
Africa (Figure 8a,g). This event was associated with rainfall activity to its east (10 to 50 mm), with
of South Africa receiving rainfall triggered by this system (Figure 8g). The model simulated closed
most of South Africa receiving rainfall triggered by this system (Figure 8g). The model simulated
geopotential heights over
closed geopotential the central,
heights over theinterior
central,ofinterior
the country,
of the with
country,the with
centertheofcenter
the system
of the extending
system to
the borders of Botswana and Namibia (Figure 8d). Although the rainfall activity
extending to the borders of Botswana and Namibia (Figure 8d). Although the rainfall activity was was also observed over
the eastern parts over
also observed of the country,
the eastern high
parts rainfall was observed
of the country, overwas
high rainfall theobserved
South Indian
over theOcean,
Southspreading
Indian to
Mozambique (Figureto8g).
Ocean, spreading When analyzing
Mozambique (Figure the8g).performance
When analyzing of thethemodel in simulating
performance rainfall
of the model in over
simulating
the location of rainfall over the location
deep convection, of deep
the model convection,
simulated the model
a rainfall peaksimulated
of 50 mmawhich rainfallispeak
almost of 50
similar
mm
to the which is almost
observation, andsimilar
the modelto thealso
observation,
capturedand thethe model of
location alsothecaptured the location
event well (Figureof8j).the event
well
On (Figure
the 16th 8j).November, the core of the COL was observed over the central parts of the country.
On the 16th November, the
This enhanced the establishment ofcore of motion
rising the COLover
was the
observed
eastern over the central
coastal parts
parts of of the country.
the country (Figure 8b).
This enhanced the establishment of rising motion over the eastern coastal parts of the country (Figure
Rainfall amounts of between 10 and 20 mm were observed over the southern and eastern parts of
8b). Rainfall amounts of between 10 and 20 mm were observed over the southern and eastern parts
the country extending to the Mozambique Channel with higher falls over the South Indian Ocean
of the country extending to the Mozambique Channel with higher falls over the South Indian Ocean
(Figure 4h).4h).
(Figure TheThemodel
modelsimulated
simulated the
thecenter
centerofofthe
thesystem
systemlocated
located over the central
over the centralinterior
interiortowards
towards the
south-east of the country
the south-east (Figure
of the country 8e). Rainfall
(Figure of between
8e). Rainfall of between 10 and
10 and30 mm30 mm waswassimulated
simulated byby the
themodel
overmodel
the south-eastern
over the south-eastern coastal parts of the country into the Indian Ocean (Figure 8e). Over the area
coastal parts of the country into the Indian Ocean (Figure 8e). Over the
associated with deep
area associated withconvection, the model
deep convection, overestimated
the model overestimated the the
peak of the
peak observed
of the observedrainfall
rainfallby byup to
up to
20 mm 20 mm8k).
(Figure (Figure 8k).
On On17th17th November,
November, thethecenter
centerofof the
the COL
COL was
wasobserved
observed closer
closer to the south
to the easteast
south coastal areasareas
coastal of of
the country (Figure 8c). At this stage, the model also simulated the system
the country (Figure 8c). At this stage, the model also simulated the system located over the South located over the South
Indian
Indian Ocean
Ocean withwith rainfall
rainfall amounts
amounts ofofbetween
between10 10toto80
80mmmm near
near thethe center
center ofof the
thesystem
systemcovering
covering the
the western side of Madagascar (Figure 8f). The system was associated with rainfall amounts of
western side of Madagascar (Figure 8f). The system was associated with rainfall amounts of between 8
between 8 to 20 mm observed over the south-eastern coastal belts of South Africa. Rainfall amounts
to 20 mm observed over the south-eastern coastal belts of South Africa. Rainfall amounts of about
10 mm were also observed over the south east (Figure 8i). When analyzing rainfall over the area ofarea of deep moist convection between 20° S and 38° S, and along the 33° E longitude, the model
simulated the peak of 10 mm between 35° S and 37° S while the maximum rainfall was observed
between 30° S and 32° S (Figure 8l).
During this event, the model accurately simulated the location of the maximum precipitation
against
Climate 2020, 8,the
129observation except for the last day when the system was located over the ocean. The 13 of 20
model simulated the exact amount of the maximum rainfall over the area of deep convection during
the first day of the event. However, the model overestimated rainfall over the south-east belt during
deepthemoist
secondconvection
day whenbetween 20◦ was
the system S and 38◦ S,towards
moving and along
the the 33◦ As
ocean. E longitude,
in previousthe model
events, thesimulated
UM
modelofsimulated
the peak a small; 35
10 mm between ◦
amount ◦
S andof37convective
S while precipitation
the maximum over the adjacent
rainfall southwest
was observed Indian30◦ S
between
32◦ S (Figure
and Ocean (Figure 9).
8l).The non-convective component dominated the total precipitation, mainly over the
land.
Figure 8. Geopotential height at 500 hPa (thin black contours) together vertical velocity (shaded) (a–c),
at 12Z UM 24 h on the 15th, 16th and 17th November 2017. The second-row panels (d–f) show UM
total precipitation (shaded) and geopotential height at 500 hPa, at the same as time as in the top panels.
The third-row panels (g–i) show the total precipitation and geopotential height at 500 hPa for the ERA
Interim for the same time as in (a–c). The bottom panels show model (j–l) (blue curve) and observation
(orange curve) diurnal cycle precipitation for the same times as in (a–c).Climate 2020, 8, 129 14 of 20
During this event, the model accurately simulated the location of the maximum precipitation
Climate 2020, 8, x FOR PEER REVIEW 14 of 21
against the observation except for the last day when the system was located over the ocean. The model
simulatedFigure
the exact amount ofheight
8. Geopotential the maximum rainfall
at 500 hPa (thin blackover the area
contours) of deep
together convection
vertical during the first
velocity (shaded)
day of the(a,b,c),
event.at However,
12Z UM 24 hthe model
on the 15th,overestimated rainfall2017.
16th and 17th November overThethesecond-row
south-east belt (d,e,f)
panels during the second
show
day whenUM thetotal
system was moving
precipitation (shaded)towards the ocean.
and geopotential As at
height in500
previous events,
hPa, at the thetime
same as UM as model simulated
in the top
panels. The third-row panels (g,h,i) show the total precipitation and geopotential
a small; amount of convective precipitation over the adjacent southwest Indian Ocean (Figure 9). height at 500 hPa
for the ERA Interim
The non-convective for the same
component time as in
dominated the(a,b,c).
totalThe bottom panelsmainly
precipitation, show model
over(j,k,l)
the (blue
land.curve)
and observation (orange curve) diurnal cycle precipitation for the same times as in (a,b,c).
Figure
Figure 9. Geopotential
9. Geopotential heights
heights at 500
at 500 hPa
hPa (thincontours)
(thin contours) together
together with
withconvection
convectionprecipitation (a,b,c)
precipitation (a–c) at
12Z UM 24 h on the 15th, 16th and 17th Nov. 2017. Bottom panels (d–f) are for the same time as inas(a–c)
at 12Z UM 24 h on the 15th, 16th and 17th Nov. 2017. Bottom panels (d,e,f) are for the same time
in (a,b,c) but for non-convective precipitation. The vectors represent the wind vectors at 10 m above
but for non-convective precipitation. The vectors represent the wind vectors at 10 m above the ground.
the ground.
3.5. The Event of 22–24 April 2019
3.5. The Event of 22–24 April 2019
During the 2019 Easter weekend, the south eastern areas of South Africa in the vicinity of the
During the 2019 Easter weekend, the south eastern areas of South Africa in the vicinity of the
coastal city of Durban experienced severe flooding associated with a COL weather system. The system
coastal city of Durban experienced severe flooding associated with a COL weather system. The
led tosystem
extreme rainfall of between 150 to 200 mm within 48-hours [56], resulting in landslides, bursting of
led to extreme rainfall of between 150 to 200 mm within 48-hours [56], resulting in landslides,
the river banks
bursting andriver
of the collapsed
banks andbuildings
collapsed with more than
buildings with 70
morepeople losing
than 70 peopletheir lives
losing [57].
their The
lives storm
[57].
damaged
The storm damaged water pipes, washed away walls, uprooted electric poles and damaged healthwith
water pipes, washed away walls, uprooted electric poles and damaged health facilities
the repair costwith
facilities estimated at R650
the repair 000 000 [58].
cost estimated The000
at R650 weather system
000 [58]. was also
The weather associated
system was also with snow falls
associated
over the
withMaluti Mountains
snow falls over theon the border
Maluti Mountainsof Lesotho and South
on the border Africaand
of Lesotho with extremely
South low extremely
Africa with temperatures
low central
over the temperatures
parts over
of thethe central [59].
country parts of the country [59].
The development
The development of this
of this COLCOL waswasfirstly
firstlyidentified
identified by
by the
theclosed
closedgeopotential
geopotential heights
heightsat 500 hPa hPa
at 500
located over the western parts of South Africa on the 22nd of April 2019.
located over the western parts of South Africa on the 22nd of April 2019. The system was characterized The system was
characterized by negative values of vertical velocity of between −0.1 to −0.3 Pa/s indicating uplift of
by negative values of vertical velocity of between −0.1 to −0.3 Pa/s indicating uplift of moisture over
moisture over the system’s eastern flank (Figure 10a). The model simulated the core of the system
the system’s eastern flank (Figure 10a). The model simulated the core of the system located over
located over the north-western parts of the country, extending into Nambia (Figure 10d). The
the north-western parts of the country, extending into Nambia (Figure 10d). The simulated rainfall
simulated rainfall associated with the system was between 60 and 130 mm over the central interior
associated with the
of the country, into system
Botswana wasextending
betweento60theand 130Ocean
Indian mm over
coast the central
(Figure 10d).interior of the
The observed country,
spatial
into Botswana
distribution extending to the
of the rainfall Indian Ocean
is however larger coast (Figure
than the 10d).one
simulated The observed
(Figure 5g). spatial distribution of
the rainfall is however larger than the simulated one (Figure 5g).
When analyzing the rainfall over the area of deep convection as experienced on 22nd April
When
between analyzing
38° S and the
20° S,rainfall
and alongover thethe
27°area of deepthe
E longitude, convection as experienced
model simulated the maximum on 22nd April
rainfall
between 38◦mm
of 130 S and 20◦ S,between
to occur and along 26° the
S and27◦27° S while thethe
E longitude, actual maximum
model simulatedrainfall
the of 120 mm was
maximum rainfall
of 130observed
mm to between 25° S and2626°
occur between ◦ SSand
(Figure
27◦10j). Even the
S while though the maximum
actual model simulation almost
rainfall of 120 matches
mm was
that in the observation,
◦ the peak
◦ is higher in the model simulation. This
observed between 25 S and 26 S (Figure 10j). Even though the model simulation almost matches indicates that the model
overestimated rainfall at this stage. The observed rainfall is also more long-lived than the simulated
that in the observation, the peak is higher in the model simulation. This indicates that the model
rainfall (Figure 10j).
overestimated rainfall at this stage. The observed rainfall is also more long-lived than the simulated
rainfall (Figure 10j).For all three days the model placed the maximum rainfall south of the actual location of the
observed rainfall by 1°, 4° and 4°, respectively. For the first and second days, the model overestimated
rainfall by about 10 and 5 mm, respectively whilst it overestimated rainfall by 50 mm during the last
day of the event (Figure 10j,k,l). The model simulated convective precipitation running along
(offshore) the southeast coast for 22 and 23 April 2019, which was also close to the location of heaviest
Climate 2020, 8, 129 (Figure 11). As with the other events, the larger percentage was from non-convective or15 of 20
precipitation
dynamic processes.
Climate 2020, 8, x FOR PEER REVIEW 16 of 21
Figure
Figure 10. Geopotential
10. Geopotential height
height at 500
at 500 hPahPa (thin
(thin black
black contours)
contours) together
together vertical
vertical velocity
velocity (shaded)(a–c),
(shaded)
at 12Z UM 24 h on the 22nd, 23rd and 24th April 2019. The second-row panels (d–f) show show
(a,b,c), at 12Z UM 24 h on the 22nd, 23rd and 24th April 2019. The second-row panels (d,e,f) UM total
UM total precipitation
precipitation (shaded) and (shaded) and geopotential
geopotential height at height at 500
500 hPa, at hPa, at the as
the same same as time
time as inasthe
in top
the top
panels.
panels. Thepanels
The third-row third-row
(g–i)panels
show (g,h,i) show
the total the total Precipitation
Precipitation and geopotential
and geopotential Height atHeight
500 hPaat for
500 the
hPaERA
for the ERA Interim for the same time as in (a,b,c). The bottom panels (j,k,l) show model (blue curve)
Interim for the same time as in (a–c). The bottom panels (j–l) show model (blue curve) and observation
and observation (orange curve) diurnal cycle precipitation for the same times as in (a,b,c).
(orange curve) diurnal cycle precipitation for the same times as in (a–c).
On 23 April 2019, the core of the COL was located over the northern and western parts of South
Africa. Enhanced vertical motion associated with the development of complex cumulus congestus and
heavy rain showers was observed over the central parts of the country (Figure 10h). As shown by
observation, the center of the system was simulated over the western parts of the country. The pattern
of simulated rainfall was slightly different when compared to the observed (Figure 10e,h). Although the
model did not place the maximum rainfall over the observed location, the model simulated almost theClimate 2020, 8, 129 16 of 20
same amount of maximum rainfall to the observation between 38◦ S and 20◦ S, and along the 29◦ E
longitude (Figure 10k).
The core of the system shifted to lie over the western and central parts of the country on
24 April 2019 (Figure 10c). The system was associated with the persistence of south easterly winds at
a speed of about 20 knots which also promoted convergence and enhanced upliftment at this stage.
The model simulated the center of the system over south-eastern parts of the country and rainfall
which was closer to the observed rainfall pattern (Figure 10f,i). High rainfall amounts of between 30
and 80 mm were simulated over the central interior and south-eastern parts of the country (Figure 10f).
When tracing the area of deep moist convection and rainfall between 38◦ S and 20◦ S and the 33◦ E
longitude, the model placed the peak of 110 mm at 33◦ S whilst the actual maximum rainfall was
observed between 28◦ S and 30◦ S. At this stage, the model run overestimated rainfall (Figure 10l).
For all three days the model placed the maximum rainfall south of the actual location of the
observed rainfall by 1◦ , 4◦ and 4◦ , respectively. For the first and second days, the model overestimated
Figure 10. Geopotential height at 500 hPa (thin black contours) together vertical velocity (shaded)
rainfall by about 10 and 5 mm, respectively whilst it overestimated rainfall by 50 mm during the
(a,b,c), at 12Z UM 24 h on the 22nd, 23rd and 24th April 2019. The second-row panels (d,e,f) show
last day of the event (Figure 10j–l). The model simulated convective precipitation running along
UM total precipitation (shaded) and geopotential height at 500 hPa, at the same as time as in the top
(offshore) the southeast coast for 22 and 23 April 2019, which was also close to the location of heaviest
panels. The third-row panels (g,h,i) show the total Precipitation and geopotential Height at 500 hPa
precipitation (Figure 11). As with the other events, the larger percentage was from non-convective or
for the ERA Interim for the same time as in (a,b,c). The bottom panels (j,k,l) show model (blue curve)
dynamic processes.
and observation (orange curve) diurnal cycle precipitation for the same times as in (a,b,c).
Figure 11. Geopotential
Figure 11. Geopotentialheights
heightsatat500
500 hPa
hPa (thin
(thin contours)
contours) together
together withwith convection
convection precipitation
precipitation (a–c)
(a,b,c) at 12Z UM 24 h on the 22nd, 23rd and 24th April 2019. Bottom panels (d,e,f) are for
at 12Z UM 24 h on the 22nd, 23rd and 24th April 2019. Bottom panels (d–f) are for the same time as the same
time as in
in (a–c) (a,b,c)
but but for non-convective
for non-convective precipitation.
precipitation. The vectors
The vectors represent
represent the windthevectors
wind vectors
at 10 matabove
10 m
above the ground.
the ground.
4. Discussion and Conclusions
Mid-tropospheric COL pressure systems are some of the weather systems associated with severe
weather conditions, heavy rainfall and flooding over South Africa. It is important to understand COL
pressure systems for weather forecasting purposes [15], but also to determine the skill of NWP models
used to forecast them. Whilst an average of 11 COLs occur every year over southern Africa [60],
this paper analyzed five major events which occurred between 2016 to 2019 over South Africa and
caused significant damage and loss of lives. We evaluated the performance of the 12 UTC configuration
of the 4.4 km UM model in simulating the transit of COLs over parts of South Africa. The visual
inspection technique was used to compare the outputs of the UM model against observations from the
ECMWF ERA Interim re-analyses as well as GPM precipitation.You can also read