DEVELOPMENT AND VERICATION OF AN IOT-ENABLED AIR QUALITY MONITORING SYSTEM BASED ON PETRI NETS
←
→
Page content transcription
If your browser does not render page correctly, please read the page content below
Development and Veri cation of an IoT-Enabled Air Quality Monitoring System Based on Petri Nets Yi-Nan Lin Ming Chi University of Technology Sheng-Kuan Wang Ming Chi University of Technology Gwo-Jen Chiou National Formosa University Cheng-Ying Yang University of Taipei Victor R. L. Shen ( rlshen@mail.ntpu.edu.tw ) National Taipei University https://orcid.org/0000-0001-8194-3446 Zhi Yang Su Ming Chi University of Technology Research Article Keywords: Long Range (LoRa) technology, low power consumption network, Internet of Things (IoT), environmental parameters monitoring, LoRaWAN, Azure cloud database. Posted Date: July 12th, 2021 DOI: https://doi.org/10.21203/rs.3.rs-627459/v1 License: This work is licensed under a Creative Commons Attribution 4.0 International License. Read Full License
Development and Verification of an IoT-enabled Air Quality Monitoring System Based
                                       on Petri Nets

                                Yi-Nan Lin (Member, IEICE)
                            Department of Electronic Engineering
                             Ming Chi University of Technology
            84, Gongzhuan Rd., Taishan District, New Taipei City 243, Taiwan, ROC.
                                Email: jnlin@mail.mcut.edu.tw

                             Sheng-Kuan Wang (Member, IEEE)
                            Department of Electrical Engineering
                             Ming Chi University of Technology
               84, Gongzhuan Rd., Taishan Dist., New Taipei 243, Taiwan, ROC.
                             Email: skwang@mail.mcut.edu.tw

                            Gwo-Jen Chiou (Member, IEEE)
                            Department of Electrical Engineering
                               National Formosa University
                     Huwei Township 632, Yunlin County, Taiwan, ROC.
                                       Email: chuogj@nfu.edu.tw

                             Cheng-Ying Yang (Member, IEEE)
                              Department of Computer Science
                                    University of Taipei
                          1, Ai-Kao W. Rd., Taipei City 100, Taiwan
                                 Email: cyang@utaipei.edu.tw

            Victor R.L Shen (Fellow, IET; Senior Member, IEEE, ACM and IEICE)
                 Department of Computer Science and Information Engineering
                                   National Taipei University
            151, University Rd., Sanxia District, New Taipei City 237, Taiwan, ROC.
                                 Email: rlshen@mail.ntpu.edu.tw
                                               and
                            Department of Information Management
                              Chaoyang University of Technology
             168, Jifeng E. Rd., Wufeng District, Taichung City 413, Taiwan, ROC.
                                              and

                                              1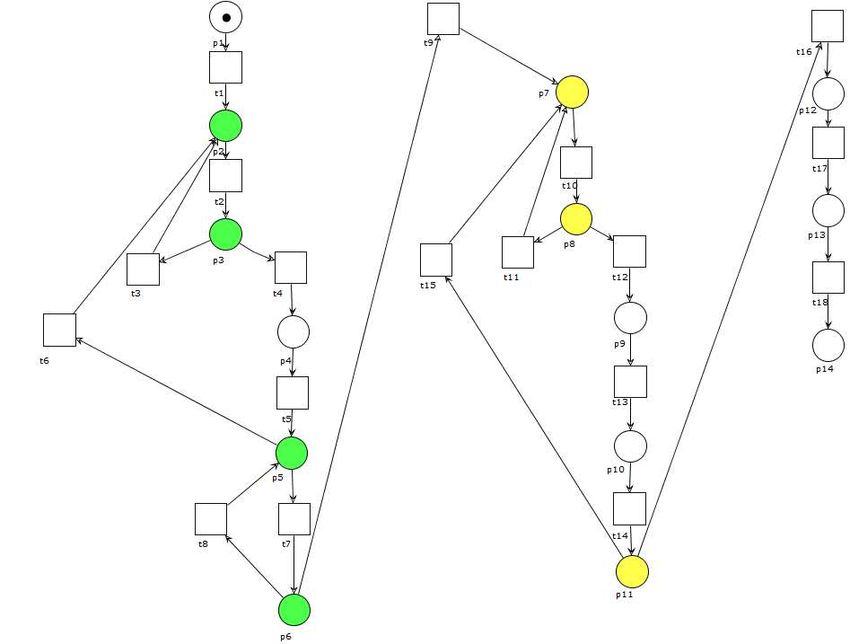
Zhi Yang Su
                                Department of Electronic Engineering
                                 Ming Chi University of Technology
                84, Gongzhuan Rd., Taishan District, New Taipei City 243, Taiwan, ROC.
                                    Email: a29945365@gmail.com

Corresponding Author -- Victor R.L. Shen
                   Department of Computer Science and Information Engineering
                   National Taipei University
                   New Taipei City, 237 Taiwan, ROC.

Acknowledgments: This work was supported by the Ministry of Science and Technology, Taiwan, under
            grants MOST 107-2221-E-845- 001-MY3 and MOST 107-2221-E-845- 002-MY3.

Subject Area: Smart Air Quality Monitoring System         Reference No.:

Abstract
An IoT (Internet of Things) system for monitoring campus environmental parameters was successfully
developed in this study. Various sensors were adopted in the front of IoT system for sensing air pollutants.
The architecture of LongRange (LoRa) in Class C uses low-power and long-distance transmission
technologies, which has been set up on the large campus, so that the terminal equipment can reach a balance
between downlink latency and battery life, making it the best transmission communication protocol. In
addition, this monitoring system uses the Petri net software tool to build a correct IoT platform based on the
fundamental working processes, and to demonstrate the feasibility of the IoT system through
simulation-based verification. Finally, the experimental results have shown that the IoT system for monitoring
the campus environmental parameters achieves the goal of an acceptable data transmission success rate of
more than 95%. Thus, it can facilitate the air quality trends for policy making as well as the hazardous
prediction and prevention.

Keywords Long Range (LoRa) technology; low power consumption network; Internet of Things (IoT);
environmental parameters monitoring; LoRaWAN; Azure cloud database.

                                                      2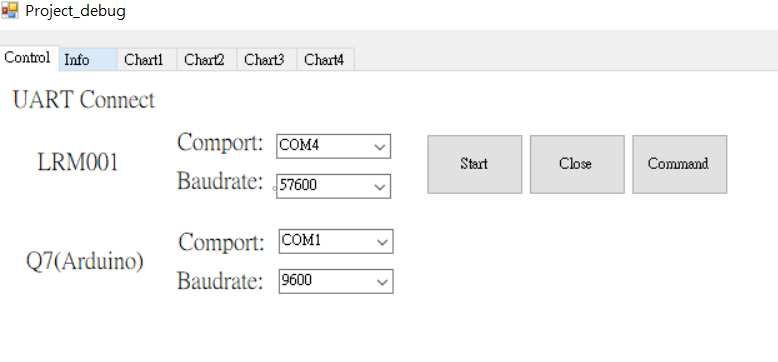
1 Introduction
     Currently, a morning exercise has become the energy source of people’s daily vitality. Many people
prefer to take jogging early in the morning. With regards to the air quality, the degree of pollution is
increasing rapidly. In addition, due to climate change, the weather in spring, summer, autumn and winter has
varied significantly, especially, in summer and winter. According to the statistics of Central Weather Bureau
in Taiwan, the average relative humidity reaches as high as 70% in summer [1]. With the influence of humidity,
the actual temperature and the temperature felt by human body may be different even though the heat index
and the wind chill index have been taken into consideration. Therefore, it motivates us to present this system,
in which the temperature and the air quality can be viewed as a basis to release reference standards, providing
the outdoor air quality on campus to determine whether it is suitable for holding the outdoor activities or not
[2-3]. Furthermore, most campuses have many departmental and dormitory buildings, which usually occupy a
large area.
      Since Ming Chi University of Technology (MCUT) has a tradition of morning jogging, students need to
gather up and run around the sports field at 6:30 in the morning. Thus, the temperature and the air quality
must be viewed as reference standards, enabling teachers to determine whether the morning jogging is
required or not. Many department buildings, faculty and student dormitories are distributed on campus. The
air detection locations were set up in the 2nd Education Building and the 5th student dormitory to
simultaneously monitor air pollutants, such as suspended particles (particulate matters, PM 2.5), carbon
monoxide, and carbon dioxide, which are harmful to our health, reminding teachers and students to be always
aware of such air pollutants. In the previous monitoring system, the problems such as low data transmission
success rate and high system maintenance cost have ever caused, which need to be solved.
     In this study, the LongRange (LoRa) communication technology was used to implement the IoT
platform. By selecting the LoRaWAN in Class C, the data latency can be minimized. Users can always pay
attention to whether the datasets are returned. Thus, the terminal equipment can reach a balance between
downlink latency and battery life. Various sensors were installed in different areas of the campus. The indoor
detection items include temperature, humidity, suspended particles (e. g. particulate matters, PM 2.5), carbon
monoxide, and carbon dioxide, while the outdoor detection items include temperature, humidity, wind speed,
suspended particles, and ultraviolet light. In addition, the actual temperature is found from the humidity and
wind speed datasets collected.
     Communication with the gateway was done through signal requirements to implement low-power and
long-range applications. It is in line with Class C for the LoRaWAN architecture, forming a two-way
communication. In other words, through this type of instant messaging, the back end uses software
applications such as C#, Azure, ASP.NET, and IIS to realize the construction of a campus air quality
monitoring system.
     The gateway uses an industrial computer to write the C# Windows Forms application to analyze the
datasets from different detection stations and upload them to the Microsoft Azure cloud database system
every hour, ensuring that the datasets are completely stored. The server uses ASP.NET to develop web
programs to publish datasets and to integrate with the Google Map API to locate different detection stations.
Users can search for the environmental quality and further carry out data analysis and evaluation through the

                                                      3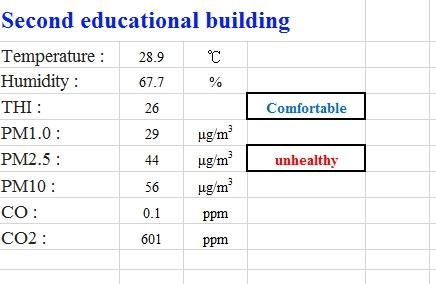
website.
     The remainder of this paper is organized as follows: The works related to IoT platform and LoRa
wireless transmission technology are discussed in Section 2. Section 3 focuses on the proposed hardware and
software systems. Experimental results and performance evaluation are presented in Section 4. Finally,
Section 5 describes our remarkable conclusion.

2 Literature Review
     This Section first introduces the communication and transmission characteristics of IoT architecture
with its network layers. Furthermore, the working principle of the wireless transmission technologies and
Petri net definitions are presented.

2.1 Current IoT Architecture
     IoT technology allows all common objects with independent functions to connect to an interoperable
network. To realize IoT applications, more than 500 megabytes of objects may be required. Moreover, the
use of wireless radio frequency technology to connect objects to communicate with each other becomes an
integral part of IoT. The current IoT platform is divided into three layers, namely, application layer, network
layer and perception layer.

2.1.1 Application Layer
     The application layer is responsible for the overall analysis and processing of the recovered datasets,
through performing some algorithms until all datasets are generated. Usually, the application layer is related
to the hardware devices for big data analysis, data receiving and sending center, server, and storage, such as
smart home, smart transportation, urban management, urban safety, environmental monitoring, and
management of agricultural, fishery and pasture farms, and so on.

2.1.2 Network Layer
     The network layer is responsible for transmitting and receiving information through the wired or wireless
methods. Usually, the network layer is connected to hardware devices that are related to the Internet, local
networks, mobile networks, and wireless networks, such as LAN, 2G/3G/4G, Wi-Fi, ZigBee, BlueTooth and
RFID technologies.

2.1.3 Perception Layer (i.e. Physical Layer)
     The perception layer is responsible for sensing the surrounding environment and collecting datasets.
Usually, the perception layer is related to sensors, monitoring and storage devices such as IPCam,
LightSensor, temperature sensor, RFID card and reader, and so on.

                                                      4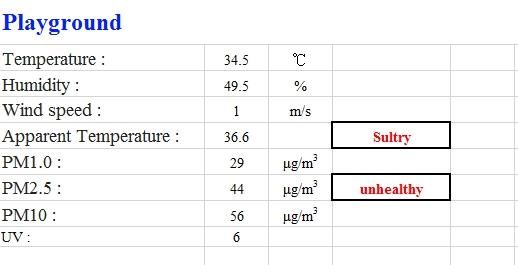
2.2 LPWAN
       According to the definition from WiKi [4], Low-Power Wide-Area Network (LPWAN) [5-6], also
known as Low-Power Network (LPN), is a type of architecture applied to IoT. This architecture realizes a
low-transmission and long-range wireless network. To achieve the design concept of low power consumption,
the technology adopted by the LPWAN architecture is basically the sub-GHz frequency band, thereby
fulfilling the definition required by LPWAN. According to the white paper [7] proposed by the LoRa®
Alliance, the main characteristics of LPWAN are shown as follows:
1. Long battery life (usually more than 10 years, while supporting smart measurement applications).
2. Wide-area connection that enables the out-of-the-box features.
3. Low-cost chips and networks.
4. Limited data throughput.
      In other words, LPWAN has the characteristics of extremely low power consumption, long transmission
range (usually km level) and low price. However, it has the problem of data load. In fact, LPWAN eliminates
the shortcomings of the existing short-range cellular network technology. Shortening the transmission range
means that the wide area network can be realized at lower equipment cost while having better power
consumption. These features can clearly explain the potential of LPWAN technology. The transmission range
and power consumption of the current mainstream network for IoT, such as ZigBee, BlueTooth, Wi-Fi, RFID,
2G/3G/4G mobile networks, and so on, are not as good as those in the LPWAN architecture. Thus, the
terminal devices of IoT do not usually require the transmission of a huge number of datasets.
      Since the need of LPWAN architecture comes from the development of IoT, LPWAN was developed
after the establishment of IoT. Before the beginning of 2013, the term LPWAN did not exist. Now, it has
become one of the technologies that exhibit the fastest growth in the development of IoT. The IoT market
demonstrates the incredible potential of LPWAN technology. Machina Research [6] predicted that there
would be 3.6 billion LPWAN connections by 2024, which would grow substantially from today’s number.
      The data transmission rate and transmission range of the IoT technologies are divided into two
categories, namely, one category in unauthorized frequency band such as LoRa, and the other category in
authorized frequency band such as EC-GSM, LTE Cat-m, and NB-IoT.
      The transmission range of ZigBee, BlueTooth and Wi-Fi technologies is the shortest one in the
unauthorized frequency band, while the transmission range of LoRa and UNB technologies is the longest one.
Moreover, based on the power consumption and the data transmission rate of each technology [7], UNB
technology exhibits the best power-saving performance, while LoRa technology shows low power
consumption and moderate data transmission rate [8-11].

2.3 LoRa
      LoRa is an emerging wireless technology designed specifically for LPWAN, providing long-range,
low-speed, and low-power consumption wireless communication, which is considered as the most promising
technology for realizing IoT applications. LoRa defines the physical layer communication lines. Many
traditional communication systems use Frequency-Shift Keying (FSK) modulation as the physical layer,
which can achieve low-power modulation. It is designed and patented by Semtech Corporation, which uses
proprietary spread spectrum technology in the sub-GHZ ISM band. Bidirectional transmission uses Chirp

                                                     5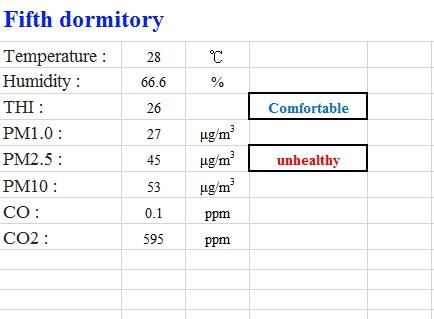
Spread Spectrum (CSS), which is a sinusoidal signal of spread spectrum (SS) modulation that increases or
decreases with time. LoRa allows six spreading spectrum factors (SF7 to SF12) and three different
bandwidths (125 kHz, 250 kHz, 500 kHz). It is assumed that the higher spreading spectrum allows longer
transmission range, but lower transmission speed (rate), and vice versa. The transmission rate of LoRa is from
300 bps to 50 kbps, and the maximum load length of each data is 243 bytes [12-13].
       LoRa-Alliance formulated communication protocol and system architecture based on LoRa in 2015,
which was named as LoRaWAN™. According to the MAC layer protocol, power consumption level, LoRa®
modulation and ISM bands in different regions around the world, this communication protocol and network
architecture have a great impact on the node battery life, network capacity, service quality, and various
application services. Based on the Open System Interconnection Reference Model (OSI), LoRa represents
the physical layer, and LoRaWAN™ represents the data connection layer and the network layer [14-15].
       Many of the established network architectures still belong to the mesh network, in which each node
sends messages of other node to increase the network communication range. However, it increases the
operation complexity and shortens the battery life. In contrast, the star topology can realize long-range
connection and make the battery more power-saving. The LoRaWAN™ architecture can be divided into end
nodes, gateway, network server and application server. In terms of architecture, the end-devices are not
connected to a specific gateway and the datasets are all received by multiple gateways. Gateway sends control
signals and end-device messages to the cloud, and simultaneously decodes multiple signals. The connection
can be made through 3G, 4G or Ethernet, and the application server presents the results to all users [15].
       Asynchronous communication data transmission protocol is used in the LoRaWAN™ architecture. This
protocol is based on the Aloha system transmission method. In a mesh network or synchronous network,
nodes must be woken up to synchronize with the network and to receive messages at any time. In such a mode,
a lot of energy will be consumed, resulting in shortening the battery life. To achieve a long-range star
topology, the gateway must have large capacity, which uses multi-channel modulator-demodulator (MoDem)
to receive messages of end-devices from all directions. However, the key factors include the transmission rate,
the effective load length of datasets, and how long it takes to send the datasets. The LoRaWAN ™ is a
spread-spectrum technology that uses different spreading spectrum factors, and the transmission rate changes
accordingly [15].
       There are three communication protocols defined for different services under the LoRaWAN™ protocol.
The terminal equipment achieves a balance between the downlink communication latency and the battery life,
which is divided into Class A, Class B, and Class C [13-15]. Class C device allows bidirectional
communication with maximal receiving slots. The receiving window is open at almost all the time and is only
closed during transmission.
       Class A terminal device is power saving; however, its data transmission rate is low, which may easily
delay. On the contrary, Class C device has high power consumption. Since its receiving port is always open,
it is in the best immediacy. Class B has the characteristics of signal synchronization. As a result, there is no
need to continuously open the window for receiving signals like Class C, and there is no problem in
transmission efficiency like Class A. Each type of device can be applied to different scenarios.

2.4 Petri Net
     Petri Net (PN) is a well-known graphical and mathematical model, which is characterized as concurrent,

                                                       6
asynchronous, nondeterministic, stochastic, distributed, parallel, fuzzy, and so on. People like using it to
model and analyze various systems, different from flowcharts, block diagrams, and neural networks. The
formal PN mathematical formula includes five elements, namely, PN = (P, T, F, W, Mo). The formal PN
mathematical definitions are listed in Tables 1 and 2. PN theory has been widely applied in the distributed and
parallel systems. A PN model belongs to a directed graph including those elements such as place, transition,
and the directed arc connecting a place to a transition. A PN model owns parallel and concurrent modeling
features, and it is also applied in the areas of system construction, property checking, systematic
modularization, and so on [16-17].
Table 1 Formal PN mathematical definitions
Place (P) P = {p1, p2, …, pn}, n > 0. A finite set of places.
Transition (T) T = {t1, t2, …, tm}, m > 0. A finite set of transitions.
Flow (F) F ⊆ (P×T)∪(T×P). A finite set of arcs (i.e. flow relation).
Weight (W) W: F → {1, 2, 3, …}. Weight function.
Mo M0: P→ {0, 1, 2, …}. An initial marking.
Table 2 PN Notations
Elements Petri Net symbols
Place(P) ○
Transition(T) —
Arc →
Token ●
2.4.1 WoPeD
Workflow-Petri-net-Designer (WoPeD) is adopted as a software simulation tool; and the PN model is
used to modularize, simulate, and analyze the proposed approach and to help us get the experimental results
[18]. WoPeD is an open-source software system developed by the Cooperative State University Karlsruhe
under the GNU Lesser General Public License (LGPL), which serves as an easy-to-use system for simulating
and analyzing the monitoring processes modeled by workflow nets. In the WoPeD simulation, the analysis
results are divided into two parts, namely, Wizard and Expert. Wizard part presents the Workflow net
property and the Soundness. Expert part presents the Structural analysis and the Soundness. The proposed
monitoring system has used this software tool; and the block diagram was converted into the PN model for
property analysis, which would verify its applicability and integrity.
73 Proposed Approach and Simulation Results
This Section is divided into five parts to present the system architecture, hardware components, software
architecture and tools, packet transmission specification, and system verification.
3.1 System Architecture
Fig. 1 shows the proposed system architecture. Three detection stations were set up on campus.
Different sensors were used and classified as indoor and outdoor ones, such as PMS5003T, MQ7,
DS-CO2-20, GUVA-S12SD, and JL-FS2.
Indoor sensors were used to detect temperature, humidity, suspended particulates, carbon monoxide,
carbon dioxide; while outdoor sensors were used to detect temperature, humidity, wind speed, apparent
temperature, suspended particulates, and ultraviolet light, serving as an analysis basis. For data transmission,
LoRa 915 MHz was used as the communication protocol, which is a transmission module LRM001
developed by Liyatech. The REVQ704 industrial computer developed by Avalue Technology was used as a
Gateway. The C# Windows Forms program was installed to analyze the datasets collected from different
detection stations. The datasets were uploaded to Microsoft Azure SQL Server every hour. Finally, the
ASP.NET technology was adopted by the server to publish web pages which were integrated with the Google
Map API to locate different detection stations, providing graphical interface to users.
Playground
(outdoor)
University Teaching Microsoft
Complex Building 2 Ip Connection Azure
Ip Connection Server
(indoor)
5th Male Dormitory
(indoor)
Fig. 1 System architecture
3.2 Hardware Components
The hardware devices and components are included in the following: Arduino Mega2560 Rev3 [19],
XH-M401, PMS5003T [20], MQ-7 [21], GUVA-S12SD [22], JL-FS2 [23], DS-CO2-20 [24], LRM001
[25], RN2903 [26-27], and Q7-REV07. The entire hardware components are divided into the transmitting
end and the receiving end. The transmitting end combines the corresponding sensors depending on the
monitoring scenarios.
The indoor detection station is composed of the Arduino Mega2560 Rev3 development board and
Liyatech LRM001; and integrates the voltage stabilizing modules including PMS5003T, MQ7, DS-CO2-20,
and XH-M401. The UART and ADC provided by Arduino are used as a communication channel to integrate
the datasets of the above sensors, to define the packet specification hexadecimal string, and to transmit the
UART protocol to the LRM001 module. The LoRa communication technology is utilized to upload the
8datasets to the receiving end.
The outdoor detection station is also composed of the Arduino development board and LRM001; and
integrates the voltage stabilizing modules including PMS5003T, GUVA-S12SD, JL-FS2, and XH-M401.
The datasets are transmitted to LRM001 via UART and ADC, and the packet datasets are sent to the
receiving end. The receiving end is an industrial computer REVQ704, which is set as the system gateway.
Since Arduino Mega2560 can be connected to the sensors, it becomes one of the detection stations, which has
a Mini PCI-E slot to connect the LRM001 and the UART communication at the same time, collecting all
datasets into the installed C# Windows Forms program.
3.3 Software Architecture and Tools
The program of the corresponding environment was installed at the detection station, and the LoRa
transmission mechanism was adopted to return it to the C# Windows Forms software application (App) [28].
Then all datasets were analyzed and published. The results can be obtained from the screen of the App to
debug in the future. The results were uploaded to Microsoft Azure SQL Database and saved as a table with
different settings. The effective datasets were then loaded using the Web Application of ASP.NET
technology via the server [29]. In addition, the webpage was issued by IIS Service [30], enabling a connection
to the server by using a physical network path, forming the interactive interface presented by the system in the
end, and providing to the public with complete data analysis.
3.3.1 IIS
Internet Information Services (IIS) allows Microsoft to provide the basic services for Internet users. It
belongs to the management platform for developing and managing web application services. This system
includes the Windows Process Activation Service (WPAS), which enables the website to use protocols other
than HTTP and HTTPS, and to integrate request management from IIS and ASP.NET. IIS includes the
important functions of applications and web server in Windows Server 2008 (IIS7.0) and Windows Server
2008 R2 (IIS7.5). Therefore, IIS provides a graphical management interface to simplify the complexity in
response to various management needs [30].
3.3.2 Microsoft Azure SQL Database
Cloud computing is a network-based computing method that can transfer hardware and software
resources to servers, storage, databases, and so on. It is established under the concept of virtualization,
scalability, and Pay-As-You-Go. There are three cloud services, including infrastructure as a service (IaaS),
platform as a service (PaaS), and software as a service (SaaS) [31].
Microsoft Azure is a public cloud service (PCS) platform launched by Microsoft. At first, it only
provides basic cloud services with IaaS; and abundant services such as IaaS, PaaS, and SaaS are provided,
allowing users to create services by using different methods. Azure categorizes services into those groups
including computing service, application service, data management, analysis service, network service, and so
on, which are provided according to users’ needs. This system uses Azure data management to build a
database system in Azure SQL Database [32]. The gateway connects to the database system through the
network and accesses the datasets in the database system, completing the cloud automation function.
93.3.3 SQL Server Management Studio
SQL Server Management Studio (SSMS) is a graphical integrated environment that forms SQL
infrastructure. It is applicable to SQL Server and Azure Database, providing the configuration and
management of SQL Server. Users can quickly deploy, search, or upgrade the data layer used by applications.
Through either edge computer or cloud computer, users can access the management function by connecting
to the database engine [33].
3.4 Packet Transmission Specification
The data transmission is customized according to a specific protocol. This system uses LoRa as the
communication link. According to the description of the RN2903 command manual, the packet transmission
is defined by hexadecimal method. Arduino Mega 2560 integrates the sensor datasets, with the command
"radio tx", the detection station code, the detection item abbreviation and the detection value added in front of
the datasets. After receiving the command, LRM001 sends it to the gateway for analysis.
3.5 System Verification
Fig. 2 shows the block diagram of our proposed air quality monitoring system, from which the Petri Net
model was derived, as shown in Fig. 3. The interpretations of places and transitions are all listed in Table 3 and
Table 4, respectively. The place marking vector represents a current state in the monitoring system. The
transition firing vector represents all processes that need to be changed under the current conditions, and the
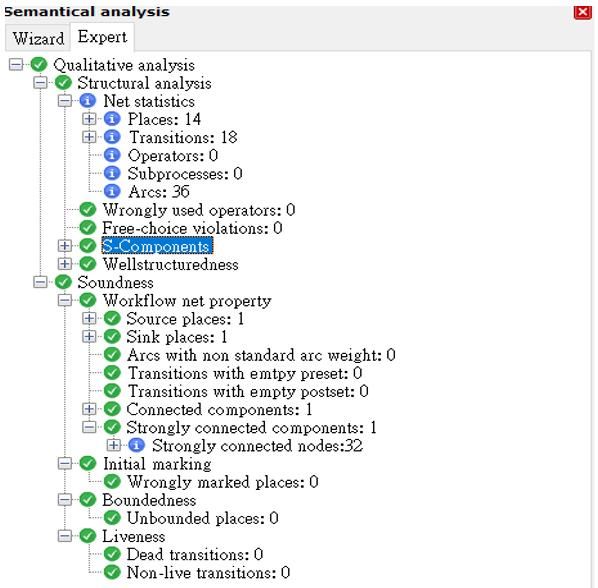
arc represents the connection between a place and a transition. For the net statistics shown in Fig. 4, there are
14 Places, 18 Transitions, and 36 Arcs in total; and for the semantical analysis, there are no errors made in the
Workflow net property with Soundness.
10Fig. 2 Block diagram of our proposed monitoring system
As shown in Fig. 3, p1 is like an Input port and a token is inserted in p1. When Start system (t1) is
completed, the token moves to Hardware (p2). p2 enters the next step, namely, Start hardware tools (t2); and
t2 enters the gathering of sensor datasets (p3) when finished. If sensor datasets have problems, it returns to
Hardware (p2) via Return and check hardware (t3). If there is no abnormality in the gathering of sensor
datasets (p3), it moves to Sensor Datasets (p4) via Send (t4). LRM001 Client (p5) determines whether the
datasets can be transmitted to the LRM001 Gateway (p6) via LoRa communication mechanism. If there is an
error, the token will return to p5 via Return and check LRM001 Client (t8); and the next LRM001 Gateway
(p6) will send the datasets to C# Windows Forms (p7) and Analysis Data (p8), which are filtered into valid
information and stored in Azure SQL Server (p9). ASP.NET Web Form (p11) runs on the server side and
presents the Cloud datasets to the Web (p12). Provide users (p13) to use, and finally complete the entire
system operations (p14). The semantical analysis and net statistics are shown in Fig. 4. The simulation results
11are shown in Fig. 5.
Fig. 3 Petri Net model of the proposed monitoring system
Table 3 Interpretation of places
Places Interpretation Places Interpretation
p1 Input token p8 Analysis Data
p2 Hardware p9 Azure SQL Server
p3 The gathering of sensors data p10 The analysis data
p4 Sensors Data p11 ASP.NET Web Form
p5 LRM001(Client) p12 Web
p6 LRM001(Gateway) p13 Users
p7 C# Windows Forms p14 The End
12Table 4 Interpretation of transitions
Transitions Interpretation Transitions Interpretation
t1 Start system t10 Use Windows Forms
t2 Start hardware tools t11 Return to Windows Forms
t3 Return and check hardware t12 Get data
t4 Send P4 t13 Store data to Azure SQL Server
t5 Send data to LRM001(Client) t14 Send data to web application
t6 Return and check hardware t15 Return to web application
t7 Send data to LRM001(Gateway) t16 Use server data
t8 Return and check LRM001(Client) t17 User search web
t9 Send data to windows application t18 End system
13Fig. 4 PN semantical analysis
14Fig. 5 Simulation results.
In summary, by using the WoPeD simulation tool, the PN model can be qualitatively analyzed. The PN
model shown in Fig. 3 has one source place and one sink place. According to simulation results shown in Fig.
5, the IoT monitoring system is proved to be totally correct. In other words, the connections from places to
transitions and vice versa do not have deadlocks at all. Since there are no deadlocks, the system is safe. The
PN model has been utilized to verify and analyze the proposed IoT monitoring system, enhancing its
applicability and integrity. Thus, the developed IoT monitoring system is ensured to be safe and correct
[16-17].
4 Experimental Results and Performance Evaluation
This Section describes how the system uses the LoRa communication technology to develop the campus
environmental monitoring system. The hardware and software requirements stated in Section 3 were used to
carry out the IoT system development, leading to the creation of a complete monitoring system. This Section
is divided into hardware information, software design and testing, and system performance evaluation.
154.1 Hardware Information
The required hardware information has been described in Section 3. Table 5 shows the summary of all
hardware components and the datasets collected by the detection stations.
Table 5 Summary of air detection station information
Location Hardware Datasets
1. LRM001
2. Arduino Mega 2560 1. Temperature
3. PMS5003T 2. Humidity
Playground 4. JL-FS2 3. Particulate Matter
(Outdoor) 5. GUVA-S12SD 4. Apparent Temperature
6. Lithium Battery 5. Wind Speed
7. XH-M40111 6. Ultraviolet Light
1. LRM001
2. Arduino Mega 2560 1. Temperature
3. PMS5003T 2. Humidity
Fifth Dormitory 4. MQ-7 3. Particulate Matter
(Indoor) 5. DSC-CO2-20 4. Carbon Monoxide
6. Lithium Battery 5. Carbon Dioxide
7. XH-M40111
1. Q7-REV07 1. Temperature
Second Education 2. LRM001 2. Humidity
3. PMS5003T 3. Particulate Matter
Building
4. MQ-7 4. Carbon Monoxide
(Indoor) 5. DSC-CO2-20 5. Carbon Dioxide
4.2 Software Design and Testing
In this study, three detection stations were set up in the air quality monitoring system. As shown in Fig.
6, the gateway runs the C# Windows Forms software application (App), which opens the UART
communication protocol at both ends. It connects the first end to the REVQ704's own Arduino, and sets
COM1 and 9600 Baud, while the second end communicates with the LRM001 of the Mini PCI-E slot, which
sets COM4 and 57600 Baud. The Start button is pressed to start the communication mechanism, which sends
the command to complete the LRM001 command configuration.
16Fig. 6 UART connection
A command was sent to the LRM001, and the RN2903 chip returned the corresponding reply. As shown
in Fig. 7, the command is successful. If there is a command error, the communication will stop.
sys reset
mac pause
radio set freq 915100000
radio set pwr 20
radio set bw 250
radio set wdt 5000
Fig. 7 RN2903 response
As shown in Tables 6, 7, and 8, after opening the gateway software App, it receives the values of the
sensors from three detection stations. As stated in Section 3.4, the header for different locations is identified
and the effective hexadecimal value of each string is obtained to get the average value of each item based on
the number of datasets received per hour. In addition, every day at 00:00, the 24-hour datasets in the cloud
database system for the previous day are cleared automatically.
Apparent temperature (AT) is calculated based on temperature (T), relative humidity (RH), water
pressure (e) and wind speed (V) according to formulas (4-1) and (4-2) [31].
(4-1)
(4-2)
17Comfort level (THI) is calculated based on temperature (T) and relative humidity (RH)
according to formula (4-3).
(4-3)
Table 6 User interface in App-1
Table 7 User interface in App -2
18Table 8 User interface in App-3
The hourly average value is connected to the Microsoft Azure through the network. The intelligently
correlated cloud database service is to store each effective sensing value in the corresponding table. This
system uses SSMS to connect with the Azure SQL Database to create a table for each detection item, helping
the gateway and the server to carry out an access. In addition, users can use this tool to access the cloud
database and issue those commands such as add, modify, delete, and search. Fig. 8 shows the apparent
temperature datasets in the sports field.
After the C# Windows Forms analysis of the gateway is completed, the valid datasets are uploaded to the
cloud database system through the network. The C# Web Application of the system was installed in the host
at the Department of Electronic Engineering. By adopting the IIS service technology, a terminal server
webpage was built. Physical network location can be used to enter the homepage of the campus
environmental monitoring network.
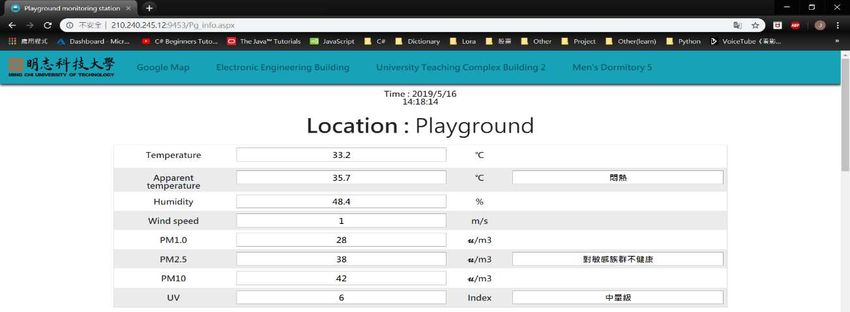
Taking the detection station on the playground (i. e. sports field) as an example, and clicking the icon,
the server receives the commands which lead to the playground information webpage. There are some options
at the top for visiting the webpage of other detection station or returning to the homepage of the map. Various
sensing information, such as apparent temperature, PM2.5 and ultraviolet light, is all listed in the middle to
inform users of the current statuses, as shown in Fig. 8.
19Fig. 8 Detection information on the playground
Figs. 9, 10, and 11 show the values of relative humidity, wind speed, temperature, and apparent
temperature [34] detected by the monitoring station on the playground, respectively. By comparing the
temperature with the apparent temperature in Fig. 11, the temperature can reach as high as 32 degrees or
more during the daytime. However, by taking into consideration the humidity and the wind speed, the
apparent temperature is higher than the hourly temperature during the daytime. Therefore, using the apparent
temperature as a reference standard instead of the heat index or the wind chill index is more accurate.
Fig. 9 Relative humidity on the playground
20Fig. 10 Wind speed on the playground
Fig. 11 Temperature and apparent temperature on the playground
Fig. 12 shows the graph of PM1.0, PM2.5, and PM10 measured during the daytime. Each detection item
can be identified according to the legend provided. With the information bar provided at the top of the
webpage, the current air quality analysis results can be obtained. Fig. 13 shows the graph of UV measurement,
indicating that the UV is strong during the daytime, and its value reaches maximum at noon.
21Fig. 12 Particulate matters measurement on the playground
Fig. 13 UV measurement on the playground
4.3 Performance Evaluation
Finally, the success rate of packet transmission in this system was tested. A total of 3000 pieces of
dataset were sent from the front-end device to the gateway, with a time interval of 5 seconds, as shown in Fig.
14. The distances between each station and the gateway were recorded in Table 9. In addition, the LoRa 915
MHz communication transmission results were used to serve as an important basis for the future system
development. With LoRa 915 MHz adopted as the communication transmission, despite the presence of
22several obstacles, the success rate remains at 95% or more.
Fig. 14 System packet test
Table 9 System packet transmission success rate
Number of
Tested Number of Packet success
Location datasets
distance datasets sent rate
received
2nd Education
0m 3000 2995 99.8%
Building
5th Male
470±5m 3000 2952 98.4%
Dormitory
Playground 500±10m 3000 2872 95.7%
4.3.1 Advantages of Cloud Database over Traditional Database
Cloud computing is to allocate computing resources according to demands through the network, and
those computing resources include server, database system, storage space, platform, architecture, and
applications. Cloud computing supports pay-per-use, meaning that users only need to pay the prices as
needed. In the following, the advantages of a cloud database system are all discussed. The feature comparison
between cloud database system and traditional database system is shown in Table 10.
23Table 10 Comparison between cloud database and traditional database
Traditional
Items Cloud database
database
Hardware equipment Aggregated server mode Single server mode
No hardware installation Cost ranges from hundreds
Hardware equipment cost
required of thousands to million dollars
Users can use different operating
systems such as Windows, Apple Must work under the same
Operating system
(iOS) or Android system architecture.
simultaneously.
Maintained by cloud platform Hiring of maintenance
Server cost
supplier personnel is required.
Software supplier and
Platform supplier and equipment
hardware supplier are different,
System platform supplier are the same, which
which may lead to responsibility
maintenance favors the maintenance
issues. Additional cost is required
operation.
for software update.
High cost, and hardware
Software cost Low cost, free or rental
equipment needs maintenance.
Hiring of special personnel
Easy to manage and high data for management is required. There
Data management
security are risks of data loss or infection
by viruses.
Computing methods are Computing methods are
Computing method
distributed and synchronized. independent.
Users must be in the same
All users can easily access the
Resource sharing domain or datasets need to be
data.
shared via portable hard drive.
More; can be added
Less; requires multiple hardware
Resource storage location indefinitely if capacity is big
devices.
enough.
In this study, the Azure cloud database system was used. When building this system, the advantages
stated above indeed have been noticed, namely, low cost and high data security. When building a traditional
database system, users may worry about the failure of the database equipment. However, when using the
24cloud database system, such a worry can be eliminated.
4.3.2 Functional Comparison
To fully support the claim that our proposed approach is more feasible and acceptable than other existing
ones, we have made a functional comparison among different approaches including ours, Po-Ying Wu [9],
and Yu-Sheng Lin [10]. The results of functional comparison are shown in Table 11.
Table 11 Results of functional comparison
Functions
Short
Low power Data User-friendly Fast data Low system
downlink
consumption visualization interface transmission maintenance cost
latency
Approaches
Our proposed V V V V V V
Po-Ying Wu
V V V
[9]
Yu-Sheng Lin
V V V
[10]
“V” denotes “Yes” or “Available”.
5 Conclusion
The campus environmental parameters monitoring system has been successfully developed. Three
detection stations were set up to monitor different items according to the needs at each location. A variety of
sensors are used to measure the substances that are harmful to people’s health, allowing users to easily access
the status of various environmental parameters on campus from the school’s website. In the end, the Petri net
simulation software tool was used to analyze and verify the integrity of the proposed IoT system.
The contributions of this study are presented as follows:
1. The environmental parameters on campus can be viewed from the university website. Users can access the
status of environmental parameters in various regions at MCUT, such as temperature, humidity, wind
speed, UV light and air quality (e.g. PM1.0, PM2.5, and PM10). Based on the monitored temperature,
humidity and wind speed, the apparent temperature can be found, which is closer to the temperature
experienced by users.
2. The LoRa technology with the characteristics of low-power consumption and long-range wireless
communication was adopted to replace the traditional wireless communication technology such as Wi-Fi,
ZigBee, and BlueTooth.
3. The most suitable protocol among Classes A, B, and C was determined. By selecting the LoRaWAN in
Class C, the data latency is minimized. Users always pay attention to whether the datasets are returned. The
terminal equipment can reach a balance between downlink latency and battery life.
4. A more stable way of storing datasets was used. The Azure cloud database system was used to completely
store the datasets, making the maintenance of IoT platform become easy.
255. The datasets from experimental results are stable so that the wireless communication with LoRa can
maintain a packet transmission success rate of more than 95% in the long-range transmission region with
multiple obstacles.
Although this system has been already completed, further improvements are still needed to reach the
practical application and commercialization. In the future, this project will focus on improving and expanding
the system functions. The system will be expanded to six detection stations, realizing a star topology of
network connection to create a multi-point gateway. In this case, if the gateway encounters a failure, it will
not affect the entire system operation. Furthermore, when communicating with the server, it will be
distributed anywhere depending on the distance. The gateway with shorter distance will be set for returning
datasets to the server.
Acknowledgements
This work was supported by the Ministry of Science and Technology, Taiwan, ROC, under grants
MOST107-2221-E-845- 001-MY3 and MOST 107-2221-E-845- 002-MY3.
REFERENCES
1. Syu, Y.-J., Jhang, B.-S. (2015). Taiwan's somatosensory temperature preliminary analysis. Procs. of
Central Meteorological Administration's 104-year Seminar on Weather Analysis and Forecasting.
(Visited on 2019/11/23).
2. Sobin, C. C. (2020). A survey on architecture, protocols and challenges in IoT. Wireless Personal
Communications, 112, 1383-1429.
3. Ahmed, M. I., Kannan, G. (2021). Secure end-to-end communications and data analytics in IoT integrated
application using IBM Watson IoT platform. Wireless Personal Communications, Online.
4. WIKIPEDIA, LPWAN. [Online]. Available:
https://en.wikipedia.org/wiki/LPWAN. (Visited on 2019/1/23)
5. LPWA Technologies-unlock new IoT market potential. LoRa Alliance. 2015. (Visited on 2019/1/23).
6. Khalil, A., Mbarek, N., Togni, O. (2021). A self-optimizing QoS-based access for IoT environments.
Wireless Personal Communications, Online.
7. Mobile experts White Paper for LoRa Alliance-Where does LoRa fit in the big picture. LoRa Alliance,
2015.
8. Mikhaylov, K., Petaejaejaervi, J., Haenninen, T. (2016). Analysis of capacity and scalability of the LoRa
low power wide area network technology. European Wireless 2016.
9. Wu, P.-Y. (2019). Development of LoRa-based IoT platform. Master’s Thesis, Department of Electronic
Engineering, I-Shou University, https://hdl.handle.net/11296/66m549 [Online].
10. Lin, Y.-S. (2018). The implementation of a campus air monitoring system using LoRa network. Master’s
Thesis, Department of Information Engineering, Tunghai University,
https://hdl.handle.net/11296/h48a65 [Online].
2611. Khanna, A., Kaur, S. (2020). Internet of Things (IoT), applications and challenges: A comprehensive
review. Wireless Personal Communications, 114, 1687-1762.
12. Raza, U., Kulkarni, P., Sooriyabandara, M. (2017). Low power wide area networks: An overview. IEEE
Communications Surveys & Tutorials, 19( 2), 855–873.
13. Ayele, E. D., Hakkenberg, C., Meijers, J. P., Zhang, K., Meratnia, N., Havinga, P. J.M. (2017).
Performance analysis of LoRa radio for an indoor IoT application. Procs. of 2017 International
Conference on Internet of Things for the Global Community (IoTGC), 1–8.
14. LoRa world coverage [Online]. Available:
www.lora-alliance.org/ (Visited on 2018/8/20).
15. LoRaWAN™ what is it? - A technical overview of LoRa and LoRaWAN™, LoRa Alliance, 2015.
16. Shen, V. R.L., Yang, C.-Y., Shen, R.-K., Chen, Y.-C. (2018). Application of Petri nets to deadlock
avoidance in iPad-like manufacturing systems. Journal of Intelligent Manufacturing, 29(6) 1363-1378.
17. Shen, R.-K., Lin, Y.-N., Juang, T. T.-Y., Shen, V. R.L., Lim, S. Y. (2018). Automatic detection of video
shot boundary in social media using a hybrid approach of HLFPN and keypoint matching. IEEE
Transactions on Computational Social Systems, 5(1), 210-219.
18. WoPeD Website [Online], https://woped.dhbw-karlsruhe.de/, as of Aug. 23, 2019.
19. Arduino-Mage-2560-Rev3 [Online]. Available:
https://store.arduino.cc/usa/arduino-mega-2560-rev3%20 (Visited on 2018/8/20).
20. PMS5003T User Manual. PLANTOWER, 2016.
21. MQ-7 User Manual. SparkFun Electronics, 2012.
22. GUVA-S12SD User Manual. Roithner Lasertechnik, 2011.
23. JL-FS2 User Manual. EKT, 2012.
24. DS-CO2-20 User Manual. PLANTOWER, 2017.
25. LRM001-915 User Manual. Liyatech, 2018.
26. RN2903 LoRa™ Technology Module Command Reference User’s Guide. MICROCHIP, 2015.
27. RN2903 Low-Power Long Range LoRa Technology Transceiver Module. MICROCHIP, 2015.
28. C# programming manual [Online]. Available:
https://docs.microsoft.com/zh-tw/dotnet/csharp/programming-guide/
(Visited on 2018/8/20).
29. Web development (ASP.NET) [Online]. Available:
https://dotnet.microsoft.com/apps/aspnet (Visited on 2018/9/30).
30. Introduction to IIS Architectures [Online]. Available:
https://docs.microsoft.com/en-us/iis/get-started/introduction-to-iis/introduction-to-iis-architecture
(Visited on 2018/10/10).
31. Chanal, P. M., Kakkasageri, M. S. (2020). Security and privacy in IoT: A survey. Wireless Personal
Communications, 115, 1667-1693.
32. What is the Azure SQL Database service [Online]. Available:
27https://docs.microsoft.com/zh-tw/azure/sql-database/sql-database-technical-overview (Visited on
2019/12/15).
33. Transact-SQL syntax conventions (Transact-SQL) [Online]. Available:
https://docs.microsoft.com/zh-tw/sql/t-sql/language-elements/transact-sql-syntax-conventions-transact-
sql?view=sql-server-2017 (Visited on 2019/12/11).
34. What is apparent temperature?
https://zh.wikipedia.org/wiki/%E9%AB%94%E6%84%9F%E6%BA%AB%E5%BA%A6 (Visited on
2019/12/15).
Publisher’s Note Springer Nature remains neutral with regards to jurisdictional claims in published maps and
institutional affiliations.
28You can also read