A modelling analysis of the effectiveness of second wave COVID 19 response strategies in Australia - Nature
←
→
Page content transcription
If your browser does not render page correctly, please read the page content below
www.nature.com/scientificreports
OPEN A modelling analysis
of the effectiveness of second wave
COVID‑19 response strategies
in Australia
George J. Milne1*, Simon Xie1, Dana Poklepovich1, Dan O’Halloran3, Matthew Yap2 &
David Whyatt2
There is a significant challenge in responding to second waves of COVID-19 cases, with governments
being hesitant in introducing hard lockdown measures given the resulting economic impact. In
addition, rising case numbers reflect an increase in coronavirus transmission some time previously,
so timing of response measures is highly important. Australia experienced a second wave from June
2020 onwards, confined to greater Melbourne, with initial social distancing measures failing to reduce
rapidly increasing case numbers. We conducted a detailed analysis of this outbreak, together with an
evaluation of the effectiveness of alternative response strategies, to provide guidance to countries
experiencing second waves of SARS-Cov-2 transmission. An individual-based transmission model
was used to (1) describe a second-wave COVID-19 epidemic in Australia; (2) evaluate the impact of
lockdown strategies used; and (3) evaluate effectiveness of alternative mitigation strategies. The
model was calibrated using daily diagnosed case data prior to lockdown. Specific social distancing
interventions were modelled by adjusting person-to-person contacts in mixing locations. Modelling
earlier activation of lockdown measures are predicted to reduce total case numbers by more than
50%. Epidemic peaks and duration of the second wave were also shown to reduce. Our results suggest
that activating lockdown measures when second-wave case numbers first indicated exponential
growth, would have been highly effective in reducing COVID-19 cases. The model was shown
to realistically predict the epidemic growth rate under the social distancing measures applied,
validating the methods applied. The timing of social distancing activation is shown to be critical to
their effectiveness. Data showing exponential rise in cases, doubling every 7–10 days, can be used
to trigger early lockdown measures. Such measures are shown to be necessary to reduce daily and
total case numbers, and the consequential health burden, so preventing health care facilities being
overwhelmed. Early control of second wave resurgence potentially permits strict lockdown measures
to be eased earlier.
An ongoing challenge faced by public health authorities during the COVID-19 pandemic is knowing when to
activate social distancing strategies, the magnitude of the measures, how to safely ease the measures once case
numbers reach low levels, and how best to react when a rapidly developing outbreak occurs. We report on a
detailed, model-based case study into the significant COVID-19 second wave in greater Melbourne, Australia,
from June 2020 onwards. This occurred as a result of ineffective management of the mandated hotel quarantine
policy for returning overseas travellers, where transmission is believed to have occurred between infectious
arrivals and security staff, then among the staff, and thus to their families and f riends1,2.
The aim of this study was to understand why the second wave of SARS-CoV-2 transmission grew so rapidly;
why the initial increase in social distancing response was ineffective; what responses would have been more
effective; and thus the lessons learned. The insights gained are of benefit to other countries and jurisdictions in
their determination of response policy.
The Australian response to COVID-19 has kept the country largely free from large-scale transmission, such as
occurred in Europe, the USA and Latin America, by halting flights from China in February, and stopping inbound
1
Department of Computer Science and Software Engineering, University of Western Australia, Perth,
Australia. 2School of Medicine, University of Western Australia, Perth, Australia. 3Department of Health,
Queensland Government, Brisbane, Australia. *email: george.milne@uwa.edu.au
Scientific Reports | (2021) 11:11958 | https://doi.org/10.1038/s41598-021-91418-6 1
Vol.:(0123456789)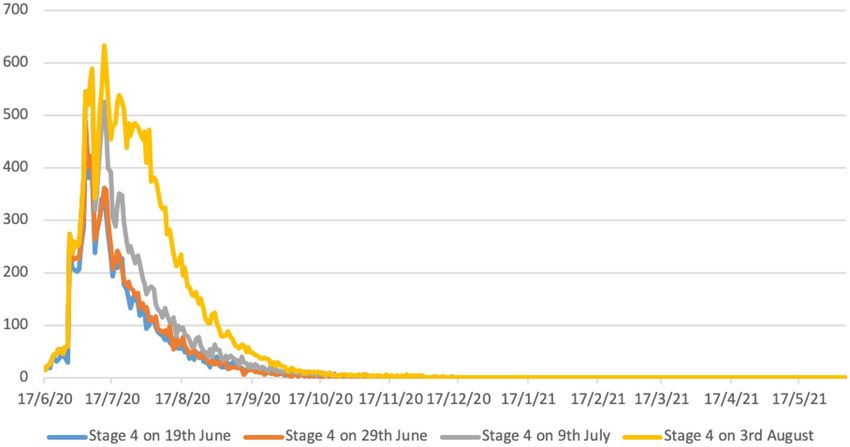
www.nature.com/scientificreports/
Figure 1. Daily COVID-19 case numbers State of Victoria, Australia. Total of 19,000 cases in greater
Melbourne, and 1000 in regional Victoria, to 30th October 20207,8.
travel by non-Australian residents from 20th March 2020. Robust social distancing measures were also adopted
country-wide on that date and further strengthened on 26th March 20203–5, resulting in substantial reductions
in person-to-person contact in workplaces and the community. These measures resulted in very low levels of
COVID-19 virus transmission, with almost all cases arising from returning Australians infected outside the
country. All arrivals were required to enter 14 days of managed hotel quarantine. Certain Australian states (e.g.
Western Australia and Queensland) also closed their interstate borders. The initial success of Australia in halting
the arrival of infectious individuals, and managing the limited number of community transmissions via testing
and contact tracing, allowed all Australian states to start easing social distancing measures from May onwards,
including allowing schools to reopen, as detailed in Table S1 in the Supporting Information. The total number
of COVID-19 related deaths for the whole of Australia was ~ 100 up to 6th May 2020, and stayed constant at that
number for the next 8 weeks. In late May, a breakdown in hotel quarantine regulations in Melbourne, State of
Victoria, followed by a number of unauthorised, large-scale family gatherings, allowed the SARS-Cov-2 virus to
enter the wider population in greater Melbourne, with diagnosed case numbers increasing from June o nwards6.
Case data resulting from this second wave outbreak provided us with a unique opportunity to analyse the non-
pharmaceutical (NPI) measures used, and the significance of their activation timing. This study was facilitated
by the fact that Australia’s second wave was geographically contained to greater Melbourne, and not impacted
by the ongoing introduction of infectious persons. This “self-contained” second wave provided us with high
quality data on daily case numbers, as in Fig. 1, allowing us to evaluate second wave response measures without
interference from introduced cases.
Methods
An individual-based (c.f. agent-based) model capturing the demographics and movement patterns of individuals
within an Australian city, together with SARS-CoV-2 virus transmission data from the early outbreak in Wuhan,
China prior to social distancing a ctivation9, was developed and applied. This model was used to analyse the
effectiveness of a broad suite of non-pharmaceutical, social distancing interventions, by varying their strength,
their time of activation, and their duration. Individual-based modelling is an appropriate method to adopt for
this task. It permits the effect of four key social distancing measures to be readily captured at a high degree of
detail: school closure; reduction in workplace participation; community-contact reduction; and case isolation.
Such simulation models create a “virtual world” of individuals whose population and disease biology dynam-
ics replicate that of the real-world system in as much detail as data sources permit. These data were used to model
the time-changing contact patterns for each individual, as they move between their household, school/workplace
contact hubs and in the wider community.
Our study utilised an established model of the city of Newcastle (population 272,407) in the state of New South
Wales, Australia. This city has population demographics which reflect that of Australia as a whole, and results
were scaled to greater Melbourne, population ~ 5 million, following an established approach used p reviously10,11.
This individual-based model was developed to match its real-world counterpart with respect to population, age,
household structure, employment, schooling, and daily movement between these locations through the use of
detailed census, workplace and mobility data from these communities, a model development and application
process used previously, e.g.12–14. They therefore create realistic representations of the respective communities
at an individual-by-individual level. The Newcastle model represents 272,407 people in the urban and suburban
Scientific Reports | (2021) 11:11958 | https://doi.org/10.1038/s41598-021-91418-6 2
Vol:.(1234567890)www.nature.com/scientificreports/
areas in and around Newcastle; this population is broadly representative of the Australian population as a whole
in terms of age distribution.
Australian Bureau of Statistics (ABS) census data were used to capture age-specific demographics of every
household in the community. Data for schools in terms of geographical location and pre-primary, primary and
secondary enrolment numbers for each school were obtained from the New South Wales state government. ABS
data were also used to determine household and workplace locations, and workforce sizes. These geo-located
data permitted us to assign adults to workplaces, and to assign children to neighbourhood schools. Furthermore,
available schools data was used to assign children from local households to age-specific c lasses15–18. All of these
data components enable the models to capture the movement and contact patterns of individuals on a day-by-
day basis, moving from specific households to schools and workplaces on working week days, and returning to
households in the evening. The model also captured semi-random contact in the community on both weekends
and, to a lesser extent, Monday through to Friday.
Model parameter settings were adopted to reflect the transmission characteristics of the COVID-19 epidemic
taken from9. These are an incubation period averaging 6 days, from infection to symptom emergence (if any); a
latent period averaging 5 days, from infection to infectious; an infectious period averaging 4.5 days, the first day
being asymptomatic; and 35% of cases are asymptomatic. Each infected individual transited through the four
SEIR states: susceptible; exposed but not infectious; infectious; then recovered, immune and no longer infectious.
The duration within each state followed the above timelines.
Using these infection timelines the model was then calibrated to reproduce a specific reproduction num-
ber. The probability of virus transmission from an infectious individual to a susceptible individual resulting
from their pairwise contact was derived for a R0 of 2.25, based on SARS-CoV-2 transmission characteristics
from Wuhan, China obtained prior to introduction of containment measures9,19, see Supporting Information.
The calibration process involved repeatedly adjusting the transmission probability parameter, which controls
transmission between pairs of infectious and susceptible individuals who are co-located, in a series of simula-
tion experiments. That is, running the model software with no social distancing strategies in place. For every
simulation experiment the resulting infection data for each infected individual infected was used to derive a
specific reproduction number. This process of adjusting the transmission probability parameter was continued
until a specific parameter was found to produce a reproduction number of 2.25.
Model outputs obtained by running the simulation software produced the infection history of every individual
in the community, generating the daily (and total) number of infectious individuals, and determining where
and when infection occur, as in12,20. Modelling analyses were conducted for alternative social distancing strate-
gies, by varying the strength of measures and their activation timing. This predicted how alternative mitigation
strategies would perform, allowing us to contrast alternative mitigation strategies with those used, in terms of
cases prevented.
Four social distancing measures were combined during the Melbourne COVID-19 second wave. School
closure (SC); workplace non-attendance (WN); community contact reduction (CCR); and case isolation (CI).
The effect of Stage 3 and Stage 4 social distancing measures on person-to-person contact patterns was estimated
from Victorian state government directives, such as for age-specific school non-attendance. Workplace and
community-wide contact reductions were estimated from the directives, and from observation of commuter
traffic reductions. The case isolation setting allowed for a limited level of non-compliance. Details of Stage 2,
Stage 3 and Stage 4 second wave response measures applied in greater Melbourne are described in the Support-
ing Information.
Simulation experiments were conducted by running model (simulation) software, after adjusting the strength
of social distancing measures to reflect introduction of Stage3 and Stage 4 restrictions. Random seeding of infec-
tious individuals into the model was used to capture the effect of localized high transmission events, resulting
from a number of large gatherings in late June 2 0202.
Seeding of infectious individuals into the model was stopped on 9th July 2020, thus all further infections
in the model occurred as a consequence of the breakdown in hotel quarantine measures and, subsequent large
family gatherings. This replicates what is known to have occurred, with genomic sequencing recently showing
that over 90% of all outbreak cases were due to a breakdown in quarantine measures, and arose from transmis-
sion between infected travellers and quarantine facility s taff1,2.
Results
Response timing. The Government of Victoria adopted a “stepped” response to their second wave COVID-
19 outbreak, from Stage 2 to Stage 3, then to Stage 4, as described in the Supporting Information. This is mod-
elled by the yellow epidemic curve in Fig. 2, which realistically predicts the dynamics of the reduction in daily
case numbers up to 30th October 2020, as in Fig. 1.
The rapid increase in diagnosed cases in greater Melbourne from 13th June 2020 onwards (see Fig. 1) suggests
that an opportunity existed to move from Stage 2 measures directly to Stage 4. Between 19th June and 29th June
case numbers were observed to double every 7 to 10 days, with observed exponential case growth, Fig. 1. Data
in Table 1, illustrated in Fig. 2, predict the potential benefit of early activation of Stage 4 “lockdown” measures
under alternative activation dates, 19th June, 29th June, 10th July (date of Stage 3 activation), the blue, orange
and grey curves respectively, Fig. 2. These illustrate the benefit, in terms of case number reductions, achieved by
early activation strategies, compared with the actual date of Stage 4 lockdown on August 3rd, yellow curve Fig. 2.
Table 1 highlights how moving to a Stage 4 “hard lockdown” on 9th July would have reduced total case num-
bers by approximately 40%, from ~ 25,000 to ~ 16,000 cases, up to May 2021. This corresponds to the smaller
area under the grey curve (9th July activation) in Fig. 2 compared to that under the yellow epidemic curve, which
Scientific Reports | (2021) 11:11958 | https://doi.org/10.1038/s41598-021-91418-6 3
Vol.:(0123456789)www.nature.com/scientificreports/
Figure 2. Predicted epidemic curves for earlier activation of Stage 4 lockdown measures in greater Melbourne
(population 5 million). Y axis represents daily diagnosed cases. All scenarios assume schools are closed, and
there is 90% case isolation for adults and 100% for children. X axis gives calendar dates; Y axis predicted case
numbers.
Stage 4, 19th Stage 4, 29th Stage 4, 9th Stage 4, 3rd
June June July Aug
Date new total new total new total new total
16/7/20 232 5884 251 6367 392 8005 455 8623
16/8/20 55 9689 68 10,544 91 13,975 235 20,975
16/9/20 23 10,622 14 11,544 25 15,503 48 24,326
16/10/20 3 10,904 5 11,749 6 15,897 10 24,996
16/11/20 1 10,972 0 11,790 3 16,006 1 25,139
16/12/20 1 10,987 0 11,790 0 16,037 1 25,210
16/1/21 2 10,998 0 16,040 0 25,219
16/2/21 2 11,009 0 25,222
16/3/21 0 11,015
Table 1. Predicted case numbers resulting from earlier Stage 4 activation in greater Melbourne (population 5
million). All scenarios assume schools are closed, and 70% case isolation for adults and 100% for children.
predicts total cases resulting from actual Stage 4 activation on 3rd August. Activating Stage 4 measures even
earlier, between 19 and 29th June, is shown to be even more effective, reducing total case numbers by over 50%.
Table 1 indicates that under all activation timings, Stage 4 measures are predicted to result in single digit
case numbers by the end of October 2020, and effectively halt virus transmission by early 2021. Modelling the
impact of the stepped measures introduced by the Government of Victoria, involving Stage 3 measures applied
on 9th July and Stage 4 on 3rd August, accurately predicted this decline in case numbers. This is observed by
comparing the yellow predicted 3rd August epidemic curve in Fig. 2, with diagnosed case data up to 30th Octo-
ber 2020, Fig. 1.
Response triggers. Throughout May 2020, daily case numbers in greater Melbourne had been steady and
in single figures. As in Fig. 1, reported daily case numbers began to increase throughout June and into July. Data
generated by our modelling analyses (Table 1) predicts that Stage 4 lockdown activated on 29th June, when daily
case numbers had grown to 61 (see paragraph below), may have reduced total case numbers by over 50%. If acti-
vated 10 days later, on 9th July, the reduction in total case numbers is less, reducing numbers by approximately
40%.
The following data sequence is from daily COVID-19 case data published by the Government of V ictoria7; 5
cases on 11th June, 10 on 13th, 20 on 16th, 25 on 19th, 33 on 24rd, 40 on 26th and 61 on 29th June 2020, 98 on
Scientific Reports | (2021) 11:11958 | https://doi.org/10.1038/s41598-021-91418-6 4
Vol:.(1234567890)www.nature.com/scientificreports/
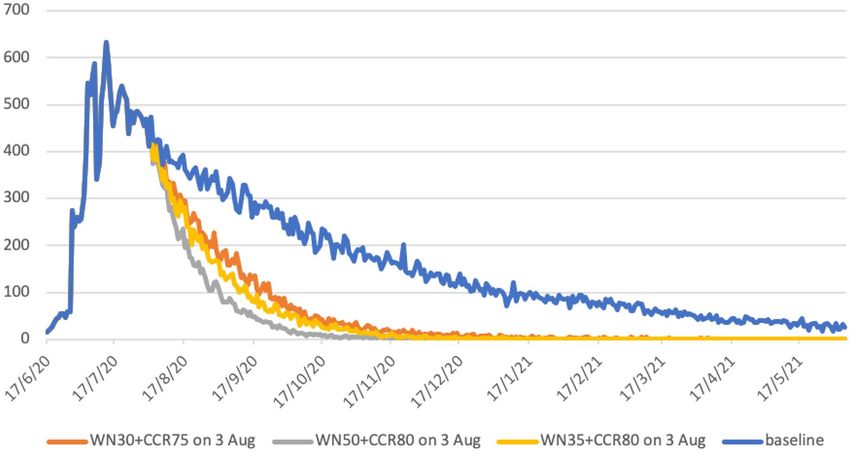
Figure 3. Increased social distancing activated on 3rd August 2020 in greater Melbourne (population 5
million). Grey curve models Stage 4 measures applied. Yellow and orange curves allow greater workplace
activity, increasing workplace attendance to 70% and 65% respectively. Blue curve represents continuation of
Stage 3 measures, i.e. no increase in social distancing. All scenarios assume schools are closed, and there is 90%
case isolation for adults and 100% for children. X axis gives calendar dates; Y axis predicted case numbers.
5th July, 122 on 7th, 143 on 9th and 218 on 14th July7,8. Note that reported case data is known to vary day-to-day,
as seen in Fig. 1, depending on numbers attending testing facilities, and varying between weekend and working-
week days. However, a clear pattern can be seen with this data sequence, with cases doubling approximately every
8–12 days from 16th June to 9th July, giving an exponential increase over that period, then increasing linearly
until mid-August 2020. This is illustrated in Fig. 18. The above results suggest that the exponential increase in
diagnosed cases during that period could have been used to trigger hard lockdown measures. If used, this trig-
gering approach is predicted to reduce virus transmission and resulting case numbers.
Activation of stronger social distancing, 9th July 2020. The State of Victoria responded to the COVID-
19 outbreak by increasing social distancing measures in two steps; Stage 3 measures on 9th July 2020, and given
the continuing increase in case numbers, strengthened measures to Stage 4 on 3rd August 202021. Modelling was
conducted to analyse the impact of this stepwise series of measures, and contrast these with the situation had
they not occurred. Stage 3 measures introduced on 10th July 2020, namely (SC100 + WN20 + CCR60 + CI70), see
Table S1 Supporting Information, were strengthened to Stage 4 on 3rd August, estimated to increase workplace
non-attendance to 50% and reduce community-wide contact to 20%, an 80% reduction. This resulted in social
distancing scenario (SC100 + WN50 + CCR80 + CI70), the grey curve in Fig. 3.
Data generated by these modelling experiments (Table 2) highlight the need for, and effectiveness of, the hard
lockdown measures taken, grey curve Fig. 3. Without them virus transmission is predicted to continue to at least
June 2021 had the Stage 3 measures been maintained indefinitely, blue curve Fig. 3.
Further modelling experiments were conducted to evaluate whether less restrictive Stage 4 strategies may have
had a similar benefit. The aim of these measures would be to lessen the economic impact of businesses closing
due to hard lockdown, by increasing workplace attendance.
This was achieved by (a) allowing small service businesses to reopen, i.e. cafes with staff returning, and (b)
larger workplaces increasing numbers working in-situ, rather than remotely. We evaluated two scenarios: (1)
reducing workplace non-attendance to 30% (so increasing attendance to 70%) and lessening the community
contact reduction to 75%, and (2) having workplace non-attendance at 35% and community contact reduction
staying at 80%. These gave the orange and yellow epidemic curves in Fig. 3, respectively.
For all three lockdown strategies, these changes in social distancing are predicted to result in minimal virus
transmission from mid-January 2021 onwards, with diagnosed case numbers at zero or one for all three strate-
gies (see Table 2, Fig. 3). The strategy reducing case numbers most rapidly corresponds to the Stage 4 measures
that were adopted, and described previously (Fig. 2, Table 1).
Strategies with a smaller reduction in workplace non-attendance, to (SC100 + WN30 + CCR75 + CI70) or
(SC100 + WN35 + CCR80 + CI70), also result in case numbers decreasing rapidly. Unsurprisingly, the weaker
alternative strategy of (SC100 + WN30 + CCR75 + CI70) is less effective in terms of outbreak duration, compared
to that with workplace non-attendance at 35% and community contact reduction staying at 80%, see Table 2.
The reduction in the total number of cases is approximately linear according to the strength of measures, from
31,386 for the strategy with highest workplace attendance of 70% (WN30), to 28,650 for workplace attendance of
Scientific Reports | (2021) 11:11958 | https://doi.org/10.1038/s41598-021-91418-6 5
Vol.:(0123456789)www.nature.com/scientificreports/
Baseline Stage WN50 + CCR80
3 10th July (no Stage 4 3rd WN30 + CCR75 WN35 + CCR80
Stage 4) August 3rd August 3rd August
Daily Total Daily Total Daily Total Daily Total
16/08/20 393 22,313 235 20,975 288 21,642 271 21,387
16/09/20 260 32,393 48 24,326 129 27,628 81 26,365
16/10/20 200 39,801 10 24,996 42 29,883 32 27,960
16/11/20 170 45,630 1 25,139 17 30,735 9 28,488
16/12/20 121 49,875 1 25,210 14 31,082 2 28,601
16/01/21 93 53,088 0 25,219 0 31,230 0 28,643
16/02/21 72 55,725 0 25,222 1 31,306 0 28,650
16/03/21 59 57,658 1 31,355
16/04/21 41 59,161 0 31,382
16/05/21 29 60,294 0 31,386
Table 2. Increased social distancing measures activated on 3rd August 2020, greater Melbourne (population 5
million). Daily cases mid-month and cumulative cases to 16th May 2021. All scenarios have Stage 3 measures
activated on 10th July 2020, all schools are closed, and 70% case isolation for adults and 100% for children is
assumed.
65% (WN35), and 25,222 for the Stage 4 measures used, with workplace attendance at 50% (WN50). This gives
reductions in cases of 47.7%, 52.3% and 58% respectively.
Predicted case data in Table 2 indicate that all three increased social distancing strategies are effective in
reducing epidemic duration, with daily case numbers in single figures by December 2020 or early 2021. This
contrasts to the situation which would result if Stage 3 measures had remained in place, illustrated by the blue
case curve in Fig. 3, and case data in the first columns of Table 2. Under that scenario, virus transmission and
new cases are predicted to occur up to and beyond May 2021.
Discussion
Early and robust application of social distancing measures are known to be an appropriate response to the
COVID-19 pandemic. In early 2020 such responses were highly effective in minimizing case numbers and the
rate of epidemic growth at the early stages of the pandemic, as in Korea and China22–24. Similarly, slow responses
have resulted in significant first and second pandemic waves, e.g. in Italy, Spain and the U K25.
This study’s aims were to provide further evidence on the benefit of, and need for, early and robust interven-
tions to contain second waves of coronavirus infections. We quantified the effectiveness of a range of response
measures, in terms of the reduction in case numbers, and thus resulting hospitalisations and deaths. These results
are intended to help inform the hard COVID-19 containment decisions that need to be made by politicians and
public health authorities, until an effective vaccine becomes available. A challenge in responding to COVID-19
second waves is to balance the effect of necessary lockdown measures, in protecting the health of the population,
with the negative impact which strict social distancing measures have on a country’s economy. A fundamental
issue highlighted in this study is the delay between increasing coronavirus transmission rates, and the time when
these manifest themselves as an increase in diagnosed cases. Given that case data always lags the date of virus
transmission, our findings indicate that activation of early lockdown is possibly the only feasible strategy to adopt.
Our study was fortunate in having access to comprehensive case data from the rapidly developing COVID-
19 second wave in greater Melbourne, Australia from June 2020 onwards. Genomic sequencing has shown that
most infections in this second wave result from a breakdown in hotel-based quarantine, followed by two large
family gatherings1,2. To our knowledge, there were no further introduced infections. This provided a suitable
test-bed to analyze the effectiveness of the mitigation measures taken, determine their failings, understand why
the second wave spread so rapidly, and to evaluate alternative mitigation strategies as to their effectiveness in
reducing the scale of a second wave. These analyses were facilitated by the absence of introduced cases into the
modelled population; the lack of “noise” from ongoing infection introduction allowed us to assume that all
infections resulted from the single source.
Using second wave outbreak data, we demonstrate how the methodology used realistically modelled SARS-
Cov-2 transmission from 1st August to 30th October 2020, when daily diagnosed case numbers had reduced to
zero. This prediction of outbreak dynamics provides validation of how lockdown social distancing measures were
modelled. That is, the impact which lockdown measures had on reducing transmission over the same period of
time. This validation provides evidence as to the robustness of the modelling methods used, and gives credence
to the results obtained.
Results indicate that the most effective response, which significantly reduce cases and second wave duration,
would be the activation of Stage 4 lockdown measures much earlier, when case numbers were first seen to increase
exponentially, on or before 29th June 2020. This approach is estimated to result in ~ 11,000 cases, compared to
~ 25,000 for the strategy taken, in a population of approximately 5 million (Table 2). The second most effective
strategy would have been to activate Stage 4 social distancing measures on 9th July, the date of the first response
to the second wave, which increased social distancing measures to Stage 3. This is estimated to reduce total
cases to ~ 16,000 (Table 2). These two highly effective strategies involved moving directly to Stage 4 measures
Scientific Reports | (2021) 11:11958 | https://doi.org/10.1038/s41598-021-91418-6 6
Vol:.(1234567890)www.nature.com/scientificreports/
from Stage 2, rather than the step-wise approach adopted, from Stage 2 to Stage 3 to Stage 4. They highlight
the need to “catch” increasing transmission rates before infections are widely distributed, with early and robust
social distancing contributing to the rapid reduction in virus transmission. The need for timely introduction of
lockdown measures is discussed in a short overview of the situation in the UK at the end of October 2020, by
Elisabeth Mahase26. It appears that the UK has been too slow to introduce hard lockdown, repeating the situation
which occurred in greater Melbourne, but on a much larger, country-wide scale. Significantly, the easing of social
distancing measures in the UK without high levels of testing and tracing has been shown in a recent modelling
study to result in a second COVID-19 w ave27, predicting the situation which now appears to have occurred26.
Had hard lockdown measures introduced on 3rd August in Australia not occurred, we estimate virus trans-
mission would be ongoing beyond the end of our simulation period (mid-May 2021), resulting in approximately
30 cases per day from February onwards (Fig. 3, Table 2). While the Stage 3 social distancing measures activated
in early July were predicted to results in a steady decrease in daily cases numbers, they did not lead to virus elimi-
nation by mid-2021. As a consequence, this would have limited the Government of Victoria’s ability to ease social
distancing and prevent another COVID-19 wave. This would have been a similar situation to that analysed by
Di Domenico and colleagues for Northern France28,29, and Aleta and colleagues for the North East of the USA30.
Our analyses support the decision by the State of Victoria Government to subsequently introduce Stage 4
lockdown measures, which rapidly suppressed ongoing transmission and shortened the duration of the second
wave. Once transmission reaches a level where social distancing measures can be safely eased, and new cases
managed by highly efficient test, track and isolate systems, this will permit an earlier reopening of businesses
and a more rapid increase in economic activity.
There is a challenge in relying on case diagnosis data to trigger activation of strict Stage 4 lockdown measures.
Governments are hesitant to introduce such socially disruptive measures given the impact they have on the
economy and mental health. However, if the decision to lockdown a city is taken too late, there will have been
significant “silent spread” of virus transmission before this increase in infections manifests itself as an increase
in diagnosed cases. Rather than using exponential growth in cases as the lockdown trigger, using a threshold
of cases per 100,000 of the population is an alternative approach, as is used in the UK. The Australian situation
is different in that the goal is to maintain an elimination strategy, via border control and quarantining of inter-
national arrivals. A small number of breakout infections into the community from quarantine facilities have
occurred in Australia since the large Melbourne outbreak analysed in our study, which itself resulted from such
a breakout. These have been successfully controlled by the rapid activation of short-term lockdown measures
coupled with high levels of localised testing and contact tracing, as a means of preventing a similar situation to
that which occurred in Melbourne in 2020. This early response strategy has allowed lockdown measures to be
quickly eased, as soon as daily case numbers are seen to have halted.
We note that the COVID-19 situation in Australia differs from most other countries, and while our key
findings are widely applicable, they may not be as effective in other settings due to import of infectious cases.
Prior to the second wave there was effectively no community transmission in Australia, due to early and strict
border closures. Many countries in Europe, for example, failed to close borders, allowing infectious individuals to
spread widely, with resulting widespread transmission, Secondly, the second wave of SARS-Cov-2 transmission
was confined to the State of Victoria, particularly to the greater Melbourne area, and ongoing travel restrictions
prevented introduction of further infections. This resulted in the effective elimination of virus transmission in
Australia by early November 20207.
It should be emphasised the key role which ongoing international border restrictions has had on the COVID-
19 situation in Australia. Without the closure of borders to non-residents, together with the use of 14 day hotel
quarantining of returning Australian travellers, a strategy of coronavirus elimination in Australia would not
have been possible.
Other countries experiencing second waves, or extensions of the first wave, are in a different situation, with
limited ability to achieve virus elimination. Other means are needed to reduce transmission levels, and highly
efficient testing, contact tracing and household isolation will be needed to contain case numbers to levels which
prevent health care facilities from being overwhelmed. Modelling by Aleta and colleagues, in a USA setting30,
demonstrates how high levels of testing, with 50% of symptomatic cases diagnosed, 14 day quarantine of all
members of a case’s household, and precautionary quarantine of contact households, may allow strict lock-
down measures to be safely eased. They show that this level of testing and isolation is needed to prevent second
COVID-19 waves. Similarly, modelling of methods to ease robust social distancing measures in the Paris region,
also indicate that extensive testing and tracing are needed to manage second waves28,29. The practical use of this
response methodology can be seen with South Korea, which adopted a sophisticated test/trace/isolate approach
from the early stages of the p andemic22,23. The effectiveness of this approach has been shown to prevent second
31
waves developing .
As with all model-based studies, there are limitations on what features we are able to replicate in detail, and
what approximations need to be taken. These involve availability of data, both at the virus transmission level and
the population level. We used an estimated basic reproduction number obtained from data gathered in Wuhan,
China prior to social distancing activation, and used that to estimate the probability of transmission between
two individuals. Detailed census data were used in model development, to create households, workplaces, and
education establishments in as much detail as data sources permitted. This allowed us to model movement of
individuals between their homes and work and education locations. However, mobility in the wider community
was estimated based on the probability of random contact between pairs of individuals, weighted by distance
from their homes. Obtaining data on actual population mobility, before and during periods of social distancing
restrictions, would aid the fidelity of individual-based models such as ours, but obtaining such data is clearly a
challenging task. While others have accessed de-identified mobile phone data to estimate movement throughout
a population, as i n30, an example of how identified data can be accessed and applied in practice is given by South
Scientific Reports | (2021) 11:11958 | https://doi.org/10.1038/s41598-021-91418-6 7
Vol.:(0123456789)www.nature.com/scientificreports/
Korea. Here there is general support for government agencies having detailed location and mobility data for the
whole population, as a public good. South Korea invested in Information Technology systems to manage future
pandemics following the SARS outbreak, and has been highly successful in keeping COVID-19 case numbers
low22,31. Heavy use of mobile phone data to track the majority of the population, instructing individuals in geo-
located “hotspot” areas to be tested, checking on compliance with home isolation, and informing residents of
specific areas going into lockdown22,23,31.
A further limitation of our study is the use of daily diagnosed case numbers as a surrogate for coronavirus
transmission occurring between 5 and 15 days earlier, an approximate propagation time period from date of
infection to symptom emergence, time to be tested, and the return of results. Diagnosed case data has a shorter
propagation delay than daily hospitalisation and mortality data, and so gives an earlier indication of increas-
ing levels of transmission, and can act as a trigger to increase social distancing measures, as described above.
However, this use of case data suffers from the need to make assumptions on the percentage of the population
who are asymptomatic following infection, and the percentage of symptomatic individuals who attend testing
facilities. In this study we assumed that 35% of those infected were asymptomatic, and that approximately half of
the remainder were diagnosed. COVID-19 hospitalisation data may act as a more accurate snapshot of previous
rates of transmission, but with a longer propagation delay from time of infection.
The effect of social distancing measures on transmission rates was modelled directly, by reducing person-
to-person contact in schools, workplaces and the wider community. These measures assumed that household
contact remained. Case isolation was modelled by stopping movement of diagnosed cases out-with the home,
allowing for a certain percentage of non-compliance. We assumed 70% compliance by adults and 100% for chil-
dren, in the absence of published data sources. Availability of contact pattern survey data during the pandemic
may have improved the fidelity of our model, and there is a hope that such data will be obtained and available
for future pandemic situations.
Health policy implications. Results from this study reinforce, and furthermore quantify, the benefit of
early activation of robust response measures to second (and more) COVID-19 infection waves. Such measures
are shown to significantly contain then reduce the epidemic growth rate, and consequential pressure on health
care resources. Results demonstrate the criticality of the timing of activation, where a slow response to rapid,
exponentially growing case numbers allows the coronavirus to spread widely within the population, before the
introduction of more robust social distancing measures can take effect. The study also shows the benefit arising
from border closure measures adopted for non-Australians by the Australian Government in late March 2020.
These prevented the ongoing introduction of SARS-CoV-2 into the community, until a breakdown in interna-
tional arrival quarantine measures initiated the second wave of transmission.
In the absence of prospective testing, policy makers rely on diagnosed case, hospitalization and mortality
data to inform decision making. All three metrics have inherent (and increasing) time lags; between date of
infection and becoming infectious, and the possibility of being diagnosed, hospitalized or dying, with case data
having the shortest “propagation delay”.
This study used a discrete COVID-19 second wave in Australia to demonstrate how exponentially increas-
ing diagnosed case numbers, numbers that doubled every 7–10 days, could have better predicted the need for
a significantly earlier activation of lockdown measures. Using daily case data as a lockdown “trigger” reinforces
the need for a comprehensive and rapid testing program, as described in a related study of lockdown and exit
strategies in France28,32. As of early November 2020, many countries worldwide still lack highly effective testing
and contact tracing systems, so limiting their ability to gain early warnings of a rapid growth in case numbers,
and respond as indicated in this study.
A significant challenge for many countries facing second waves of COVID-19 cases is how to balance the
negative effect which lockdown measures have on an economy, against the health of the population. It is clear
there is a hesitancy by decision makers to introduce robust social distancing measures, as evidenced by the step-
by-step approach adopted by the Government of Victoria, Australia, and evaluated in this study. This hesitancy
is understandable. Long-duration school closure impacts education outcomes, particularly among those from
low socio-economic backgrounds. Closure of cafes, restaurants and bars results in under-employment of young
adults, and has a knock-on effect on the economy. Closure of service and transport industries results in increased
unemployment, with these measures and home isolation impacting on the mental health of those affected.
Using data from the COVID-19 second wave in Australia, and analyzing alternative response strategies, the
study determined the benefit of going hard and early. This contrasts with the approach take in Victoria, where
social distancing measures were increased incrementally, resulting in the necessary hard lockdown measures
being activated after the coronavirus was widely distributed within the population. This study suggests the opti-
mal response strategy would be to go into lockdown much earlier, resulting in a significant reduction in case
numbers, consequential hospitalisations and, potentially, a reduction in the mortality rate.
Received: 1 March 2021; Accepted: 26 May 2021
References
1. Inquiry into the Victorian Government’s Response to the COVID-19 Pandemic (accessed 08 September 2020) https://www.parli
ament.v ic.g ov.a u/p
aec/f uncti on/1 000-p
aec/i nquir y-i nto-t he-v ictor ian-g overn
ment-s-r espon
se-t o-t he-c ovid-1 9-p
andem
ic (2020).
2. Melbourne hotel quarantine inquiry hears returned travellers connected to ’99 per cent’ of Victoria’s COVID-19 outbreak (accessed
08 September 2020) https://www.abc.net.au/news/2020-08-17/hotel-quarantine-inquir y-victoria-hears-from-medical-experts/
12564676 (2020).
Scientific Reports | (2021) 11:11958 | https://doi.org/10.1038/s41598-021-91418-6 8
Vol:.(1234567890)www.nature.com/scientificreports/
3. Update on coronavirus measures, 20 Mar 2020 (accessed 25 April 2020) https://w ww.p m.g ov.a u/m edia/u pdate-c orona virus-m easu
res-0 (2020).
4. Update on coronavirus measures, 22 Mar 2020 (accessed 25 April 2020) https://w ww.p m.g ov.a u/m edia/u pdate-c orona virus-m easu
res-220320 (2020).
5. Update on coronavirus measures, 24 Mar 2020 (accessed 25 April 2020) https://w ww.p m.g ov.a u/m edia/u pdate-c orona virus-m easu
res-24-March-2020 (2020).
6. Australia Coronavirus (accessed 01 September 2020) https://www.worldometers.info/coronavirus/countr y/australia/ (2020).
7. Victorian coronavirus (COVID-19) data (accessed 05 November 2020) https://www.dhhs.vic.gov.au/victorian-coronavirus-covid-
19-data (2020).
8. Coronavirus (COVID-19) at a glance – 30 October 2020 (accessed 02 November 2020) https://www.health.gov.au/resources/publi
cations/coronavirus-covid-19-at-a-glance-30-october-2020 (2020).
9. Li, Q. et al. Early transmission dynamics in Wuhan, China, of novel coronavirus-infected pneumonia. N. Engl. J. Med. 382(13),
1199–1207 (2020).
10. Milne, G. J., & Xie, S. The effectiveness of social distancing in mitigating COVID-19 spread: a modelling analysis. medRxiv
2020:2020.2003.2020.20040055.
11. Milne, G. J., Xie, S., & Poklepovich, D. A modelling analysis of strategies for relaxing COVID-19 social distancing. medRxiv
2020:2020.2005.2019.20107425.
12. Kelso, J. K., Halder, N. & Milne, G. J. Vaccination strategies for future influenza pandemics: a severity-based cost effectiveness
analysis. BMC Infect. Dis. 13(1), 81 (2013).
13. Milne, G. J. et al. Trivalent and quadrivalent influenza vaccination effectiveness in Australia and South Africa: results from a
modelling study. Influenza Other Respir. Viruses 10(4), 324–332 (2016).
14. Milne, G. J., Kelso, J. K., Kelly, H. A., Huband, S. T. & McVernon, J. A small community model for the transmission of infectious
diseases: comparison of school closure as an intervention in individual-based models of an influenza pandemic. PLoS ONE 3(12),
e4005 (2008).
15. Lake Macquarie – East (accessed 26 November 2019) https://q uicks tats.c ensus data.a bs.g ov.a u/c ensus_s ervic es/g etpro
duct/c ensus/
2011/quickstat/11101 (2013).
16. Newcastle (accessed 26 November 2019) https://quickstats.censusdata.abs.gov.au/census_services/getproduct/census/2011/quick
stat/11103 (2013).
17. 8165.0 - Counts of Australian Businesses, including Entries and Exits, June 2012 to June 2016 (accessed 17 May 2018) https://
www.abs.gov.au/Ausstats/abs@.nsf/0/49658AFA6CC395CECA2583A700121A41 (2017).
18. NSW government school enrolments by head count (2004–2018). In: 2004-01-01–2018-12-31. 2014-10-15 edn. (New South Wales
Department of Education: National Schools Statistics Collection, 2019).
19. Kucharski, A. J. et al. Centre for mathematical modelling of infectious diseases C-wg: early dynamics of transmission and control
of COVID-19—a mathematical modelling study. Lancet Infect. Dis. 20(5), 553–558 (2020).
20. Halder, N., Kelso, J. & Milne, G. A model-based economic analysis of pre-pandemic influenza vaccination cost-effectiveness. BMC
Infect. Dis. 14(1), 266 (2014).
21. Victoria’s restriction levels - COVID-19 (accessed 01 September 2020). https://www.dhhs.vic.gov.au/victorias-restriction-levels-
covid-19 (2020).
22. Park, S. W., Sun, K., Viboud, C., Grenfell, B. & Dushoff, J. Potential role of social distancing in mitigating spread of coronavirus
disease, South Korea. Emerg. Infect. Dis. J. 26(11), 2697 (2020).
23. Dighe, A. et al. Response to COVID-19 in South Korea and implications for lifting stringent interventions. BMC Med. 18(1), 321
(2020).
24. Yu, X.-Y. et al. Effective mitigation strategy in early stage of COVID-19 pandemic in China. Infect. Dis. Poverty 9(1), 141 (2020).
25. COVID-19 situation update for the EU/EEA and the UK, as of 4 November 2020 (accessed 04 November 2020). https://w ww.e cdc.
europa.eu/en/cases-2019-ncov-eueea (2020).
26. Mahase, E. Covid-19: UK government must “get its act together” as modelling suggests 85 000 deaths in second wave, experts say.
BMJ 371, m4242 (2020).
27. Panovska-Griffiths, J. et al. Determining the optimal strategy for reopening schools, the impact of test and trace interventions, and
the risk of occurrence of a second COVID-19 epidemic wave in the UK: a modelling study. Lancet Child Adolesc. Health 4(11),
817–827 (2020).
28. Di Domenico, L., Pullano, G., Sabbatini, C. E., Boëlle, P.-Y., & Colizza, V. Expected impact of lockdown in Île-de-France and pos-
sible exit strategies. medRxiv (2020).
29. Di Domenico, L., Pullano, G., Sabbatini, C. E., Boëlle, P.-Y. & Colizza, V. Impact of lockdown on COVID-19 epidemic in Île-de-
France and possible exit strategies. BMC Med. 18(1), 240 (2020).
30. Aleta, A. et al. Modelling the impact of testing, contact tracing and household quarantine on second waves of COVID-19. Nat.
Hum. Behav. 4(9), 964–971 (2020).
31. Lee, S. M. & Lee, D. Lessons learned from battling COVID-19: the Korean experience. Int. J. Environ. Res. Public Health 17(20),
7548 (2020).
32. Ferguson, N. et al. Report 9: impact of non-pharmaceutical interventions (NPIs) to reduce COVID19 mortality and healthcare
demand. Imp. Coll. Lond. 10, 77482 (2020).
Author contributions
G.M. and D.O. formulated the research project. G.M. wrote the main text of the manuscript. S.X. and D.P. con-
ducted simulation experiments and prepared the figures. All authors reviewed the manuscript.
Funding
Funding was provided by the Department of Health, Government of Western Australia and the Department of
Health, Government of Queensland, Australia.
Competing interests
The authors declare no competing interests.
Additional information
Supplementary Information The online version contains supplementary material available at https://doi.org/
10.1038/s41598-021-91418-6.
Correspondence and requests for materials should be addressed to G.J.M.
Scientific Reports | (2021) 11:11958 | https://doi.org/10.1038/s41598-021-91418-6 9
Vol.:(0123456789)www.nature.com/scientificreports/
Reprints and permissions information is available at www.nature.com/reprints.
Publisher’s note Springer Nature remains neutral with regard to jurisdictional claims in published maps and
institutional affiliations.
Open Access This article is licensed under a Creative Commons Attribution 4.0 International
License, which permits use, sharing, adaptation, distribution and reproduction in any medium or
format, as long as you give appropriate credit to the original author(s) and the source, provide a link to the
Creative Commons licence, and indicate if changes were made. The images or other third party material in this
article are included in the article’s Creative Commons licence, unless indicated otherwise in a credit line to the
material. If material is not included in the article’s Creative Commons licence and your intended use is not
permitted by statutory regulation or exceeds the permitted use, you will need to obtain permission directly from
the copyright holder. To view a copy of this licence, visit http://creativecommons.org/licenses/by/4.0/.
© The Author(s) 2021
Scientific Reports | (2021) 11:11958 | https://doi.org/10.1038/s41598-021-91418-6 10
Vol:.(1234567890)You can also read