THE 2019 NONPROFIT EMPLOYMENT REPORT - Johns Hopkins Center for Civil ...
←
→
Page content transcription
If your browser does not render page correctly, please read the page content below
JOHNS HOPKINS NONPROFIT ECONOMIC DATA PROJECT
                                                                                   Nonprofit Economic Bulletin no. 47 • January 2019

                                                Johns Hopkins Center for Civil Society Studies

                                                THE 2019
                                                NONPROFIT
                                                EMPLOYMENT
                                                REPORT

                                                Lester M. Salamon and
                                                Chelsea L. Newhouse
                                                with the technical assistance of
                                                S. Wojciech Sokolowski
l   l     l   l    l   l    l   l   l    l    l   l   The 2019 Nonprofit Employment Report        l   l    l   l   l   l    l   l     l   l   l   l

                        The 2019
              Nonprofit Employment Report
                                             Nonprofit Economic Bulletin no. 47 • January 2019

                                Lester M. Salamon and Chelsea L. Newhouse
                                                          with the technical assistance of
                                                        S. Wojciech Sokolowski

                                               Suggested citation:
         Lester M. Salamon and Chelsea L. Newhouse, “The 2019 Nonprofit Employment Report,” Nonprofit
         Economic Data Bulletin no. 47. (Baltimore: Johns Hopkins Center for Civil Society Studies, January
                                          2019). Available at ccss.jhu.edu.

        The authors wish to express their appreciation to the Charles Stewart Mott Foundation whose support made this
         report possible. The findings and interpretations reported here are those of the authors only, however, and may
         or may not be consistent with those of any entities with which the authors are affiliated or that have assisted or
                                                        supported the work.

                                              © Johns Hopkins Center for Civil Society Studies
                  This work is licensed under a Creative Commons Attribution-NonCommercial-NoDerivatives 4.0 International License.

                                        Salamon and Newhouse         •    Nonprofit Economic Bulletin #47
l l l l l l l l l l l l The 2019 Nonprofit Employment Report l l l l l l l l l l l l
l INTRODUCTION l
This report presents new data on employment and wages in private, nonprofit establishments in the United
States from 2007 through 2016, with a special focus on how nonprofit employment fared during the post-
recessionary period from 2012-2016.1
This report comes at a crucial time both for the nation and for the nonprofit sector given important policy
changes and challenges facing the sector. In particular, the Federal Tax Cut and Jobs Act passed in
December 2017 included several items that could have a negative effect on nonprofits’ ability to generate
private donations. For example, by greatly expanding the standard deduction available to individuals, the
tax bill will eliminate the tax incentives for giving for millions of taxpayers. According to one analysis: “this
change is projected to shrink charitable giving to nonprofits by $13 billion or more each year, leading to
the potential elimination of 220,000 to 264,000 nonprofit jobs.”2 Similarly, by doubling the exemption from
taxes on estates from $11 million to $22 million, the 2017 tax bill will likely reduce the incentives for high-
net-worth individuals to form charitable foundations or dedicate a portion of their estates to charity upon
their death. This, in turn, will further weaken a long-standing American ideal of avoiding the creation of
an aristocracy of wealth that perpetuates itself across generations. These changes come on top of recent
shifts in the form of government support to nonprofits from producer-side subsidies to consumer-side
subsidies such as vouchers and tax credits, which have further complicated the survival prospects for
nonprofits by encouraging for-profit firms, with their superior access to investment capital, to enter, and
ultimately dominate, fields in which nonprofit providers formerly held sway.3
Against this backdrop, information of the sort presented here can be of enormous importance to sector
leaders, government policy-makers, and citizens at large. What these data show, among other things,
is that nonprofit organizations are a far more sizable economic force in this country than is commonly
appreciated. They employ millions of people, generate huge wage payments that in turn lead to substantial
income and sale tax revenues for state and federal governments, and save governments further costs
through programs that reduce the incidence of a wide variety of social ills, from drug addiction to crime,
and spousal abuse.
The report is based on the unique and powerful body of data generated through the Quarterly Census of
Employment and Wages (QCEW), which is operated by state Labor Market Information agencies (e.g.,
the Department of Labor in New York or Maryland Department of Labor, Licensing, and Regulation) and
overseen at the federal level by the U.S. Bureau of Labor Statistics (BLS). QCEW is an administrative
data-set collected by states as a part of the federal Unemployment Insurance (UI) program and draws
1
For the purpose of this report, “nonprofit establishments” are defined as entities exempted from income taxation under
Section 501(c)(3) of the Internal Revenue Code (IRC). Included are private, nonprofit hospitals, higher education institutions,
day care centers, nursing homes, social service agencies, museums, orchestras and other cultural institutions, environmental
organizations, advocacy groups, clinics, and other similar organizations.
2
National Council of Nonprofits, “Tax Cuts and Jobs Act H.R.1: Nonprofit Analysis of the Final Tax Law,” Updated April 5, 2018.
Available at: https://www.councilofnonprofits.org/sites/default/files/documents/tax-bill-summary-chart.pdf.
3
Lester M. Salamon, The Resilient Sector Revisited: The New Challenge to Nonprofit America (Second Ed.). (Washington, D.C.:
Brookings Institution Press 2015).
page 1 • Nonprofit Economic Bulletin #47 • Salamon and Newhousel l l l l l l l l l l l The 2019 Nonprofit Employment Report l l l l l l l l l l l l
on the quarterly surveys of workplaces that state employment security offices have conducted since the
1930s. Under federal law, all nonprofit places of employment with four or more employees are required
to participate in the unemployment insurance system. However, 22 states also extend this requirement to
places of employment with one or more employees. Although the program does not cover self-employed
and family workers, QCEW data encompass approximately 97% of nonfarm employment, providing a
virtual census of employees and their wages as well as the most complete universe of employment and
wage data, by industry, at the State, regional, and county levels. In terms of nonprofit employment, the
exclusion of religious organizations as well as entities with less than four employees limits the coverage
somewhat; however, religious organizations may elect to be covered by the unemployment insurance
program and those that do are covered in the data. At this time the exact number of employees in tax-
exempt establishments not covered by QCEW is not known, but we estimate it to be no more than 3% of
total employment in the nonprofit sector.
The QCEW database has several advantages over alternative record systems available to track nonprofit
employment. Primary among these are: (a) nearly complete coverage of all nonprofit establishments in the
U.S.; (b) the use of the establishment, instead of the organization, as the unit of observation, which allows
pinpointing the exact location of the workers; (c) month-to-month and year-to-year records of the number of
people employed, and the average wages paid, by these establishments, broken down by major fields and
states; and (d) timely availability of the data. See Appendix A for greater detail about the QCEW and the
methodology used for this report.
BLS does not routinely separate data on nonprofit organizations from data on private business enterprises
and report on them separately. For this report, BLS undertook a special tabulation of employment in
nonprofit establishments using a technique initially developed by scholars at the Johns Hopkins Center for
Civil Society Studies. We are deeply grateful to the Charles Stewart Mott Foundation, which provided the
financial support that made this special tabulation possible, and to David Talan and his colleagues at the
Bureau of Labor Statistics, who carried out the tabulation.
The data reported here cover the 2016 reporting year, the latest year for which such tabulations are
available. BLS staff are already at work on a similar tabulation covering the 2017 reporting year as of this
writing.
To further explore the data covered in this report, as well as previous years’ data going back to 1991,
visit Nonprofit Works—An Interactive Database on the Nonprofit Economy, developed by the Johns
Hopkins Center for Civil Society Studies with support from the Charles Stewart Mott Foundation. The
database can be accessed at: ccss.jhu.edu/nonprofit-works.
Salamon and Newhouse • Nonprofit Economic Bulletin #47 • page 2l l l l l l l l l l l l The 2019 Nonprofit Employment Report l l l l l l l l l l l l
l KEY FINDINGS l
A MAJOR ECONOMIC FORCE
Economists regularly consider any industry or Figure 1. Nonprofit share of private
economic sector that employs 5% of a country’s employment, by state and territory, 2016
workforce to be a “major” industry or sector. It is
U.S. Average 10.2%
therefore notable that the 12.3 million paid workers District of Columbia 26.0%
employed by U.S. nonprofit establishments as of Vermont 18.8%
Maine 18.0%
2016 accounted for a substantial 10.2% of the total New York 17.7%
U.S. private workforce. In half the states, moreover, Massachusetts 17.7%
Rhode Island 16.5%
nonprofit jobs account for over 10% of all private North Dakota 15.7%
jobs, and in 10 states they account for 15% or more, Pennsylvania 15.6%
New Hampshire 14.8%
including states as diverse as Pennsylvania, North Minnesota 14.8%
Dakota, Maine, and Minnesota, as shown in Montana 14.7%
South Dakota 14.6%
Figure 1. Connecticut 14.6%
West Virginia 14.0%
Alaska 13.5%
In general, nonprofits comprise an above average Maryland 12.8%
share of the private workforce in the Northeast and Ohio 12.2%
Oregon 12.2%
mid-Atlantic regions and a below-average share in Wisconsin 11.9%
the West and the Southeast. In particular: Delaware 11.9%
Hawaii 11.6%
Illinois 11.3%
Of the 25 states above the national average,
èè Iowa 11.3%
Missouri
10 are located in the Northeast or Mid-Atlantic, Michigan
11.2%
10.8%
10 are in the Midwest, four are in the West, Nebraska 10.7%
and only one is in the Southeast. Indiana 10.0%
Washington 9.7%
New Jersey 9.6%
Of the 10 states with the lowest nonprofit share
èè Kentucky 9.6%
Arkansas 9.2%
of the private workforce, half are in the West, Virginia 9.0%
four are in the Southeast, and one (Oklahoma) Kansas 8.4%
North Carolina 8.4%
is in the Midwest. New Mexico 8.2%
Arizona 8.1%
Louisiana 8.1%
For the first time, we are able to examine Tennessee 8.1%
nonprofit employment data from the U.S. California 7.8%
Colorado 7.7%
territory of Puerto Rico—a timely development in Georgia 7.4%
light of the recent environmental and humanitarian Florida 7.2%
Idaho 7.1%
disaster brought about by Hurricane Maria. At 6.8% Puerto Rico 6.8%
of private employment, Puerto Rico’s nonprofit Oklahoma 6.7%
Utah 6.7%
sector is quite small compared to the national Mississippi 6.4%
average of 10.2%. Given the important role that Wyoming 6.1%
South Carolina 5.4%
nonprofits play in disaster relief and recovery, social Alabama 5.3%
service and health care delivery, and humanitarian Texas 5.1%
Nevada 2.7%
aid, this lack of established local nonprofit presence
0% 5% 10% 15% 20% 25% 30%
may very well have negatively impacted emergency
response and the subsequent recovery efforts. Nonprofit share of private employment
page 3 • Nonprofit Economic Bulletin #47 • Salamon and Newhousel l l l l l l l l l l l The 2019 Nonprofit Employment Report l l l l l l l l l l l l
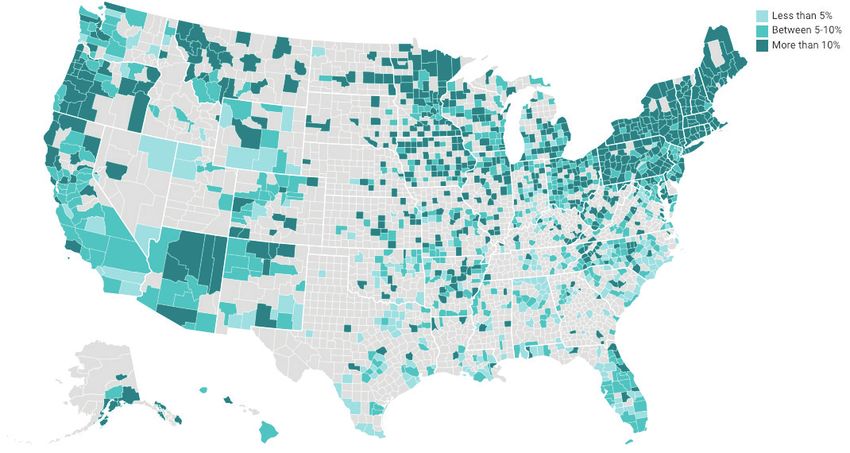
An even clearer picture of the relative position of nonprofit organizations vis-à-vis overall private
employment can be gained by examining this relationship at the county level. This is done in Figure 2,
which shows that nonprofits represented over 10% of total private employment in nearly half (48.4%) of
the 1377 counties for which county-level data are available. In another 34% of these counties, nonprofits
represented between 5 and 10% of private employment, and in only 18% of the counties was it under 5%.
Furthermore, the heavy presence of nonprofit employment in the Northeast, Mid-Atlantic, and Midwest
regions shows up especially vividly in these county level figures.
Figure 2. Nonprofit share of total private employment by county, 2016
Over 10%
5%-10%
Under 5%
Note: Data are not available for greyed-out counties due to BLS disclosure limitations.
See Appendix A for more information on BLS disclosure rules.
Salamon and Newhouse • Nonprofit Economic Bulletin #47 • page 4l l l l l l l l l l l l The 2019 Nonprofit Employment Report l l l l l l l l l l l l
THE THIRD LARGEST WORKFORCE
Not only is the nonprofit workforce sizable when compared to all private employment, but its considerable
scale is even more clearly apparent when compared to that of the 18 different “industries” into which
statisticians divide the American economy. As Figure 3 reveals, when viewed this way it becomes clear
that U.S. nonprofits employed the third largest workforce of any U.S. industry in 2016, behind only retail
trade and accommodation and food service, and on a par with manufacturing. The nonprofit sector has
held this third highest position among U.S. industries for well over a decade, though this is the first year in
which it came very close to edging out manufacturing.
With 12.3 million paid workers, nonprofits thus employ more workers than a number of major U.S.
industries. In particular, it employs:
Twice as many workers as the nation’s transportation, wholesale trade, and finance and
èè
insurance industries.
80% more workers than the nation’s construction industry.
èè
About 25% more workers than the nation’s professional, scientific, and technical services and
èè
administrative support and waste management industries.
Over five and a half times more workers than the nation’s real estate industry.
èè
Figure 3. Employment in nonprofits vs. key industries, 2016
Retail trade 15.73
Accommodation & food services 13.28
NONPROFIT SECTOR 12.29
Manufacturing 12.29
Administrative & waste services 8.86
Professional services 8.57
Construction 6.68
Wholesale trade 5.86
Finance & insurance 5.78
Transportation & warehousing 4.75
Information 2.73
Real estate, rental, & leasing 2.09
Agriculture, forestry, fishing, & hunting 1.26
0 2 4 6 8 10 12 14 16 18
Millions of employees
page 5 • Nonprofit Economic Bulletin #47 • Salamon and Newhousel l l l l l l l l l l l The 2019 Nonprofit Employment Report l l l l l l l l l l l l
Since the manufacturing sector Figure 4. Nonprofit employment as a percent of
is often seen as a bellwether
for the health and vitality
manufacturing employment, by state and territory, 2016
of a region’s economy, it is U.S. National 100%
District of Columbia 3134%
especially revealing to note
Hawaii 319%
the number of states in which New York 309%
nonprofit employment is not only Montana 279%
Maryland 264%
on a par with manufacturing
Alaska 249%
employment, but actually North Dakota 221%
exceeds it. This relationship Massachusetts 221%
New Mexico 191%
is highlighted in Figure 4, Delaware 174%
which reveals that nonprofits Rhode Island 169%
employ more workers than West Virginia 163%
Maine 163%
manufacturing in 26 states, Vermont 160%
including states as diverse as Florida 147%
South Dakota, West Virginia, Pennsylvania 141%
Wyoming 136%
Pennsylvania, and Hawaii. In New Jersey 135%
a further 5 states, nonprofits Connecticut 134%
represent over 85% of total New Hampshire 123%
South Dakota 121%
manufacturing employment. Arizona 117%
The District of Columbia, Colorado 116%
where nonprofits represent Virginia 115%
Minnesota 114%
3134% of total manufacturing Oregon 101%
employment, is, for obvious Illinois 100%
Missouri 99%
reasons, just an outlier, but one Over 100%
Louisiana 95%
that fits a widespread pattern. Nebraska 89%
Washington 86% 85%-99%
California 86%
Ohio 82% Under 85%
Nevada 71%
Georgia 70%
Iowa 69%
Michigan 66%
Oklahoma 65%
North Carolina 64%
Idaho 63%
Wisconsin 63%
Utah 63%
Puerto Rico 62%
Kentucky 60%
Texas 60%
Kansas 59%
Arkansas 59%
Tennessee 58%
Indiana 50%
Mississippi 40%
South Carolina 38%
Alabama 32%
0% 50% 100% 150% 200% 250% 300% 350%
Nonprofit employment as percent of manufacturing employment
Salamon and Newhouse • Nonprofit Economic Bulletin #47 • page 6l l l l l l l l l l l l The 2019 Nonprofit Employment Report l l l l l l l l l l l l
A MAJOR INCOME GENERATOR
Reflecting its considerable size, the nonprofit sector is the third largest generator of payroll income in the
United States, behind only professional services and manufacturing, as shown in Figure 5. The $638
billion in wages paid by this sector in 2016 thus represents:
Over 30% more than the wages paid by the nation’s retail trade industry (the largest
èè
industry in terms of overall employment).
Over 60% more than the payroll of the U.S. construction industry.
èè
Over 130% more than the wages paid by the nation’s accommodation and food
èè
service and information industries.
Over four and a half times the wages paid by the nation’s real estate industry; and
èè
Over fourteen times the payroll of the nation’s agriculture industry.
èè
Figure 5. Total annual wages paid by nonprofits vs. key U.S. industries, 2016 (billions)
Manufacturing $797.42
Professional services $783.30
NONPROFIT SECTOR $638.08
Finance & insurance $585.84
Retail trade $477.51
Wholesale trade $431.70
Construction $391.72
Administrative & waste services $335.21
Information $271.98
Accommodation & food services $266.03
Transportation & warehousing $239.85
Real estate, rental, & leasing $115.59
Agriculture, forestry, fishing, & hunting $41.84
$0 $100 $200 $300 $400 $500 $600 $700 $800 $900
Billions of dollars
page 7 • Nonprofit Economic Bulletin #47 • Salamon and Newhousel l l l l l l l l l l l The 2019 Nonprofit Employment Report l l l l l l l l l l l l
A DIVERSE SECTOR—PRESENT IN A WIDE ARRAY OF FIELDS
Nonprofit organizations are engaged in a bewildering variety of fields, ranging from arts and recreation to
social services and environment. Even within some of the major categories, significant variations exist.
Thus, health care embraces major hospitals, small clinics, and several types of nursing homes. Social
assistance covers sizable individual and family service agencies and small homeless shelters, food
pantries, and day care centers, to name just a few.
To make sense of this enormous variety, however, it is useful to zero in on three major blocks of activity
that together account for the vast majority (81%) of U.S. nonprofit jobs: i.e., health care, education, and
social assistance. More specifically, as Figure 6 shows:
Over half (55%) of all nonprofit jobs in the U.S. are in the health care field. Hospitals account for
èè
the bulk of these jobs, employing 34% of the nation’s total nonprofit workforce, or roughly 1 out of
every 3 nonprofit workers. Health clinics and nursing homes account for the additional 21%.
Fourteen percent of all nonprofit jobs in the U.S. are in educational services, including private
èè
elementary and secondary schools, colleges, universities, and other educational facilities.
Twelve percent of all nonprofit jobs in the U.S. are in social assistance. This includes
èè
employment in individual and family services, community food services, housing services,
vocational rehabilitation, and child day care.
Figure 6. Distribution of nonprofit employment by field, 2016
Professional services, 2%
Other fields^, 2%
Arts & recreation, 3%
Ot
he
rs
As
erv
so
c ia
ic e
t io %
ns 34
s,
s,
*, al
pit
4%
7% s
Ho
Soc ial as
sistance,
12%
Am
bu
Nu rs ing ho me s,
lat
%
or
16
y
*Religious, grantmaking, civic,
n,
he
t io
professional, and similar organizations
al
ca
th
such as environmental groups.
u
,1
Ed
1
%
^Includes administrative and support
10 %
services and retail trade.
Salamon and Newhouse • Nonprofit Economic Bulletin #47 • page 8l l l l l l l l l l l l The 2019 Nonprofit Employment Report l l l l l l l l l l l l
As might be expected, in the fields in which nonprofits concentrate they constitute an especially large
share of private employment. Thus, as Figure 7 shows, nonprofits account for:
èè
Nearly three quarters (71%) of the nation’s private employment in education (though this figure
is closer to 16% when account is taken of employment in public educational institutions).
èè
Over 42% of private employment in social assistance.
èè
Over 43% of private employment in health services, including:
ll84% of private employment in hospitals.4
llOver a third of private employment in nursing homes.
llNearly 20% of private employment in ambulatory health care.5
Figure 7. Nonprofit share of private employment, by selected field, 2016
ALL EDUCATION* 71.4%
Higher 92.1%
Elementary & secondary 84.8%
ALL HEALTH CARE 43.6%
Hospitals* 84.0%
Nursing homes 35.7%
Ambultory health 19.1%
Social assistance 42.3%
Arts & recreation 15.5%
0% 10% 20% 30% 40% 50% 60% 70% 80% 90% 100%
Nonprofit share of private employment
*Excludes employment in government-operated institutions.
4
With public hospitals included as well, nonprofits account for 66% of total hospital employment.
5
This figure likely understates the nonprofit role in this field because it compares nonprofit employment in what are mostly clinics
and home health organizations to for-profit employment that includes all offices of private doctors and dentists.
page 9 • Nonprofit Economic Bulletin #47 • Salamon and Newhousel l l l l l l l l l l l The 2019 Nonprofit Employment Report l l l l l l l l l l l l
HIGHER AVERAGE WAGES
IN MOST FIELDS
Nonprofits are frequently thought to pay Figure 8. Nonprofit vs. for-profit average weekly
lower salaries than are available from private, wages, selected fields, 2016
for-profit businesses. As Figure 8 shows,
however, this widespread assumption does Nonprofit For-profit
not find support in the data. To the contrary,
in all but three of the industries in which $552
Social assistance
nonprofits concentrate, they also tend to pay $356
somewhat higher average weekly wages
than for-profit enterprises operating in the
same fields. This provides further evidence $1,364
Ambulatory health
of the value of nonprofits not only as sources
$1,101
of employment, but also as generators of
competitive wages. In particular:
$1,029
Nonprofit social assistance
èè ALL EDUCATION
organizations pay 55% more than $708
for-profits operating in the same field.
$1,224
Nonprofit educational institutions
èè Higher
$961
pay on average 45% more than
for-profit educational institutions. $780
This includes an average of 7% Elementary
& secondary
more in elementary and secondary $728
schools and 27% more in colleges,
universities, and professional schools.
$1,196
Hospitals
Nonprofit ambulatory health care
èè $1,051
organizations pay 24% more on
average than for-profits in that field.
$598
Nonprofit hospital weekly wages
èè Nursing homes
$573
exceed those of for-profits by 14%.
Nonprofit nursing homes pay an
èè $561
average of 4% more than for-profit Arts & recreation
$735
homes.
$0 $500 $1,000 $1,500 $2,000
In only three of the major fields in
èè
Average weekly wage
which nonprofits operate do for-profit
firms pay higher average weekly
wages than nonprofits, but these are
all non-human service fields and the
special case of the arts.
Salamon and Newhouse • Nonprofit Economic Bulletin #47 • page 10l l l l l l l l l l l l The 2019 Nonprofit Employment Report l l l l l l l l l l l l
A RELIABLE CONTRIBUTOR TO JOB GROWTH
As Figure 9 shows, the nonprofit sector saw significant growth over the period 2007 to 2016, increasing its
workforce by a total of 16.7%. Especially notable was the growth during the recessionary period following the
2007-08 financial crisis. During this 2007-2012 period, nonprofits boosted their employment by 8.5% while for-
profit businesses reduced employment by an aggregate total of 4.1%—a loss of more than 4 million jobs.6 This
likely reflects the combination of the counter-cyclical programs already on the federal government’s books and
the passage of the Affordable Care Act, which pumped additional support into the health care arena, where
nonprofits are especially active. For-profits recovered significantly in the latter portion of this 10-year period, but
nonprofits continued to grow their employment base as well. As a result, over the entire 2007 to 2016 period
nonprofits outpaced for-profit job growth by a factor of almost four times (16.7% vs. 4.6%).
Figure 9. Employment growth rate, nonprofit vs. for-profit, 2007-2012, 2012-16, 2007-16
20% Nonprofit For-profit
16.7%
15%
Percent change
10% 9.1%
8.5%
7.6%
5%
4.6%
0%
-5% -4.1%
2007-2012 2012-2016 2007-2016
6
See: Lester M. Salamon, Stephanie L. Geller, and S. Wojciech Sokolowski, “Holding the Fort: Nonprofit Employment During a
Decade of Turmoil,” Nonprofit Economic Bulletin No. 39, Johns Hopkins Center for Civil Society Studies, 2012. Available at: http://
ccss.jhu.edu/publications-findings/?did=369.
page 11 • Nonprofit Economic Bulletin #47 • Salamon and Newhousel l l l l l l l l l l l The 2019 Nonprofit Employment Report l l l l l l l l l l l l
This pattern of vigorous nonprofit job growth through the Table 1. Nonprofit employment growth
recession period of 2007-12 was evident in virtually every rates, 2007-2012, 2012-2016, 2007-2016
state, moreover, as shown in Table 1. In fact, in 23 of
the states the growth of nonprofit jobs during this period 2007-2012 2012-2016 2007-2016
exceeded 10%. Included here were states such as National 8.5% 7.6% 16.7%
Alabama 5.6% 7.4% 11.3%
Maryland, Virginia, and Delaware where nonprofit jobs
Alaska 16.3% 14.6% 20.2%
were already quite substantial, as well as states such Arizona 16.1% 7.4% 30.3%
as Georgia, Arkansas, and Idaho, where their presence Arkansas 10.2% 6.6% 17.4%
is more limited. What is more, this growth was widely California 10.0% 9.9% 18.2%
sustained during the subsequent post-recession period Colorado 14.4% 13.1% 29.4%
of 2012-2016. As a consequence, 19 states recorded a Connecticut 9.6% 5.3% 14.8%
Delaware 14.7% 7.1% 27.5%
nonprofit employment growth rate of 20% or more over District of Columbia 11.1% 8.1% 18.9%
the full decade from 2007-2016, and an additional 13 Florida 9.1% 5.9% 22.0%
states recorded increases of 15-19% during this same Georgia 10.1% 13.2% 24.6%
extended period. Hawaii 6.2% 6.4% 15.1%
Idaho 18.9% 5.4% 36.7%
Illinois 6.2% 5.6% 11.7%
Indiana 12.1% 3.7% 18.7%
NONPROFIT MARKET SHARE: Iowa
Kansas
5.4%
6.7%
11.5%
8.8%
8.5%
7.3%
A MIXED BAG Kentucky
Louisiana
11.8%
16.6%
7.6%
12.2%
20.3%
33.6%
Maine 7.9% 6.4% 14.3%
While nonprofits exceeded the employment growth Maryland 10.0% -3.5% 12.1%
rate of the for-profit sector overall, a different picture Massachusetts 5.9% 6.8% 14.5%
is evident in many fields that nonprofits have long Michigan 1.0% 6.3% 4.7%
dominated. In particular, for-profit employment in a Minnesota 9.1% 5.9% 19.9%
Mississippi 9.5% 4.6% 15.7%
number of traditional nonprofit fields grew faster than
Missouri 9.2% 8.5% 16.3%
nonprofit employment. In other words, the counter- Montana 11.2% 5.6% 17.7%
cyclical social policies that sustained nonprofit Nebraska 7.4% 13.3% 13.8%
employment growth during this period also attracted Nevada 10.9% 4.7% 29.1%
New Hampshire 7.6% 5.8% 16.8%
for-profit growth in these same fields. Thus:
New Jersey 3.7% 9.5% 6.8%
New Mexico 7.2% 1.2% 12.2%
While nonprofit employment in the nursing
èè New York 5.6% 1.8% 12.3%
and residential care field grew by North Carolina 15.8% 2.9% 21.9%
North Dakota 15.3% 15.0% 23.2%
4.1% between 2007 and 2012, for-profit
Ohio 6.7% 3.0% 15.9%
employment in this field grew by nearly 11%. Oklahoma 9.6% 5.9% 16.7%
Oregon 9.5% 8.4% 24.0%
In the hospital field, for-profit employment
èè Pennsylvania 5.5% 16.6% 7.4%
growth outpaced nonprofit employment Puerto Rico 4.9% 14.7% 6.1%
growth 10.2% to 5.3%. Rhode Island 0.0% -0.4% -3.5%
South Carolina 15.2% 11.1% 28.3%
In social assistance, for-profit employment
èè South Dakota 14.8% 0.5% 21.2%
growth outpaced nonprofit growth roughly Tennessee 6.4% 8.6% 14.3%
Texas 13.2% 11.8% 26.1%
20% to 8.4%.
Utah 14.7% 3.3% 33.8%
And in the education field, the for-profit
èè Vermont 9.7% 1.9% 19.4%
Virginia 12.3% 5.2% 23.0%
edge was 25% to barely 10%. Washington 13.7% 6.6% 30.4%
West Virginia 9.7% 16.4% 16.6%
Wisconsin 8.0% 11.4% 11.8%
Wyoming 4.1% 3.5% 3.7%
Salamon and Newhouse • Nonprofit Economic Bulletin #47 • page 12l l l l l l l l l l l l The 2019 Nonprofit Employment Report l l l l l l l l l l l l
A a consequence, in a number of the most significant of these fields, for-profits continued to cut into the
nonprofit market share. In particular, as shown in Figure 10:
In nursing and residential care facilities, nonprofit employment went from
èè
38.7% of all private employment in 2007 down to 35.7% in 2016.
In hospitals, it went from 85.4% in 2007 to 84.0% in 2016.
èè
In education, it declined from 72.2% in 2007 to 71.4% in 2016.
èè
And most significantly in social assistance, it dropped from 56.9% to 42.3%.
èè
Figure 10. Change in nonprofit share of private employment, by industry, 2007 vs. 2016
2007 2016
9.2%
Total private 10.2%
85.4%
Hospitals 84.0%
72.2%
Education 71.4%
55.8%
Associations 59.0%
56.9%
Social assistance 42.3%
38.7%
Nursing homes 35.7%
16.2%
Ambulatory health 19.1%
13.1%
Arts & recreation 15.5%
9.2%
Management of companies 11.9%
3.1%
Professional services 3.0%
2.1%
Information 2.4%
0.9%
Administrative & waste services 1.1%
0.3%
Retail trade 0.6%
0% 10% 20% 30% 40% 50% 60% 70% 80% 90%
Nonprofit share of private employment
In short, while the data demonstrate the resilience of the nonprofit sector in the face of tough economic
circumstances they also demonstrate the increasingly competitive environment in which nonprofits are
having to operate.
page 13 • Nonprofit Economic Bulletin #47 • Salamon and Newhousel l l l l l l l l l l l The 2019 Nonprofit Employment Report l l l l l l l l l l l l
l CONCLUSION l
The data presented in this report demonstrate that the nonprofit sector is not only a significant employer, but
also a significant contributor to employment growth even in recessionary periods of the sort that occurred
in the wake of the 2007 financial crisis. This resilience is due in important part to the overall shift in America
toward a service economy, demographic trends such as the aging of the population and the expanded
female participation in the labor force that are boosting demand for the kinds of services that nonprofits have
traditionally provided, the expansion of government funding for many of these services, and the counter-cyclical
nature of many of the government “safety net” programs, which causes funding to expand when recessionary
pressures disrupt normal sources of revenue.
However, nonprofits are not the only institutions benefiting from these trends. To the contrary, for-profit firms
have increasingly entered these service fields as well. The fact that government has shifted from producer-side
subsidies such as grants to consumer-side subsidies such as tax expenditures and vouchers has intensified
this trend by channeling increasing shares of government support through the market, where for-profits have
inherent advantages. For-profits also benefit from their superior access to investment capital through the
issuance of stock, which gives them an edge in responding quickly to increases in demand occasioned by new
or expanded governmental support. In addition, for-profits are less held back than are nonprofits by mission-
related constraints on the types of clients they should primarily serve, giving them greater access to paying
customers. The upshot has been an uneven playing field for nonprofit providers and a resulting steady loss of
nonprofit market share even as the overall scale of nonprofit employment has increased.
While competition certainly has its place in this field as in many others, the competition needs to be on a level
playing field, particularly given the special contributions that nonprofits have been found to make in devising
innovative forms of service, serving more disadvantaged clients, and staying the course even when economic
circumstances turn sour. These findings therefore have significant practical implications for both nonprofit
stakeholders and policy makers. In the first place, they demonstrate the significant job creation potential of the
nonprofit sector, especially during recessions, and therefore highlight the need to keep this sector’s potentials
in view as national and regional efforts to boost job growth are put in place. Among other things, these findings
demonstrate why job promotion efforts that operate exclusively through the income tax mechanism are
insufficient because they discriminate against this important set of job-creators for which income tax incentives
have little effect. So, too, government contracting regimes that select providers of government-funded services
purely on the basis of the lowest unit cost of services can inadvertently squeeze out some of the major
features that make nonprofits special, such as their community-building activities and their charity care. Finally,
expanded efforts are needed to overcome the structural impediment that nonprofits face in raising capital due
to the prohibitions that bar them from sharing profits with investors and therefore prevent their access to equity
finance through the issuance of shares. Expanded interest subsidies and loan guarantees are among the
interventions that can help in this area.
Despite the growth of the for-profit presence in many traditional nonprofit fields, the nonprofit sector remains
a crucially important provider. To date, the sector has shown remarkable resilience in the face of significant
economic pressures and competitive challenges. With public funding under siege and private resources
strained, however, the nonprofit job engine is under increasing pressure, with clear evidence of loss of market
share in crucial fields. If evidence of the sort provided here can call attention both to the strengths that this
sector has displayed and some of the challenges it now faces, it will have served its purpose well.
Salamon and Newhouse • Nonprofit Economic Bulletin #47 • page 14l l l l l l l l l l l l The 2019 Nonprofit Employment Report l l l l l l l l l l l l
APPENDIX A: METHODOLOGY
Quarterly Census of Employment and Wages (QCEW)
The data on IRS Section 501c(3) tax exempt entities reported here come from the Quarterly Census of
Employment and Wages (QCEW), which is administered by state Labor Market Information agencies under
the supervision of the Bureau of Labor Statistics (BLS) in the U.S. Department of Labor. QCEW is an
administrative dataset collected by states as a part of the federal Unemployment Insurance (UI) program and
draws on the quarterly surveys of workplaces that state employment security offices have conducted since
the 1930s. Under federal law, all nonprofit places of employment with four or more employees are required to
participate in the unemployment insurance system. However, 22 states also extend this requirement to places
of employment with one or more employees.
The principal exclusions from the QCEW dataset vary by state and include employees of religious
organizations, railroad workers, small-scale agriculture workers, self-employed workers, domestic service
workers, crew members on small vessels, state and local government elected officials, and insurance and real
estate agents who receive payment solely by commission. However, QCEW data encompass approximately
97% of nonfarm employment—providing a virtual census of employees and their wages as well as the most
complete universe of employment and wage data, by industry, at the State, regional, and county levels. In
terms of nonprofit employment, the exclusion of religious organizations as well as entities with less than
four employees is the most significant; however, religious organizations may elect to be covered by the
unemployment insurance program and those that do are covered in the data. At this time the exact number of
employees in tax-exempt establishments not covered by QCEW is not known, but we estimate it to be no more
than 3% of total employment in the nonprofit sector.
Finding Nonprofits in the QCEW
While nonprofit places of employment have long been covered by the QCEW surveys, the data generated by
these surveys have never broken out the nonprofit employment separately from the for-profit employment. As a
consequence, the nonprofit sector has essentially been buried in the data. To remedy this, the Johns Hopkins
Center for Civil Society Studies’ Nonprofit Economic Data Project developed a methodology for identifying
nonprofit employers in the QCEW micro-data by record matching with the publicly available register of tax
exempt entities maintained by the Internal Revenue Service (IRS). The nonprofit micro-data were subsequently
aggregated by county and fields of activity to meet the federal disclosure rules mandated by law to protect the
confidentiality of company specific information.
The result is the most accurate and up-to-date picture of nonprofit employment yet available. This is so
because the QCEW data have a number of critical advantages over other data sources available to shed light
on nonprofit employment trends. In particular, these data:
llAre collected every quarter;
llAre closely monitored and verified for accuracy by the Labor Market Information offices of state
Employment Security agencies and the federal Bureau of Labor Statistics;
llAre collected at the establishment level rather than the organization level, which is important to avoid
distortions otherwise caused by the existence of multipurpose and multi-location organizations;
page 15 • Nonprofit Economic Bulletin #47 • Salamon and Newhousel l l l l l l l l l l l The 2019 Nonprofit Employment Report l l l l l l l l l l l l
llCover employment and wages, which is especially relevant for gauging the operations of labor-
intensive entities such as nonprofits;
llAre comprehensive, covering about 97% of all nonprofit employment;
llClassify the results using a classification structure that is widely used in other official economic data
series, thus facilitating cross-sector comparisons; and
llCover for-profit and government places of employment in the same data system, which facilitates
systematic comparisons among the sectors, a matter of increasing importance.
In 2014, BLS started releasing its own generated nonprofit data on a 5-year cycle at the national and state
level but not the county level, following a methodology of record matching similar to that pioneered by the
Johns Hopkins researchers. However, BLS improved that methodology by adding organizations called
“reimbursables” that were not included in the IRS business register. Reimbursables are organizations that
under state unemployment laws are not required to pay unemployment insurance contributions each quarter,
but rather are allowed to reimburse the unemployment insurance system when a claim is made. Most states will
restrict such units to 501(c)3 nonprofits. The QCEW micro data include information on reimbursables. The 2016
data utilized in this report were the result of a special tabulation produced by the BLS thanks to funding support
provided by the Charles Stewart Mott Foundation, and included county-level data. More information, including
the full data tables on nonprofit employment and wages, are available from the BLS at: bls.gov/bdm/nonprofits/
nonprofits.htm.
Data Limitations and Suppression
The primary limitation of the nonprofit employment data come from the federally mandated disclosure rules
that require suppression of statistical information that allows the identification of single institutional units.
This suppression is applied at the industry level. In practice, this suppression can take two forms. First, the
so-called “primary suppression” is applied when aggregates contain fewer than 3 units or when a single
unit exceeds 80% of the aggregate total. Due to the large number of nonprofit aggregates in these data, the
primary suppression rules that guided the data assembly by JHU researchers are somewhat stricter and
require at least 10 units per aggregate and a maximum 75% of the aggregate total per single unit. In addition,
the so-called “secondary suppression” must be applied if the value of the non-disclosable aggregate can be
calculated from the disclosed values (e.g. by subtraction); when this is the case, the disclosure of additional
aggregates must also be suppressed to eliminate this possibility.
For the purpose of this report, we focus on the “charitable” portion of the nonprofit sector because this
is the portion that most people have in mind when they think about the nonprofit sector. This includes all
organizations registered with the U.S. Internal Revenue Service under Section 501(c)(3) of the Internal
Revenue Code, which embraces private not-for-profit hospitals, clinics, colleges, universities, elementary
schools, social service agencies, day care centers, orchestras, museums, theaters, environmental
organizations, homeless shelters, soup kitchens and many more.
For more information about the methodology used to produce this report please contact ccss@jhu.edu or the
BLS Business Employment Dynamics information line (available via the BLS link above).
Salamon and Newhouse • Nonprofit Economic Bulletin #47 • page 16ABOUT THE JOHNS HOPKINS CENTER FOR CIVIL SOCIETY STUDIES
The Johns Hopkins Center for Civil Society Studies is a leading source of ground-
breaking research and knowledge about the nonprofit sector, social investing, and
the tools of government. Working in collaboration with governments, international
organizations, investment innovators, and colleagues around the world, the Center
encourages the use of this knowledge to strengthen and mobilize the capabilities and
resources of the public, nonprofit, and for-profit sectors to address the complex problems
that face the world today. The Center conducts research and educational programs that
seek to improve current understanding, analyze emerging trends, and promote promising
innovations in the ways that government, civil society, and business can collaborate to
address social and environmental challenges.
ABOUT THE NONPROFIT ECONOMIC DATA PROJECT (NED)
Nonprofit organizations are facing increased pressures in states and localities throughout
the United States, but the nonprofit sector’s ability to respond to these pressures has
been limited by a lack of timely information about how prevailing economic realities are
affecting the sector. The Johns Hopkins Nonprofit Economic Data Project (NED) is
helping to tackle this problem by charting economic trends in the nonprofit sector, and
producing cutting-edge reports on key components of the nonprofit economy in regions
and states across the country. Tapping a wide assortment of the best data sources
available, the Center’s NED reports cover nonprofit employment, revenues, expenditures,
assets, philanthropic resources, and volunteering for the sector as a whole and in
particular fields, such as health, education, social services, and arts and culture. They
also document changes over time and reveal how nonprofits stack up in comparison to
for-profit organizations overall and in key nonprofit fields. Over 40 such reports have
been prepared, making it possible for nonprofit leaders to put their sector on the mental
maps of policy-makers, the media, the sector itself, and citizens at large. For information
on how you can commission a report on the nonprofit economy in your state or region,
contact chelsea.newhouse@jhu.edu.
ABOUT NONPROFIT WORKS (ccss.jhu.edu/nonprofit-works)
To broaden access to these data, with support from the Charles Stewart Mott
Foundation, the Johns Hopkins Center for Civil Society Studies has developed Nonprofit
Works—An Interactive Database on the Nonprofit Economy, to bring solid data
on nonprofit employment, establishments, and wages to every nonprofit, foundation,
umbrella organization, and government agency in the country. Nonprofit Works data
are available at the national, state, and major county levels and can be sorted by field.
Users can compare nonprofit employment and wage levels in their own state or county
to those in other regions, and can do so by field and sub-field. In addition, comparisons
can be drawn between nonprofit and for-profit firms in the same fields and assessments
undertaken to gauge the adequacy of nonprofit capacity in relation to levels of community
JANUARY • 2019
need. While users can access Nonprofit Works directly at ccss.jhu.edu/nonprofit-
works to create tables and figures suitable for use in their own reports, full analytical
reports can also be commissioned from the Center. For information on how to arrange
for analytical reports on the nonprofit sector in your region or field drawing on Nonprofit
Works data, please contact chelsea.newhouse@jhu.edu.
ccss.jhu.edu @jhuccss facebook.com/jhuccss ccss.jhu.edu
Johns Hopkins Krieger School of Arts and Sciences | Mergenthaler Hall, 3rd Floor | 3400 N. Charles St. | Baltimore, MD 21018You can also read