Sentiment and Knowledge Based Algorithmic Trading with Deep Reinforcement Learning
←
→
Page content transcription
If your browser does not render page correctly, please read the page content below
Sentiment and Knowledge Based Algorithmic
                                              Trading with Deep Reinforcement Learning

                                                  Abhishek Nan?1 , Anandh Perumal*1,2 , and Osmar R. Zaiane1,2
                                                                      1
                                                                       University of Alberta, Canada
                                                                  2
                                                                    Alberta Machine Intelligence Institute
                                                                  {anan1,anandhpe,zaiane}@ualberta.ca
arXiv:2001.09403v1 [cs.AI] 26 Jan 2020

                                                 Abstract. Algorithmic trading, due to its inherent nature, is a difficult
                                                 problem to tackle; there are too many variables involved in the real
                                                 world which make it almost impossible to have reliable algorithms for
                                                 automated stock trading. The lack of reliable labelled data that considers
                                                 physical and physiological factors that dictate the ups and downs of the
                                                 market, has hindered the supervised learning attempts for dependable
                                                 predictions. To learn a good policy for trading, we formulate an approach
                                                 using reinforcement learning which uses traditional time series stock price
                                                 data and combines it with news headline sentiments, while leveraging
                                                 knowledge graphs for exploiting news about implicit relationships.

                                                 Keywords: Reinforcement Learning · Trading · Stock Price Prediction
                                                 · Sentiment Analysis · Knowledge Graph.

                                         1     Introduction

                                         Machine learning is mainly about building predictive models from data. When
                                         the data are time series, models can also forecast sequences or outcomes. Pre-
                                         dicting how the stock market will perform is an application where people have
                                         naturally attempted machine learning but it turned out to be very difficult be-
                                         cause involved in the prediction are many factors, some rational and some ap-
                                         pearing irrational. Machine learning has been used in the financial market since
                                         the 1980s [3], trying to predict future returns of financial assets using supervised
                                         learning such as artificial neural networks [2], support vector machines [13] or
                                         even decision trees [19]; but so far, there has been only limited success. There
                                         are multiple causes for this. For instance, in supervised machine learning, we
                                         usually have labelled datasets with balanced class distributions. When it comes
                                         to the stock market, there is no such labelled data for when someone should have
                                         bought/sold their holdings. This leads credence to the problem being fit for the
                                         reinforcement learning framework [24], a behavioral-based learning paradigm
                                         relying on trial and error and supplemented with a reward mechanism. Rein-
                                         forcement learning has the ability to generate this missing labelling once we
                                         define a proper reward signal. But there are still other issues in this context
                                         ?
                                             Equal Contribution
2 A. Nan et al.
which are specific to stock markets. They are prone to very frequent changes
and often these changes cannot be inferred from the historical trend alone. They
are affected by real world factors such as political, social and even environmen-
tal factors. For instance, an earthquake destroying a data-center could result in
stock prices dropping for a company; a new legislation about trade can posi-
tively impact the value of a company. Noise to signal ratio is very high in such
conditions and it becomes difficult to learn anything meaningful under such cir-
cumstances. Such environments can be modelled as Partially Observable Markov
Decision Processes (POMDPs) [29], where the agent only has limited visibility
of all environmental conditions. A POMDP models an agent decision process in
which it is assumed that the system dynamics are determined by an a discrete
time stochastic control process, but the agent cannot directly observe the under-
lying state [12]. Our contribution is the use of sentiment analysis done on news
related to a traded company and its services in conjunction with a reinforcement
algorithm to learn an appropriate policy to trade stocks of the given company.
To find the relevant news title on-which to apply sentiment analysis, we use a
traversal of a knowledge graph.
After highlighting the related work in Section 2, we present our approach
in Section 3 combining headlines from news and their sentiment after finding
their relation with the relevant stock hinging on a knowledge graph, and finally
learning a good policy for buying and selling using Reinforcement Learning.
We present an empirical evaluation using the stocks of Microsoft between 2014
and 2018 in Section 4. Section 5 highlights the analysis of the observed results.
Finally, we conclude and present perspective on future work in Section 6.
2 Related Work
There have been many approaches in the past which try to model traditional
time series approaches for stock price prediction [21,26,11]. The main idea in
these approaches is to predict the stock price at the next time step given the
past trend. This prediction is then fed to a classifier which tries to predict the
final buy/sell/hold action. Most modern deep learning techniques try to use
some form of recurrent networks to model the sequential trend in the data.
[4] used LSTMs with great success to make predictions in the Chinese stock
market. Approaches integrating some form of event data has been explored as
well to some extent. For instance, [15] used manually extracted features from
news headlines to integrate event information and spliced them with several
other economic indicators according to prior knowledge and combined them
together as the input to neural networks.
An alternative approach is to use Reinforcement Learning. [6] shows in a
comprehensive survey on the use of RL in financial markets that there are many
attempted approaches but the problem is far from being solved [6]. From a
reinforcement learning (RL) perspective, [25] proposed an Adaptive Network
Fuzzy Inference System (ANFIS) supplemented by the use of RL as a non-
arbitrage algorithmic trading system. [5] use a deep learning component whichTrading with Deep Reinforcement Learning 3
automatically senses the changing market dynamics for feature learning and
these features are used as input to an RL module which learns to make trading
decisions. [9] explored the use of actor-critic methods for stock trading and serves
as one of the primary motivations behind our research.
Furthermore, public opinion can often provide valuable indication as to how
a company might be posed to perform in the market. Attempts have been made
previously to directly classify each comment on a stock trading forum as a indi-
cator of a buy/sell/hold decision [23]. Rather than use text data in its entirety as
a variable to make decisions, the general sentiment of the text can be extracted
as a score [20] and combined with other related data.
Our approach in a way tries to take the best of these methods and extend
them into a single dynamic system paired with knowledge graphs. We extract
sentiments from event information and use knowledge graphs to detect implicit
relationships between event information and a given traded company. We then
combine this information with the time series stock data, and allow our agent
to learn an optimal policy using deep reinforcement learning. We also take ad-
vantage of more recent deep RL techniques such as the DQN introduced by
[18]. This approach of combining knowledge graph driven sentiment data with
deep RL is our novel proposal and has not been explored in any literature we
surveyed.
3 Proposed Approach
Our approach combines concepts from a few different domains; hence, we give a
short overview of each of them and connect how they are used in our project.
Q-learning Q-learning is a model free reinforcement learning algorithm. Given
an environment, the agent tries to learn a policy which maximises the total
reward it gets from the environment at the end of an episode (a sequence of
interactions). For instance, in our problem setting, an episode during training
would be the sequence of interactions the agent makes with the stock market
starting from January 1, 2014 and ending on December 31, 2017. The agent
would try to learn a behaviour which maximises the value of its portfolio at the
end date.
The intuition behind Q-learning is that the agent tries to learn the utility
of being in a certain state and taking a particular action in that state and then
following the behavioural policy learnt so far till the end of the episode (called
the action value of that state). So, Q-learning tries to learn the action value
of every state and action. It does this by exploring and exploiting at the same
time. For instance, a trading agent starts on Day 1 and it has two options: Buy
and Sell. It takes the Buy option (say arbitrarily) the first time it experiences
Day 1 and receives a reward of 10 units. For optimal performance, the agent
will usually follow the best possible option available to it. Usually; because if it
always followed the best option that it thinks is available to it, it won’t learn
the value of taking the other options available to it in that state. For instance,4 A. Nan et al.
in the above example, Sell could have led to a reward of 20, but it would have
never known this if it always took the Buy option after it first experienced Day
1 with a Buy action. This dilemma is known as the exploration and exploitation
trade-off. A naive, yet effective way of solving this is to always take the ”greedy”
option, except also act randomly a small percentage of the time, say with a
probability of 0.1. This is known as the -greedy approach with = 0.1. This
finally brings us to the Q-learning equation, which updates the action values of
each state and action pair.
Q(St , at ) ← Q(St , at )+α[Rt+1 + γ max Q(St+1 , a) − Q(St , at )]
a
Function approximation A shortcoming of the above mentioned Q-learning
methodology is the obvious fact that it relies on the idea of a distinct state. What
this means is that the Q-learning update can only be applied to an environment
where each state(st ) can be distinctly labelled. This would mean we would have
to maintain a huge table of every possible state and action combination that
can be encountered and their action values. This does not generalize very well
and is not tractable for real world problems. For instance, given today’s state of
the world to a stock trading agent, it might make some decision and learn from
it, but it’s very unlikely that the exact same conditions will ever be presented
to it again. The solution to this is to use a function approximator, which given
the current environmental observation and the chosen action maps them to an
action value. The parameters of the approximator can then be updated similar to
supervised learning once we have observed the actual reward. In our experiments,
we use an artificial neural network for function approximation.
For large state spaces since optimizing artificial neural networks via just
back-propagation becomes unstable so we adapt the modifications to a Deep
Q-Network (DQN) as presented by [18]. These modifications include gradient
clipping, experience replay and using a Q-network which periodically updates
an independent target network.
3.1 Sentiment analysis
Sentiment analysis is an automated process to annotate text predicted to be
expressing a positive or negative opinion. Also known as opinion mining, sen-
timent analysis categorizes text into typically two classes positive vs. negative,
and often a third class: neutral. Discovering the polarity of a text is often used to
analyze product or service reviews, like restaurants, movies, electronics, etc. but
also other written text like blog posts, memos, etc. There are two main types of
sentiment analysis approaches, namely lexicon-based using a dictionary of words
with their polarities; and machine learning based which build a predictive model
using a labelled train dataset [28].
Each sentence/sequence of sentences in a language in general, has a positive
or a negative connotation associated with it; sometimes neutral. A news headline,
the full news article itself, or even this paper, typically express an opinion to
some degree. Natural Language Processing techniques are used to extract suchTrading with Deep Reinforcement Learning 5
connotations in an automated manner [8]. Once extracted, it can serve as a
vital data point for applications such as in marketing to understand customers’
opinion, as mentioned above. In our case we would like to use sentiment analysis
to assess whether a news headline is favorable or admonitory to the company
for which we are trading stocks.
Consequently, in our case, each news headline is posited to be either positive,
negative or neutral from the perspective of the company we are considering
trading stocks for. Positive sentiments can predict a general upturn in stock
prices for a company, and similarly negative sentiments can possibly indicate a
downturn [7,22].
3.2 Knowledge Graphs
Lexical thesauri and ontologies are databases of terms interconnected with se-
mantic relationships. They are often represented in a graph with entities and
relationships. A knowledge base or a knowledge graph, are more complex graphs
where the entities are not simple terms but a composite of knowledge.
The Google Knowledge Graph was specifically created to enhance the re-
sults of a Google search. Traditionally a Web search used to be limited to string
matching keywords in an entire corpora to a given query. However, since enti-
ties in the real world are linked to each other and this link can be expressed in
different ways, simple string matching is not adequate for an intelligent search.
This interconnection is characterized in the knowledge graph which represents a
graph-like data structure where each node is an entity and the edges between the
nodes indicate the relationships between them. For instance, a naive search for
“Bill Gates” using simple string matching would not bring up Microsoft. How-
ever, with a knowledge graph, since “Bill Gates”, being the principal founder of
Microsoft, he is a very relevant node close to the ”Microsoft” node in a knowledge
graph and hence, “Microsoft” would be brought up as a relevant search result.
This way entities which are related to a company, but not explicitly mentioned in
the news headline, can be identified as potential factors impacting stock prices.
In our case, headlines covering Excel, Windows, Azure, Steve Ballmer, or Satya
Nadella, or other entities connected to Microsoft in the knowledge graph, would
be passed to the sentiment analysis and their polarity exploited in the learning
algorithm.
4 Empirical Evaluation
4.1 Data
Stock data: We used stock data from the Yahoo Finance API3 dated from
January 1, 2014 to December 31, 2017 for our training environment. The data for
the test period is from January 1, 2018 to December 31, 2018. In our experiment,
3
https://finance.yahoo.com/quote/MSFT/history/6 A. Nan et al.
for both training and testing cases we used Microsoft Corporation’s (MSFT)
stock data - i.e. we trained our agent to trade Microsoft stocks.
Sentiment Data: For news information, we scraped historical news head-
lines from the Reuters Twitter account4 using a python scraper[27]. The time
period of the news headlines corresponds exactly to the stock data, i.e. training
data from January 1, 2014 to December 31, 2017 and testing data from January
1, 2018 to December 31, 2018.
Next, for each news headline we remove stopwords and tokenize it. Each token
is then checked for the existence of an Organization node relationship with the
specific company of interest (Microsoft Corporation in our case) in a knowledge
graph within a pre-specified distance. In our experiment we chose a distance
measure of 5. Selecting a walk-length longer than this resulted in too much noise,
and any shorter meant there would be very few implicit relationships found.
This value was tuned empirically on the basis of some manual experiments we
performed. For our experiments, we used the Google Knowledge Graph5 . Once
we find that any token in a headline is within this pre-specified distance of our
organization (Microsoft), by extension we deem the entire headline as relevant
to the organization in consideration. This is a naive approach, but allows us to
make better use of news data that might not be directly linked to Microsoft, but
might have indirect consequences. For instance, a news headline talking about
Azure, which is Microsoft’s cloud service offering, would not get identified as
a news affecting MSFT stock prices, but by using a knowledge graph, we can
uncover this implicit relationship.
Once we have headlines relevant to Microsoft, we use an ensemble sentiment
analyser for sentiment classification. Since some headlines proved to be tricky
to classify correctly by any single available sentiment classifier, we tried this
approach of using an ensemble comprising of IBM Watson [10], TextBlob [1]
and NLTK [16]. We classify each news headline as positive and negative news
and use the classification from the classifiers above, choosing whichever one has
the highest confidence. If there are multiple headlines on the same day, we use the
majority of the sentiment score from all headlines for that day leading to a net
+1 if majority is positive sentiment and -1 if majority is negative sentiment. An
example positive headline dated 2016-07-14 can read: “Microsoft wins landmark
appeal over seizure of foreign emails.”, while an example of a headline expressing
a negative sentiment dated 2015-12-31 is “Former employees say Microsoft didn’t
tell victims about hacking.”
4.2 MDP Formulation
Episode: A single episode consists of the agent interacting with the stock trading
environment once per day starting from Januray 1, 2014 and lasts till Decem-
ber 31, 2017 (for the training period). The agent explores different policies and
improves its existing policy as more and more episodes elapse.
4
https://twitter.com/reuters
5
https://developers.google.com/knowledge-graph/Trading with Deep Reinforcement Learning 7
State: Our current environment describes each state using 6 variables:
1. Current amount of money the agent has;
2. Current number of stocks the agent has;
3. Opening stock price on today’s date;
4. Difference between today’s opening price and average opening price of last
5 days’ window;
5. Difference between today’s opening price and average opening price of last
50 days’ window;
6. Average sentiment towards the company for today’s date.
While (1), (2), (3) are values necessary for maintaining the state of the agent, (4)
and (5) were added to give it some indication of the trend in the stock prices. (4)
provides the trend over a short time window (5 days), while (5) provides the trend
information over a longer time window (50 days). (6) provides the sentiment
information calculated as described in the previous section. In short, relevance
of headlines are assessed with a knowledge graph. The sentiment expressed in
the relevant pieces are used in (6). Figure 1 shows the entire workflow for the
construction of the agent’s state before it goes into the DQN.
Action space: The agent, our stock trading bot, interacts with this envi-
ronment on a per day basis. It has the option to take three actions: (1) Buy a
stock; (2) Sell a stock; and (3) Do nothing/Hold.
Rewards: The intuition behind rewards is to provide a feedback signal to
the agent to allow it to learn which actions are good/bad based on when they
were taken. So, in our case, a net increase in portfolio at the end of the trading
period should lead to a positive reward, while a net loss would lead to a negative
reward. So, our initial attempts focused on this reward scheme where the agent’s
reward was the net profit/loss after 3 years (2014-2017). But, this reward signal
proved too sparse to train on, since the agent got just one single reward after 3
years of activity and it is difficult for it to know which action taken when (over
3 years) contributed to the final reward. The agent just learnt to ”Do nothing”,
since as the result of a general increasing trend in the MSFT stock price, it led
to a small net increase in the portfolio and this was a local optima for the agent
which it could not move out of due to the sparse reward signals.
Finally, after plenty of experimentation with the reward scheme, we arrived at
one where it was rewarded for not just making a profit, but also for buying/selling
on a day to day basis. If on any given day, it decided to Buy or Sell, it was given
a reward of +1 for making a profit and -1 for making a loss. It was given a small
negative reward of -0.1 for ”Doing nothing” to discourage it from being passive
for extended periods. A reward of -10 was given if it ran out of money, but still
had stocks. A reward of -100 was given in case it went completely bankrupt with
0 stocks in hand and no money to buy a single stock.
Deep Q-Network (DQN) Architecture: The DQN used two identical
neural networks (Q-network and target network) each with 3 hidden layers for
function approximation. Each hidden layer had a size of 64 units and used ReLU
activation. The input layer had 6 input nodes corresponding to each state feature.8 A. Nan et al.
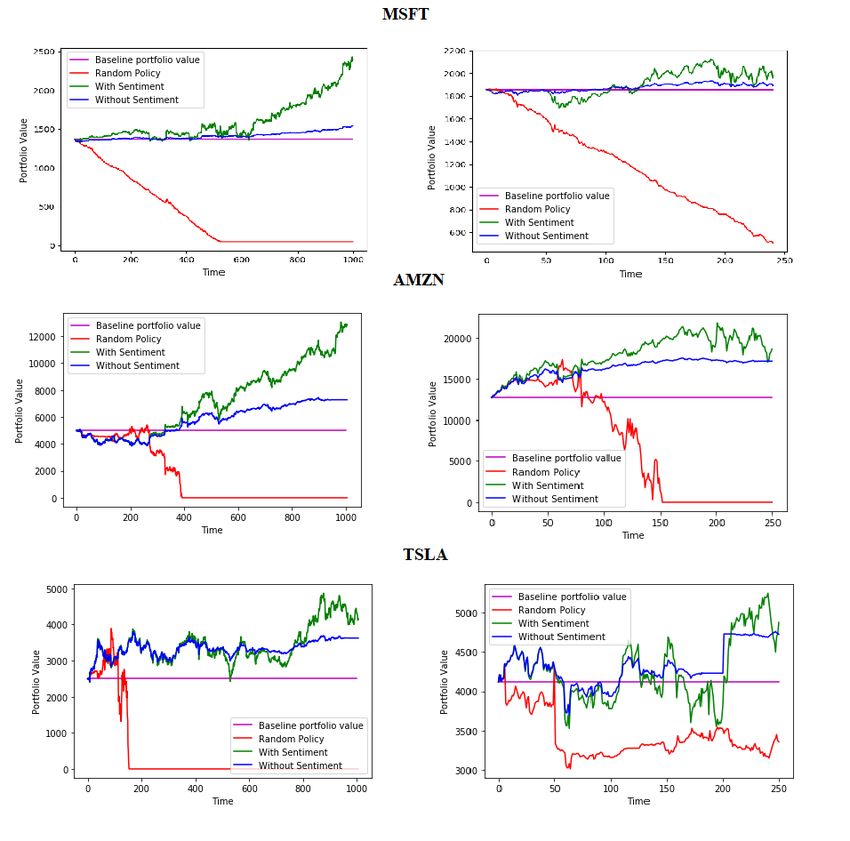
Fig. 1. Construction of agent’s stateTrading with Deep Reinforcement Learning 9 The output layer had 3 nodes corresponding to the action space. The experience replay buffer size was restricted to a size of 1000. Training: The DQN was trained with mini-batch gradient descent using Adam[14] on the Huber loss. During training the agent started off with $1000 USD and 10 MSFT shares on January 1, 2014 and interacted with the environ- ment till December 31, 2017. The agent in the form of a DQN is trained over 2000 epochs. Fig. 2. Performance of different agents for different stocks (Left column: Train data; Right column: Test data)
10      A. Nan et al.

5     Results and Analysis
The primary hypothesis of this work was that providing sentiment information
to the agent on a daily basis would add to its performance ceiling and it would be
able to make more profit via trading. Therefore, we compare both approaches, i.e.
an agent with sentiment data provided and another agent without any sentiment
data provided. We evaluate both on our test data set, which spans from January
1, 2018 to December 31, 2018. If sentiments do add any additional value to the
environment, it should be able to make more profit.

5.1   Training data analysis
Before looking at the performance on the test data, we also analyse the perfor-
mance of both models on the training data as well. Figure 2 shows this compar-
ative analysis. The Baseline Portfolio Value is the starting portfolio value of the
agent (i.e. the net value of 1000$ and 10 stocks on starting day). The Random
Policy is an agent which takes random actions (Buy, Sell, Hold) on each inter-
action. As expected, a random policy agent goes broke soon enough and makes
no profit. The agent with no sentiment input, does learn a policy good enough
to make profit, but nowhere near good enough as compared to the agent which
had sentiment input.
    Figure 2 shows the same trend with the same training done on data about
Microsoft, Amazon and Tesla stocks,. We can distinctly see that the learned
policy using sentiment from news headlines outperforms the policy that only
considers stock data.

5.2   Test data analysis
For Microsoft, during the test period, the stock prices at the beginning start quite
a bit higher (approx. $85 in January 2018) as compared to the training period
start (approx. $40 in January 2014). Despite this, the MSFT agent (Figure 2)
learned a policy good enough to generate profit, both with and without sentiment
data. However, in general, it was not able to generalize to the test data as
well as we saw during training, and its profits dropped. But still, the agent
with sentiment information ends up making more profit than the agent without
sentiment data. Similar trends are present for both the other stocks as well.

5.3   Sharpe ratio
The Sharpe ratio is another measure that is often used in trading as a means of
evaluating the risk adjusted return on investment. It can be used as a metric to
evaluate the performance of different trading strategies. It is calculated as the
expected return of a portfolio minus the risk-free rate of return, divided by the
standard deviation of the portfolio investment. In modern portfolio theory [17],
a Sharpe ratio of 1 is considered decent. About 2 or higher is very good and 3
is considered excellent. Table 1 presents this data for our agents’ policies.
Trading with Deep Reinforcement Learning 11
Table 1. Sharpe Ratios for different approaches
Agent Sharpe Ratio MSFT Sharpe Ratio AMZN Sharpe Ratio TSLA
Random Policy -2.249 -1.894 -2.113
Without Sentiment -1.357 1.487 0.926
With Sentiment 2.432 2.212 1.874
The result for the random policy is as expected. It learns a terrible policy and
its Sharpe ratio is the least among all three approaches. Surprisingly, the agent
without sentiment data learns a pretty poor policy as well (albeit still better than
the random policy), despite making profits. On closer analysis, it turns out that
the MSFT stock had a general upward trend already and due to this reason a not-
so-good policy could also produce profits, despite making sub-optimal decisions
as indicated by the Sharpe ratio. Finally, we come to the agent which learnt a
trading policy along with the sentiment data. Not only did it procure the highest
profits as stated earlier, but also its decision making was very good as evidenced
by its Sharpe ratio of 2.4 for MSFT, 2.2 for AMZN, and close to 2 for TSLA.
6 Discussion and Conclusion
Much of the information about the real environment has been left out in this
effort since we wanted to work from the ground up, looking just at how the
sentiment data adds to the analysis. The daily closing price and the volume of
data being traded for the last day or for the last ”x-day” window (eg. 5-day,
50-day windows) could add further information to the environment as well.
Furthermore, instead of explicitly extracting the last ”x-day” window opening
price, we could use a Recurrent Neural Network for the network to retain on
some historical trend information intrinsically. Initial experiments with an RNN
proved difficult to optimize for the network, possibly due to noise in the data
as well as probably not having the right hyper-parameters. This version of the
network with RNNs took particularly long to train and was difficult to analyse
because there was no way to extract what was happening in the hidden state
of the network, so we took an alternative approach of explicitly providing it the
last 5 and 50 day average opening price.
Also, our stock trading bot was limited to buying/selling a single stock per
day, which very likely limits the amount of profit it could make. Making the
agents action space 2-dimensional where the second dimension specifies the num-
ber of stocks bought/sold should be an easy way to remedy this. We tried an
initial attempt at giving it the ability to trade with 1 stock or 5 stock per day,
but the state space became much larger and coming up with a reward scheme
that worked for this problem as well proved to be quite challenging.
In the real world, trading takes place at much higher frequencies than at an
intra-day frequency; extending this to a much finer granular level with data on12 A. Nan et al.
a second-by-second or minute-by-minute basis should be straightforward with
our current framework. Also our work focuses on using stock data of a single
company, but it can easily be extended to use stock data from multiple entities.
Also, in the knowledge graph we kept the relationship distance threshold
quite limited so as to limit the noise added to the data in terms of news headlines.
Provided with a knowledge graph which has weighted nodes, which tell if there
is a positive or negative relationship between the entity in question and the
company stocks are being traded for, we can potentially exploit much longer
distance relationships and in a much more accurate manner.
We present an approach of extracting implicit relationships between entities
from news headlines via knowledge graphs and exploiting sentiment analysis,
positive or negative, on these related headlines, and then using this information,
train a reinforcement learning agent. The trained reinforcement learning agent
can perform better in terms of profits incurred as compared to an agent which
does not have this additional information on headline sentiments. The whole
pipeline as such is a novel approach and the empirical study demonstrates its
validity.
References
1. Textblob. https://github.com/sloria/textblob
2. Atsalakis, G.S., Valavanis, K.P.: Surveying stock market forecasting techniques
part ii: Soft computing methods. Expert Systems with Applications 36(3), 5932–
5941 (2009)
3. Braun, H., Chandler, J.S.: Predicting stock market behavior through rule induc-
tion: An application of the learning-from-example approach*. Decision Sciences
18(3), 415–429 (1987)
4. Chen, K., Zhou, Y., Dai, F.: A lstm-based method for stock returns prediction: A
case study of china stock market. In: 2015 IEEE International Conference on Big
Data (Big Data). pp. 2823–2824 (2015)
5. Deng, Y., Bao, F., Kong, Y., Ren, Z., Dai, Q.: Deep direct reinforcement learn-
ing for financial signal representation and trading. IEEE Transactions on Neural
Networks and Learning Systems 28(3), 653–664 (2017)
6. Fischer, T.G.: Reinforcement learning in financial markets- a survey (2018), work-
ing paper, FAU Discussion Papers in Economics, No. 12/2018, Institute for Eco-
nomics, Erlangen
7. Fisher, K.L., Statman, M.: Investor sentiment and stock returns. Financial Ana-
lysts Journal 56(2), 16–23 (2000)
8. Godbole, N., Srinivasaiah, M., Skiena, S.: Large-scale sentiment analysis for news
and blogs. Icwsm 7(21), 219–222 (2007)
9. Grek, T.: A blundering guide to making a deep actor-critic bot for stock trading.
GitHub repository (2018)
10. IBM: Ibm watson. https://www.ibm.com/watson/services/tone-analyzer/
11. Jain, S., Kain, M.: rediction for stock marketing using machine learning. Interna-
tional Journal on Recent and Innovation Trends in Computing and Communication
6(4), 131–135 (2018)
12. Kaelbling, L., Littman, M., Cassandra, A.: Planning and acting in partially ob-
servable stochastic domains. Artificial Intelligence 101(12), 99–134 (1998)Trading with Deep Reinforcement Learning 13
13. Karazmodeh, M., Nasiri, S., Hashemi, S.M.: Stock price forecasting using support
vector machines and improved particle swarm optimization. Journal of Automation
and Control Engineering 1(2) (2013)
14. Kingma, D.P., Ba, J.: Adam: A method for stochastic optimization. arXiv preprint
arXiv:1412.6980 (2014)
15. Kohara, K., Ishikawa, T., Fukuhara, Y., Nakamura, Y.: Stock price prediction using
prior knowledge and neural networks. Intelligent Systems in Accounting, Finance
and Management 6(1), 11–22 (1997)
16. Loper, E., Bird, S.: NLTK: The Natural Language Toolkit (2002), http://
citeseerx.ist.psu.edu/viewdoc/summary?doi=10.1.1.4.585
17. Maverick, J.: Investopedia. https://www.investopedia.com/ask/answers/
010815/what-good-sharpe-ratio.asp
18. Mnih, V., Kavukcuoglu, K., Silver, D., Rusu, A.A., Veness, J., Bellemare, M.G.,
Graves, A., Riedmiller, M., Fidjeland, A.K., Ostrovski, G., et al.: Human-level
control through deep reinforcement learning. Nature 518(7540), 529 (2015)
19. Panigrahi, S., Mantri, J.: A text based decision tree model for stock market fore-
casting. In: 2015 International Conference on Green Computing and Internet of
Things. IEEE (2015)
20. Sabherwal, S., Sarkar, S.K., Zhang, Y.: Do internet stock message boards influence
trading? evidence from heavily discussed stocks with no fundamental news. Journal
of Business Finance & Accounting 38(910), 1209–1237 (2011)
21. Sharma, M.: Survey on stock market prediction and performance analysis. Inter-
national Journal of Advanced Research in Computer Engineering & Technology
3(1), 131–135 (2014)
22. Si, J., Mukherjee, A., Liu, B., Li, Q., Li, H., Deng, X.: Exploiting topic based
twitter sentiment for stock prediction. In: Proceedings of the 51st Annual Meeting
of the Association for Computational Linguistics (Volume 2: Short Papers). vol. 2,
pp. 24–29 (2013)
23. Sprenger, T.O., Tumasjan, A., Sandner, P.G., Welpe, I.M.: Tweets and trades: The
information content of stock microblogs. European Financial Management 20(5),
926–957 (2014)
24. Sutton, R.S., Barto, A.G., et al.: Introduction to reinforcement learning, vol. 135.
MIT press Cambridge (1998)
25. Tan, Z., Quek, C., Cheng, P.Y.: Stock trading with cycles: A financial application
of anfis and reinforcement learning. Expert Systems with Applications 38(5), 4741
– 4755 (2011)
26. Taran, C., Roy, D., Srinivasan, N.: Stock price prediction - a novel survey. Inter-
national Journal of Applied Engineering Research 10(4), 11375–11383 (2015)
27. Taspinar, A.: Twitterscraper. https://github.com/taspinar/twitterscraper
28. Yaddolahi, A., Shahraki, A.G., Zaiane, O.R.: Current state of text sentiment anal-
ysis from opinion to emotion mining. ACM Computing Surveys 50(2), 25:1–25:33
(2017)
29. ström, K.: Optimal control of markov processes with incomplete state information.
Journal of Mathematical Analysis and Applications 10(1), 174 – 205 (1965)You can also read