(AQI) IOT Based Unmanned Aerial Vehicle For Mobile Monitoring And Management Of Municipal Solid Waste (MSW) Landfill Sites And Air Quality Index
←
→
Page content transcription
If your browser does not render page correctly, please read the page content below
INTERNATIONAL JOURNAL OF SCIENTIFIC & TECHNOLOGY RESEARCH VOLUME 8, ISSUE 11, NOVEMBER 2019 ISSN 2277-8616
IOT Based Unmanned Aerial Vehicle For Mobile
Monitoring And Management Of Municipal Solid
Waste (MSW) Landfill Sites And Air Quality Index
(AQI)
S.Kishore, Nithin Rogan,Aman pandey S,Nagasudhan N, Vikram Raj K
Abstract: With ever increasing population limits, Solid and Air pollution levels in the major cities of India are at appalling limits.
One major obstacle to effective waste management is the lack of monitoring sources at the site of pollution. This is primarily due
to inaccessibility of the site or the cost involved in monitoring. Due to ineffective monitoring, Municipal solid waste landfill sites
(MSWLF) expand rapidly and encroach upon fresh water sources. These landfill sites also pose other hazards such as a fire
risks from methane emissions which may subsequently increase particulate matter (PM 2.5) levels in the air. Furthermore, due
to the significant growth of industries in and around the major urban centers of India, monitoring the Air quality index (AQI) has
become imperative. The AQI readings in most of the major cities in India are biased due to the short ranges of Monitoring
stations. With periodic and frequent monitoring of the MSWLF sites and AQI limits, Authorities can undertake more decisive
actions to combat pollution. This article reviews the perspective of using an IOT based drone connected to the cloud for
effectively monitoring the MSWLF sites and AQI levels very frequently in a short span of time. The suggested drone would have
sensors categorized into two sets of components. The components for monitoring the MSWLF site would consist of a light
detection and ranging (LIDAR) sensor along with a thermal imaging camera while the AQI monitoring component will include a
PM 2.5 sensor along with a gas detection chamber. These two components would be connected to a cloud server and the
obtained information would be updated to a crowd sourced database. The obtained data from the landfill monitoring component
will be analyzed using suitable machine learning algorithms to prevent events like fire outbreaks from methane emissions,
slippage of wastage slopes, expansion of the site from defined limits etc.
Index Terms: Drones, IoT, MSWLF, AQI, Machine Learning, Predictive Maintenance.
—————————— ——————————
1. INTRODUCTION sites in Kodungaiyur, located in northern part of the city and
Most of the Municipal solid waste landfill sites in India are Perungudi, located in the southern part of the city. The landfill
expired and exhausted. These Landfill sites are neither sites in Chennai are being managed by the Greater Chennai
scientifically constructed nor managed. They are located near Corporation. the mode of disposal of waste is 100% by
residential areas and waterbodies. For example, The Landfill landfills is used in Chennai [1]. Chennai is the first city in India
Sites in Perungudi, Chennai, have destroyed the marshland to involve an International private agency for MSW Collection
ecosystem over the years as it expanded to meet the city’s services [3].
demand. Together with expanding landfill sites, Due to rapid 1. Perungudi Landfill
industrialization and increasing traffic levels, Air pollution has This site is in the southern part of Chennai and has an area
become a serious problem across all the major cities in India. of 228 acres of land. Around 2400 to 2600 MT of solid waste
Landfill sites and poor air quality pose several hazards to generated within the city are disposed here. Residential areas
general living conditions. Thus, it has become imperative for are within 0.5 Km from the Landfill Site. the emission flux in
authorities to Manage and control pollution sources. The first Perungudi Landfill Site ranged from 0.9 to 433 mg CH4 m-2 h-1,
step in Management of these pollution sources is effective 2.7 to 1200 µg N20 m-2 h-1 and 12.3 to 964.4 mg CO2 m-2 h-1 [1]
monitoring in a short span of time. Conventional monitoring the average values of methane emission is found to be highest
methods employed to survey landfill sites and Monitor AQI are at Perungudi Landfill site amongst all the other landfill sites in
ineffective, biased and Time consuming. With recent Chennai[2].
Advancements in drone technology and IoT based cloud Figure 2.1 shows the gradual expansion of Perungudi landfill
servers, monitoring of pollution sources can be done more site from the year 1995 to 2015. The area in the grey
efficiently to a substantial degree than Existing methods. represents the marshland surrounding the landfill. The area in
Furthermore, the obtained data can be processed using the yellow represents the landfill site. We can see the increase
suitable Machine learning algorithms for predictive in landfill size and reduction in marshlands.
maintenance.
2. Kodungaiyur Landfill
2 REVIEW OF LANDFILL SITES The Kodungaiyur Landfill site is located in the northern part of
A. Chennai Landfills Chennai and has an area of roughly 270 acres. Around 2600
According to the Solid Waste Department of Chennai to 2800 MT of solid waste generated within the city are
Corporation, Per capita generation of solid waste per day is disposed here. Residential areas are within 1 Km from the
650 grams and about 5400 MT of garbage is generated from Landfill Site. the emission flux in Kodungaiyur Landfill site
the city. The garbage is collected and dumped into two landfill ranged from 1.0 to 23.5 mg CH4 m-2 h-1, 6 to 460 µg N20 m-2 h-1
3671
IJSTR©2019
www.ijstr.org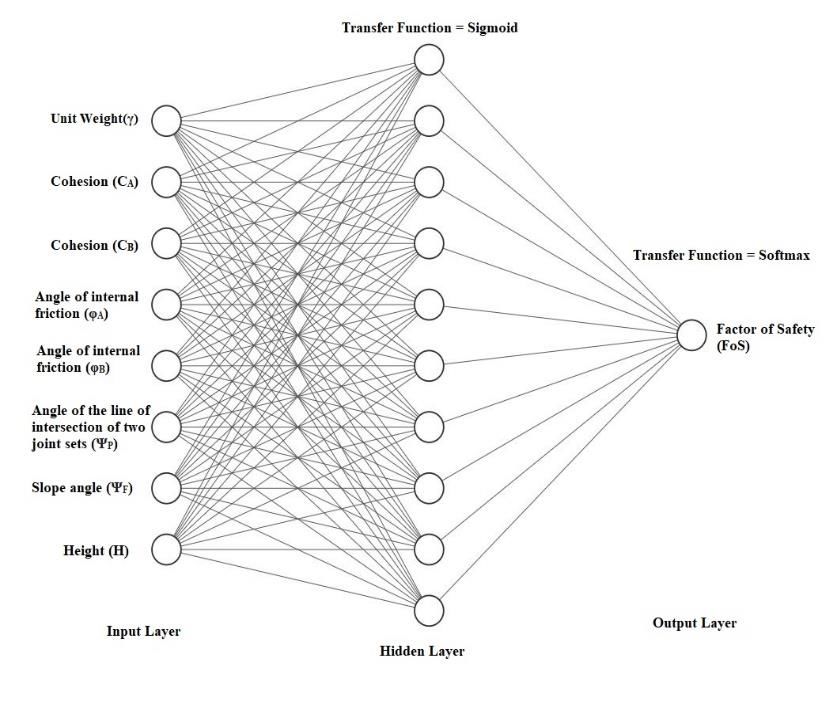
INTERNATIONAL JOURNAL OF SCIENTIFIC & TECHNOLOGY RESEARCH VOLUME 8, ISSUE 11, NOVEMBER 2019                                ISSN 2277-8616

and 39 to 906 mg CO2 m-2 h-1 [1].
    B. Delhi Landfills                                                   3 AQI MONITORING IN INDIA
                                                                         An Air Quality Index (AQI) is used by government agencies to
                                                                         denote Current and forecasted air pollution levels. Increased
                                                                         AQI signify risk to the public. In India, the national Air Quality
                                                                         Index was launched in New Delhi on September 17, 2014. The
                                                                         Central Pollution Control Board and State Pollution Control
                                                                         Boards is operating more than 342 monitoring stations under
                                                                         National Air Monitoring Program (NAMP) in over 240 cities
    1. Ghazipur Landfill Site                                            across India. Most of these Stations are stationary and are
                                                                         designed to Monitor eight pollutants (PM10, PM2.5, NO2, SO2,
   Fig. 2.1 Expansion of Perungudi landfill site (1995-2015)             CO, O3, NH3, and Pb). According to a 2017 Greenpeace
                                                                         Report, The Number of operational AQI monitoring stations in
Ghazipur is the oldest landfill site in Delhi which was                  India is less when compared to other major developing
established in 1984. The year of saturation of the landfill site is      countries like China. Furthermore, the AQI data collected by
2002, but it is still in use. The height of Ghazipur landfill site is    most monitoring stations tend to be biased and continue to be
about 65m. The waste dumped into the landfill is 1800 –2000              plagued by several discrepancies as most of these stations
MT. The landfill is spread over 70 acres. The Ghazipur landfill          tend to be located far away from the industrial zones and
site is managed by East Delhi Municipal Corporation (EDMC).              Urban areas. Thus, the AQI data across some tier 1 cities and
Residential areas are within 0.2 Km from the Landfill sites and          most of the tier 2 and tier 3 cities are full of discrepancies due
around 3 million people live within 10 km radius of the landfill         to improper positioning and inadequate covered Range of the
site. In 2017, part of the landfill collapsed killing 2 people and       monitoring stations.
injuring 5 more. A waste -to-energy plant has been set up by IL
& FS Environmental company at the Ghazipur dumpsite,                     4 GROUND SURVEYING VS AERIAL
which processes more than 2000 tons per day from Delhi's                   SURVEYING
solid waste. Set up to initially process 1300 tons per day               Topological Survey method is one of the most commonly used
(TPD) of municipal solid waste and generate 12 MW of green               surveying methods for determining the landfill capacity.
power, the plant is built with a capacity to process 2000 TPD of         Topographical mapping is the process of graphically
waste.                                                                   representing natural and man-made features for a given
     C. Mumbai Landfills                                                 locality and for the determination of the configuration of the
Mumbai is the highest solid waste generating megacity in                 terrain on a map. Topographical maps can be developed using
India, followed by Delhi, Kolkata, Chennai. Mumbai generates             ground or aerial surveys. The type of survey is based on
about 7000 MT of garbage daily, which are being dumped into              landfill parameters such as landfill size, total costs, availability
Deonar and Kanjurmarg landfill sites. The landfill sites in              of a survey crew. Airspace is an important parameter in
Mumbai are being managed by the Brihanmumbai Municipal                   maintaining the landfill which needs monitoring.
Corporation (BMC). the mode of disposal of waste is 91% by
landfills and 9% by composting in Mumbai [1].                                A. Ground Survey:
     1. Deonar Landfill Site                                             A ground survey is conducted using a ground crew to develop
   Deonar landfill site is India’s oldest and largest landfill site in   a topographic map representing the existing terrain. Ground
terms of area being established in 1927. The dumping ground              surveys are usable in essentially all situations where
extends over 132 hectares and receives over 5500 MT of solid             topographic or boundary data is needed for landfill operations.
waste and 25 Tons of Bio – Medical Waste daily. In August                Ground surveys are most likely to be cost-effective for smaller
2008, BMC decided to close section of a landfill site and used           landfills, usually about 10 acres or less.
it to generate 7 to 8 MW of electrical power from methane
extraction. In January 2016, a major fire broke out in the                    B. Aerial (Photogrammetric) Survey:
landfill site due to undetected methane emissions. Frequent              Photogrammetry is defined as the branch of science which
fires at the dump site has caused conditions harsh for                   deals with making measurements and preparing maps from
residents near the landfill site Infant Mortality rate in the            aerial photographs. The horizontal distances, elevation,
nearby areas is 60 – 80 per 1000 live births, which is almost            profiles and cross – sections can be measured from aerial
double that of the average (35.2) for Mumbai City.                       imagery from UAVs. Aerial imagery is usually done for larger
                                                                         landfills more than 10 acres. Aerial imagery had higher
                  Table 2.1 Summary of landfill sites                    operational cost before the usage of UAVs such as drones. By
Landfill site &     Planned     Actual        Area        Current        using drones, the cost of surveying can be brought down to
   year of          Capacity   Capacity     occupied       area
                                                                         less than that of ground surveying.
construction        (MT per    (MT per        when        (acres)
                      day)       day)      constructed
                                             (acres)                         C. Use of UAVs for Monitoring Air pollution
Perungudi          1600        5400       80              220             UAVs affixed with the appropriate gas sensors can be used to
1998                                                                     detect the presence of harmful pollutants. The monitoring
Kodungaiyur        900         2800       5               40             process of AQI through an UAV involves the detection of
1992
                                                                         presence of gases and PM levels for a short period of time
 Ghazipur          2000        9500       13              55
1984                                                                     rather than continuous monitoring. However, it can be used to
 Deonar            2500        5500       15              48             monitor the required parameters for inaccessible areas or
1995                                                                     extend the range of Monitoring stations [4].
                                                                                                                                        3672
                                                                 IJSTR©2019
                                                                 www.ijstr.org
INTERNATIONAL JOURNAL OF SCIENTIFIC & TECHNOLOGY RESEARCH VOLUME 8, ISSUE 11, NOVEMBER 2019                       ISSN 2277-8616

                                                                   consists of the AQI of a given area based on the input
5 INTERNET OF THINGS (IOT) ARCHITECTURE                            parameters.
Sensory Data From the drone is processed and sent to a
cloud server via its own modified IoT Architecture. The            7 MACHINE LEARNING PIPELINE
Sensory Data from the drone is passed through five layers of
IoT architecture before being finally sent to the end Network.

                 Figure 5.1 IoT Architecture

Perception Layer                                                           Figure 7.1 Machine learning Model Process
This is the initial layer consisting of sensors to collect data
from its environment. Data is Acquired from both the Landfill      Data Collection
and AQI monitoring Subsystems.                                     The datasets for the training phase of ML model is collected.
                                                                   Data collection is one of the hardest parts of the ML pipeline
Data Acquisition Layer                                             as not many sources are already available. The data is taken
The collected Data is converted from its analog form into its      from the data.gov website for which the AQI has been found.
digital form for further processing. Suitable microprocessors      The ML models mentioned in this paper is of supervised
along with microcontrollers are present.                           learning.

IoT Gateway Layer                                                  Data Preprocessing
This is the primary Gateway that serves to route data to a         Missing data is a problem when comes to data preprocessing.
WLAN/LTE for Further Data processing.                              The datasets are first analyzed, and the missing data are
                                                                   identified. The input parameters are selected (feature
Processing Layer                                                   extraction). The input parameters which has the highest
Edge analytics allows the data to be preprocessed before           impact on the output are identified in this process (feature
being sent to the cloud. Further analysis of data can be           selection). Feature scaling is then done for normalizing the
performed using cloud analytics.                                   data. Feature extraction, feature selection is done so that the
                                                                   model does not overfit or underfit the data and also to make
Application Layer                                                  sure that there is no bias in the ML model. Dimensionality
The Application Layer delivers the application specific service    reduction is done further if required by Principal Component
to the End User.                                                   Analysis (PCA).

6 ARTIFICIAL NEURAL NETWORKS(ANN)                                  Data Sampling & ML Algorithm training
Artificial Neural Networks are computational models based on       The dataset is further split into training and testing data. The
structure and function of biological Neural Networks. ANNs is      training data is used for training the ML model and the testing
useful in modeling the nonlinear relationship in the data, the     data is used to evaluate the model’s accuracy in prediction.
complex relationships between inputs and outputs can be            ML algorithm is then trained using the training data.
modeled with higher precision using ANN. Suitable Artificial
Neural Network can be used for finding the AQI. The                Hyper Parameter Optimization
Hyperparameters for the ANN are found using Genetic                After the training phase of ML algorithm on training data, the
algorithm. The ANN is deployed in the cloud platform for           algorithm’s performance is tuned by optimizing the hyper
automating the task. The output layer of the neural network        parameters such as the number of hidden layers in the neural
                                                                                                                              3673
                                                           IJSTR©2019
                                                           www.ijstr.org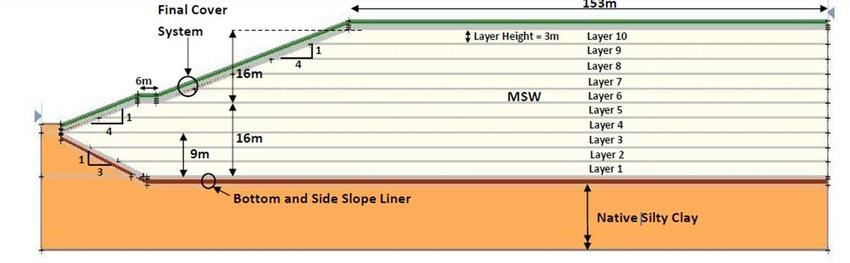
INTERNATIONAL JOURNAL OF SCIENTIFIC & TECHNOLOGY RESEARCH VOLUME 8, ISSUE 11, NOVEMBER 2019                             ISSN 2277-8616

network.                                                                 primary component of natural gas and is used to produce heat
Post-Processing                                                          and electricity around the world. The gas is also a significant
Post-Processing generally involves validating whether the                contributor to climate change. In 2017, methane accounted for
model is performing well on the test dataset (Generalization)            roughly 10 percent of all human-driven greenhouse gas
with the help of performance metrics such as loss function,              emissions in the U.S., according to the EPA. In the US,
cost function and back propagation in neural network.                    landfills are the third largest source of methane. Methane is
                                                                         produced when organic wastes decomposes in landfills.
Generalization                                                           Landfill gas consists of forty to sixty percent methane, with the
The ML model is now trained on the dataset and optimized.                remainder being mostly carbon dioxide. A CPCB report of
The data from the sensors can now be fed into the model for              2015 states that since 2011, 7 megacities of India accounted
prediction.                                                              for nearly 48 percent of total methane emissions in the
                                                                         country, courtesy of the large landfills in these cities. When
8 LANDFILL MONITORING SYSTEM                                             MSW is first deposited in a landfill, it undergoes an aerobic
The Landfill Monitoring sub-system consists of a LIDAR,                  decomposition stage with little methane generation, carbon
thermal imaging camera, Optical Camera and a methane gas                 dioxide and water vapor is produced as a by-product. Then
sensor.                                                                  typically after one-year, anaerobic conditions are established
                                                                         and methane producing bacteria begin to decompose the
                                                                         waste and generate methane. The bioreaction in landfill sites
                                                                         in anaerobic conditions takes place in acetogenesis and
                                                                         methanogenesis reactions.
                                                                         Acetogenesis

                                                                         Methanogenesis

                                                                           The methane gas which is produced from the landfill sites
                                                                         are collected in landfill sites such as Deonar rather than
                                                                         escaping into the atmosphere. The methane gas detection
                                                                         system helps in identifying methane gas levels in a certain
                                                                         area for preventing fires in landfill sites and the wastes from
                                                                         that area can also be used for methane collection. The landfills
                                                                         that capture biogas in US collect about 2.6 million tons of
                                                                         methane annually, 70% of which is used for generating heat
                                                                         and electricity. Theoretical studies indicate that complete
                                                                         anaerobic degradation of MSW generates about 200Nm 3 of
                                                                         methane per dry ton of contained biogas [5].

                                                                          Thermal Imaging
                                                                         Thermal imaging cameras work by detecting radiation in the
                                                                         long infrared range of the electromagnetic spectrum (9 – 14
                                                                         µm) and produce images of that radiation. Landfill sites has a
                                                                         vicinity to get frequent fires. Thermal hotspots and methane
                                                                         emission in landfills turn out to be the root cause for fire

       Figure 8.1 Landfill monitoring system components

Methane Gas Sensor
The methane gas sensor is used to find the levels of methane
gas produced from the landfill sites and the data is further
used to find if the landfill site has a vicinity to get fire accident,
and it can be also used for finding the resources for methane
collection from the landfill sites.

Methane Production from landfill sites                                   accidents.
Methane (CH4) is a colorless, odorless, and highly flammable
gas, when burned in the presence of oxygen, it produces
carbon dioxide and water vapor. Of all the greenhouse gases,
methane is one of the most potent because of its ability to
efficiently absorb heat in Earth’s atmosphere. Methane is the

                                                                                                                                     3674
                                                                 IJSTR©2019
                                                                 www.ijstr.org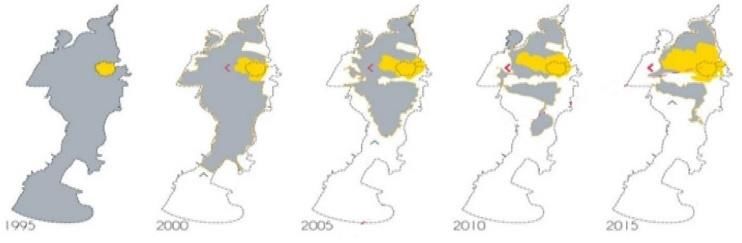
INTERNATIONAL JOURNAL OF SCIENTIFIC & TECHNOLOGY RESEARCH VOLUME 8, ISSUE 11, NOVEMBER 2019 ISSN 2277-8616
Determination of slope stability
The data from the drone can be processed further for
determining slope stability.
Figure 8.2 Use of LIDAR to Determine Area Methods
Slope stability can be found out by using methods of limits
Drones can be equipped with thermal imaging cameras for equilibrium. This method requires information about the
taking aerial images of landfill sites. Thermal imaging cameras strength parameters and geometrical parameters of the soil.
can be used for finding areas with thermal hotspots. The slope stability is found in methods of limit equilibrium by
finding the factor of safety. Factor of Safety is found out for the
LIDAR surface, which is more likely to fail, critical slip surface. There
LIDAR (Light Detection And Ranging) is an airborne or are two types of mechanisms of modes of failure, circular
terrestrial surveying method where a pulsed laser light is used critical failure mechanism and wedge critical failure
to determine the distance to a target [6]. Recent mechanism. This method has varying degrees of accuracy
advancements have made the possibility of using LIDAR based on the assumptions. The factor of safety is defined as
sensors in drones to acquire data such as area covered, the ratio of reaction over action. While evaluating the slope
distance between two subsequent objects, height of an object, stability, it is important to find the location of the critical slip
etc., in a short span of time. The Lidar sensor used for drones surface and its value of factor of safety.
performs laser scanning when the drone is airborne. This
active remote sensing technique can be used to provide Limit Equilibrium Method
Digital Elevation Models (DEMs) for characterization of trees, Determination of slope stability is a complex task as it involves
shrubs and other vegetation. This method allows efficient modeling of multi-variate dynamic systems of non-linear
survey of difficult terrain and large areas [7].The lidar sensor behavior. The slope stability was finding out using Artificial
will form an integral part of the landfill monitoring subsystem. Neural Networks. Slope stability was found out by using the
Important parameters to be measured include the area method of limit equilibrium. Slope stability estimation is a
covered by the landfill site, height of landfill slopes and complex problem which involves parameters from
periodic checks to determine if set boundary limits are geotechnical and geometrical parameters. The slope stability
encroached. Determination of covered area and prevention of was found out using Factor of Safety (FOS) which can be
expansion beyond defined boundary limits modeled as a function approximation problem or a
classification model. Slope estimation is a complex problem as
only a rough overall description of the physical and
Figure 8.3 Determination of Slope Stability
As exemplified in [8], the area covered can be easily
determined by a lidar affixed on a drone. Across most of the
landfill sites in India, the area covered is seldomly or never
determined. This has caused the rapid expansion of these geometrical characteristics of the slope is given as an input to
sites from their initial limits. Moreover, the data acquired by the ANN. Neural Networks provide descriptive as well as
terrestrial surveying using existing methods tend to be predictive analysis. The relative importance of the parameters
erroneous and time consuming. However, with the use of a can also be studied.
lidar, the covered area can be determined very frequently, and
appropriate actions may be taken to prevent further
expansion. Also, the distances between sites like water
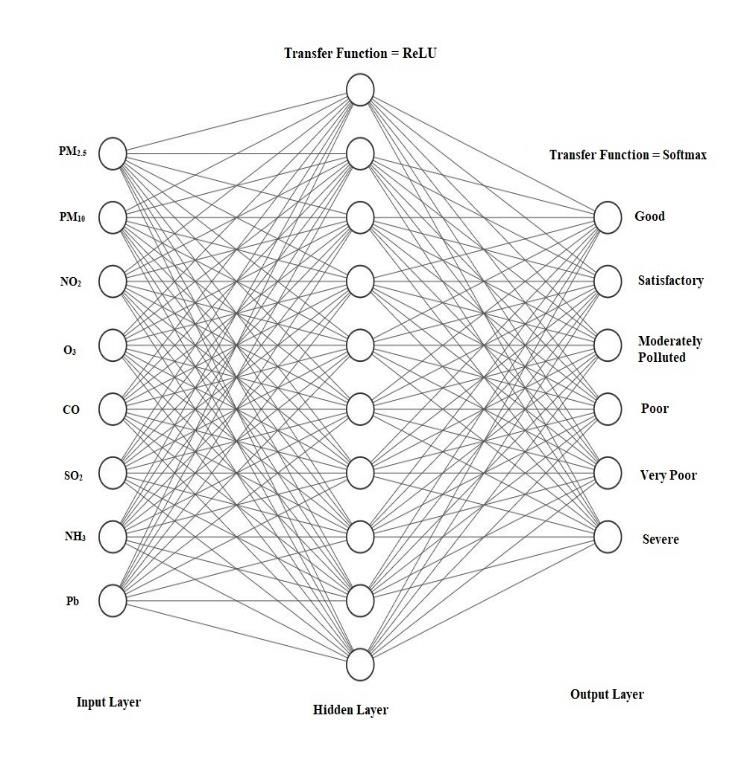
9 USING ANN
bodies and residential dwellings may be determined and The wedge failure mechanism is considered as the mode of
critical failure. The input parameters for wedge mode of
subsequent actions undertook to maintain a safe zone from
the landfill sites. failures are the unit weight(γ), cohesions (CA & CB), angles of
internal friction (φA & φB), angle of the line of intersection of two
3675
IJSTR©2019
www.ijstr.org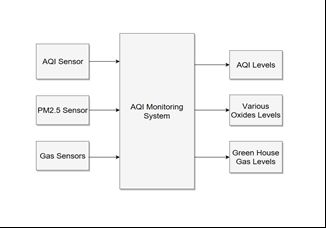
INTERNATIONAL JOURNAL OF SCIENTIFIC & TECHNOLOGY RESEARCH VOLUME 8, ISSUE 11, NOVEMBER 2019                                    ISSN 2277-8616

                                                                                               diseases are more susceptible
        Figure 9.1         ANN for determining Slope Stability              Severe     (401-   May cause respiratory impact even on healthy people,
                                                                            500)               and serious health impacts on people with lung/heart
                                                                                               disease.
joint sets(ΨP), slope angle(ΨF), height(H). Some of these
parameters can be calculated from the UAV and the other
                                                                            In the recent years, the AQI levels in Indian cities are at an
parameters are calculated manually. The output layer consists
                                                                            alarming level especially in densely populated and
of a single neuron which gives the value of Factor of Safety
                                                                            industrialized areas. The use of an UAV for monitoring the AQI
(FoS), from which the Status of Stability of the landfill can be
                                                                            levels is an effective way and replaces the need for stationary
found out.
                                                                            monitoring systems which could cost more to the government
10 AQI MONITORING SYSTEM                                                    from             the           developing            countries.
AQI in India
AQI is an index used for finding level of air pollution at a
particular place. Different countries have their own methods for
finding the Air Quality Index. The National Air Quality Index
has been launched in New Delhi on September 17, 2014
under Swachh Bharat Abhigyan. The Central Pollution Control
Board and the State Pollution Control Board in India monitors
more than 342 AQI Monitoring Stations under National Air
Monitoring Program. Monitoring AQI levels in many small
industrial cities and towns around India has proved to be
difficult due to the lack of monitoring stations. To overcome
this, UAV’s can act as a cost effective and viable mobile
monitoring unit.

                Table 10.1      AQI Standards in India
AQI          PM10    PM2.     NO2     O3     CO     SO2     NH3     Pb                         Figure 10.2 ANN for AQI levels
Category     (24h    5        (24hr   (8hr   (8hr   (24hr   (24hr   (24hr
(Range)      r)      (24h     )       )      )      )       )       )
                     r)
Good (0-     0-50    0-30     0-40    0-     0-     0-40    0-      0-0.5
50)                                   50     1.0            200
Satisfacto   51-     31-      41-     51-    1.1-   41-     201-    0.5-
ry    (51-   100     60       80      100    2.0    80      400     1.0
100)
Moderatel    101-    61-      81-     101    2.1-   81-     401-    1.1-
y Polluted   250     90       180     -      10     380     800     2.0
(101-200)                             168
Poor         251-    91-      181-    169    10-    381-    801-    2.1-
(201-300)    350     120      280     -      17     800     1200    3.0
                                      208
Very Poor    351-    121-     281-    209    17-    801-    1200    3.1-
(301-400)    430     250      400     -      34     1600    -       3.5
                                      748                   1800
Severe       430+    250+     400+    748    34+    1600    1800    3.5+
(401-500)                             +             +       +
                                                                                     Figure10.1 AQI Monitoring system components
There are six AQI categories in India, they are Good,
Satisfactory, Moderately Polluted, Poor, Very Poor, Severe.                 The World Health Organization report from 2018 suggests that
The AQI Model consists of eight pollutants such as PM10,                    9 out of 10 people breathe air containing high levels of air
PM2.5, NO2, SO2, CO, Ground level Ozone, NH3 and Pb.                        pollutants and estimates that 7 million people die due to fine
Based on the concentrations of these constituents in the                    particles in air they cause lung and cardiovascular diseases
ambient air the corresponding AQI Standards and the likely                  when inhaled. The inefficient use of energy by households, the
health impact are calculated.                                               agriculture industry, transport sectors, and coal-fired power
                                                                            plants contribute as the major source of particulate air
             Table 10.2     AQI limits and Health impacts                   pollution. Sand, desert dust, deforestation, and waste burning
       AQI                         Associated Health Impacts
Good (0-50)         Minimal Impact
                                                                            are additional sources of air pollution in some regions. Air
Satisfactory (51-   May cause minor breathing discomfort to sensitive       quality can also be influenced by natural elements such as
100)                people                                                  geographic, meteorological and seasonal factors.The AQI
Moderately          May cause breathing discomfort to people with lung      monitoring system monitors the air pollution level and using
Polluted (101-      disease such as asthma, and discomfort to people        the results obtained from the system, the people around the
200)                with heart diseases, children and older adults          area can be warned for wearing masks.
Poor (201-300)      May cause breathing discomfort to people on
                                                                               [9] suggests how AQI can be monitored effectively in an
                    prolonged exposure, and discomfort to people with
                    heart disease.                                          area through selective monitoring. The UAV is used for
Very Poor (301-     May cause respiratory illness to the people on          complete monitoring in the first and a 3D map of the AQI has
400)                prolonged exposure. People with lung and heart          been obtained from the data. Then the UAV selectively
                                                                                                                                              3676
                                                                    IJSTR©2019
                                                                    www.ijstr.org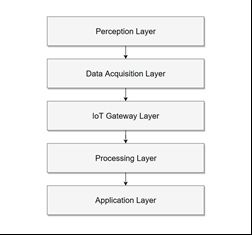
INTERNATIONAL JOURNAL OF SCIENTIFIC & TECHNOLOGY RESEARCH VOLUME 8, ISSUE 11, NOVEMBER 2019                           ISSN 2277-8616

monitors using optimized models for monitoring the area’s           problems may be potentially solved with the use of an Unitary
where there is higher AQI due to the battery concerns in a          UAV system to effectively Collect Data in a short span of time.
drone.                                                              Furthermore, the implementation of Proper ML algorithms and
   [10] talks on how short-term air quality monitoring can be       ANNs allow the data to be classified and sorted in a short
done using neural networks for taking preventive and evasive        time, allowing authorities to undertake defined actions without
actions against air pollution. The author further talks about       the need to spend much time on making decisions. Frequent
how AQI monitoring can be used for restricting the traffic,         updates of MSWLF site limits and AQI levels near industrial
industry in a particular area.                                      zones will also act as further incitement to take more action
   [11] The paper shows how neural network can perform              and will increase awareness among the general population.
better than multiple regression models. The author says that
the pollution-weather relationships are complex and non-linear      12 REFERENCES
which can be modeled using neural networks for better results.              [1] Arvind K. Jha, C. Sharma, Nahar Singh, R. Ramesh,
   [12] The author fits a linear model to a NO2 time series and                  R. Purvaja, Prabhat K. Gupta, ―Greenhouse gas
compares it with a neural network prediction and finds that                      emissions from municipal solid waste management in
neural network generally does well. The AQI monitoring sub-                      Indian mega-cities: A case study of Chennai landfill
system consists of PM 2.5 Sensor, Gas sensors for monitoring                     sites‖, Chemosphere, Volume 71, Issue 4, March
NO2, SO2, CO, Ground level Ozone, NH3. The UAV is affixed                        2008.
with a PM 2.5 sensor gas sensors and an air pump to draw air                [2] Manju Rawat, Umesh K. Singh, Amit K. Mishra, V.
into the detection chamber of the gas sensor. The distinct                       Subramanian, ―Methane emission and heavy metals
detection board circuit in its enclosure is affixed to the bottom                quantification from selected landfill areas in India‖,
of the UAV chassis. Once the UAV reaches the sufficient
                                                                                 Environmental Monitoring and Assesment, Volume
altitude, the detection board can be activated to collect                        137, February 2008.
parameters. By using a fleet of UAVs to form a coordinated                  [3] Kurian Joseph, S. Rajendiran, R. Senthilnathan, M.
network across a widespread geographical area, sufficient and                    Rakesh, "Integrated approach to solid waste
                                                                                 management in Chennai: an Indian metro city‖,
                                                                                 Journal of Material Cycles and Waste Management.
                                                                                 Volume 14, Issue 2, June 2012.
                                                                            [4] Oscar Alvear, Nicola Roberto Zema, Enrico Natalizio
                                                                                 and Carlos T. Calafate1, ―Using UAV-Based Systems
                                                                                 to Monitor Air Pollution in Areas with Poor
                                                                                 Accessibility‖, Volume 2017, August 2017.
                                                                            [5] Nickolas J. Themelis, Priscilla A. Ulloa, ―Methane
                                                                                 Generation in Landfills‖, Renewable Energy, Volume
                                                                                 32, Issue 7, June 2007.
                                                                            [6] Shouyang Liua, Fred Bareta, Mariem Abichoub, Fred
                                                                                 Boudonc, Samuel Thomasd, Kaiguang Zhaoe,
                                                                                 Christian Fournierf, Bruno Andrieub, Kamran Irfana,
                                                                                 Matthieu Hemmerlég, Benoit de Soland, ―Estimating
                                                                                 wheat green area index from ground-based LiDAR
                                                                                 measurement using a 3D canopy structure model‖,
                                                                                 Agricultural and Forest Meteorology, Volume 247,
                                                                                 December 2017.
                                                                            [7] Anuj Tiwari, Abhilasha Dixit, ―Unmanned Aerial
                                                                                 Vehicle and Geospatial Technology Pushing the
                                                                                 Limits of Development‖, American Journal of
                                                                                 Engineering Research, Volume 4, Issue 1, 2015.
                                                                            [8] Christiansen MP, Laursen MS, Jorgensen RN, Soren
                                                                                 Skovsen And Réne Gislum, ―Designing and Testing a
vital data can be collected, crowd sourced and shared without                    UAV Mapping System for Agricultural Field
constraints. The collected data is aggregated using a                            Surveying‖, Sensors, November 2017.
microprocessor, the data is then sent to the cloud via 4G LTE               [9] Yuzhe Yang, Zijie Zheng, Kaigui Bian, Yun Jiang,
module. The data is then pre – processed and analyzed using                      Lingyang Song, and Zhu Ha, ―Arms: A Fine-grained
the regression algorithm. The Multi-Layered Perceptron is                        3D AQI Realtime Monitoring System by UAV‖,
selected for finding the AQI from the data collected from the                    GLOBECOM          2017    –   2017     IEEE    Global
sensors into the six AQI categories. The data is then visualized                 Communications Conference, December 2017.
using a website or an app for displaying the data.                          [10] M. Kolehmainen, H. Martikainen, J. Ruuskanen,
             Figure 10.2 ANN for AQI levels                                      ―Neural networks and periodic components used in air
                                                                                 quality forecasting‖, Atmospheric Environment,
11 CONCLUSION                                                                    Volume 35, Issue 5, 2001.
Conventional Methods of monitoring Landfill sites are                       [11] Andrew C. Comrie, ―Comparing Neural Networks and
inconsistent,time consuming and non-periodic while the lack of                   Regression Models for Ozone Forecasting‖, Journal
adequate AQI monitoring stations which are present in ideal                      of the Air and Waste Management Association,
locations pose a challenge to collecting accurate data.These                     Volume 47, Issue 6, 1997.
                                                                                                                                  3677
                                                            IJSTR©2019
                                                            www.ijstr.org
INTERNATIONAL JOURNAL OF SCIENTIFIC & TECHNOLOGY RESEARCH VOLUME 8, ISSUE 11, NOVEMBER 2019 ISSN 2277-8616
[12] Madhavi Anushka Elangasinghe, Naresh Singhal, Kim
N. Dirks, Jennifer A. Salmond, ―Development of an
ANN–based air pollution forecasting system with
explicit knowledge through sensitivity analysis‖,
Atmospheric Pollution Research, Volume 5, Issue 4,
October 2014.
3678
IJSTR©2019
www.ijstr.orgYou can also read