Towards a Low-Cost Precision Viticulture System Using Internet of Things Devices - MDPI
←
→
Page content transcription
If your browser does not render page correctly, please read the page content below
IoT
Article
Towards a Low-Cost Precision Viticulture System
Using Internet of Things Devices
Petros Spachos
 School of Engineering, University of Guelph, Guelph, ON N1G 2W1, Canada; petros@uoguelph.ca

 Received: 20 January 2020; Accepted: 17 February 2020; Published: 21 February 2020

 Abstract: Precision Agriculture (PA) is an ever-expanding field that takes modern technological
 advancements and applies it to farming practices to reduce waste and increase output.
 One advancement that can play a significant role in achieving precision agriculture is wireless
 technology, and specifically the Internet of Things (IoT) devices. Small, inch scale and low-cost
 devices can be used to monitor great agricultural areas. In this paper, a system for precision viticulture
 which uses IoT devices for real-time monitoring is proposed. The different components of the system
 are programmed properly and the interconnection between them is designed to minimize energy
 consumption. Wireless sensor nodes measure soil moisture and soil temperature in the field and
 transmit the information to a base station. If the conditions are optimal for a disease or pest to occur,
 a drone flies towards the area. When the drone is over the node, pictures are captured and then it
 returns to the base station for further processing. The feasibility of the system is examined through
 experimentation in a realistic scenario.

 Keywords: precision viticulture; Internet of Things; sensors and instrumentation; smart agriculture

1. Introduction
      Precision Agriculture (PA) uses traditional farming practices along with technology to make
output production more efficient [1]. PA plays an important role in today’s agriculture production
as it can be used to monitor and control the spread of diseases [2,3]. For farmers, diseases can be
devastating, greatly affecting the output of a crop and limiting the yield produced. Ideally, most
farmers would strive to prevent any diseases from occurring altogether, but this is not always the
case. Controlling the likelihood of diseases occurring requires advanced knowledge on factors such as
vegetation type, soil, and weather, with the latter being the most unpredictable. The timing of disease
manifesting is unknown, and it depends on the conditions which are necessary for its development.
Events such as rain or high winds can easily transfer diseases between plants. Therefore, once a disease
has been identified, measures need to be taken to prevent a serious outbreak which can have a major
impact on the yield and quality of harvest for that season and future seasons.
      Vineyards are one area in agriculture where precise monitoring can alleviate the damage that
could be caused to plants. In addition to diseases, farmers need to be on the lookout for pests such as
birds, insects, and other animals which can cause damage to the plants in a vineyard. In an attempt
to minimize the amount of damage that occurs, all sections in the vineyard are checked, which is
referred to as scouting. Ideally, scouting is to take place at least once a week with special attention
given to areas that are prone to diseases and pests. Unfortunately, scouting is known to be a very
manual process, requiring a key eye to detail to accurately detect problem spots in the field. It is
also a very time-consuming process requiring a large number of hours for a large field to be checked
thoroughly [4]. Since most diseases prefer cool shady areas, such as the underside of leaves, they are
often missed by those who are inexperienced [5].

IoT 2020, 1, 2; doi:10.3390/iot1010002                                                www.mdpi.com/journal/iot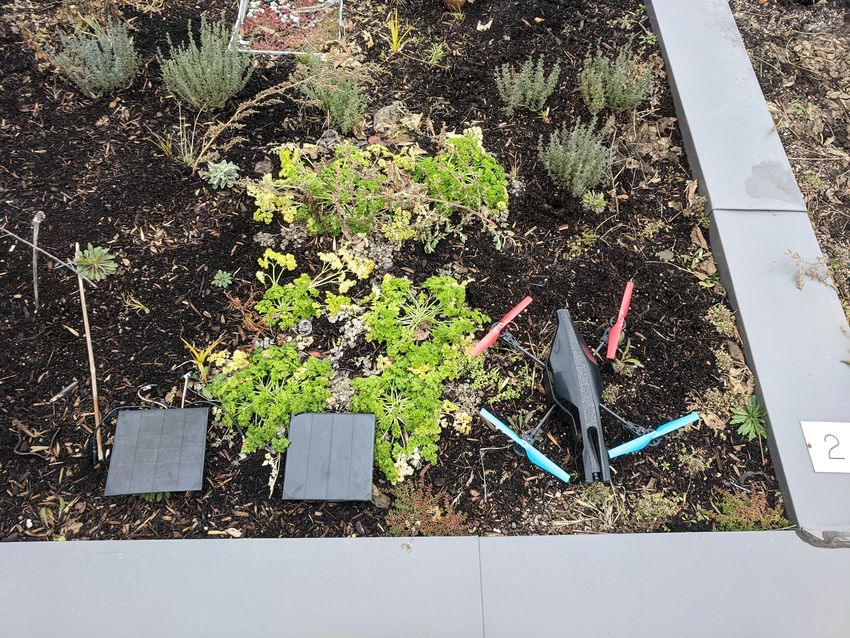
IoT 2020, 1, 2                                                                                      2 of 15

      To help manage those who specialize in scouting fields for areas that require special attention, one
promising approach is the use of Wireless Sensor Networks (WSNs). By using a WSN, sensor nodes
can be placed in areas where the probability of a certain event to occur is high. If an event does occur,
a notification could be issued to the farmers to indicate where an action to solve the problem should
take place. Using this type of monitoring system would be greatly beneficial for those with large fields
as micro-climates can often cause minor changes in weather conditions over little distances [6]. At the
same time, these technologies would be even more useful in the cases of heterogeneous environments,
like hilly terrains or similar. On top of a WSN, Unmanned Aerial Vehicles (UAVs), commonly known as
drones, can also be used to provide real-time data along with high-quality pictures that can help with
the detection of the disease. In recent years, due to the rapid technological advancements, commercial
use of UAVs has become more common [7,8]. With technology now more openly available for use
and prices in the range for everyday consumers, custom drone solutions can be designed for almost
any type of application. Having the ability to be programmable and function far distances without
any human interaction, drones are very flexible devices that can enhance monitoring in the field [9].
Due to its small stature, its maneuverability, and the ability to access and view areas that a human
would not be able to [10], drones can provide many advantages for PA. One instance where drones
have a clear advantage is in taking aerial views. For a human to take aerial pictures, some possible
options are through the use of satellites or by flying with a plane, both of which are expensive and not
very accurate. By being able to monitor from not only ground levels but also from above would allow
farmers to gain a new perspective on the challenges presented to them. Using a drone is a simple and
cost-effective solution that can achieve high precision.
      IoT devices have several advantages and challenges when it comes to agriculture and
viticulture [11]. In this work, a low-cost hardware implementation for real-time data acquisition
and processing in a vineyard is presented. Wireless nodes consisting of small and low-cost Internet
of Things (IoT) devices are used for monitoring the soil moisture and the soil temperature. If the
monitoring data exceed some predefined values, a drone flies over the area towards the node that
reported these data and takes pictures. Then, the drone returns to the base station and forwards the
pictures to a control room for further processing.
      The novelty of this work is on the introduced system framework and system implementation.
Commercially available, low-cost IoT devices were used to build wireless monitoring nodes.
A framework is also designed for data transmission. To minimize duplicate messages, a routing
protocol was implemented in each node. The energy consumption of each type of node, monitoring
and relay node, was measured in and was minimized. Three wireless technologies were examined and
compared in terms of energy consumption. A drone was used to locate specific nodes in the field and
the localization accuracy was also measured. Finally, two feasibility tests were conducted to examine
the performance of the proposed system.
      The rest of this paper is organized as follows: in Section 2, some background information on
vineyards and the diseases that can occur are presented. In Section 3, the related work is reviewed.
Section 4 describes the architecture of the proposed system followed by a description of the different
hardware components in Section 5. Section 6 presents results from experimentation with the system,
and Section 7 concludes this work.

2. Background Information
      To build an efficient monitoring system for a vineyard, it is important to understand the many
problems that can occur when operating and maintaining a vineyard. Not only does the perfect amount
of water need to be given to each of the plants, farmers consistently need to check for diseases and
pests that could severely impact a season’s yield. Diseases and pests have favorable conditions for their
development, and these conditions change depending on the disease or pest. In Eastern Canada, the
major grape diseases present include downy mildew, powdery mildew, gray mold, anthracnose, black
rot, and crown gall [12]. Each of these diseases has certain conditions that promote the growth and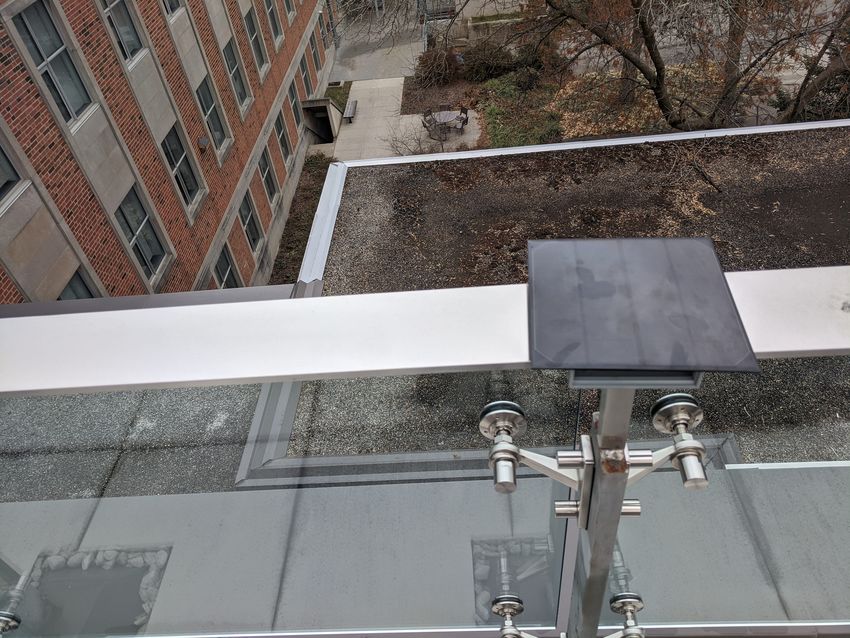
IoT 2020, 1, 2                                                                                         3 of 15

spread of the disease, with the largest factor being the weather conditions in the vineyard. Monitoring
the weather conditions is critical to determining if an outbreak of disease will occur and how large of
an impact it will make. A summary of favorable weather conditions for each major disease in Eastern
Canada can be seen in Table 1.

      Table 1. Favorable weather conditions for the development of diseases in a vineyard in Eastern
      Canada [12].

         Disease          Weather Conditions         Temperature Range (◦ C)            Time Period
     Downy Mildew             Heavy Rain                        22–26                   June–August
    Powdery Mildew              Overcast                        20–28                 Mid June–August
      Anthracnose          Rain, Heavy Rain                     20–26               June–Mid September
       Grey Mold       Overcast, Rain, Heavy Rain               15–25             June–Mid July, September
       Black Rot           Rain, Heavy Rain                     20–25                  Mid June–July
      Crown Gall              Heavy Rain                        20–32                Mid May–Mid July

     Pests also pose a serious threat to a plant’s health in the vineyard. Each of the individual pests
can target different parts of the plant and become a threat. During certain times of the year and certain
weather conditions, a pest is more likely to occur and special care needs to be made. A summary of the
major pests in vineyards in Northeastern USA can be seen in Table 2.

                            Table 2. Common pests that occur in vineyards [13].

                                  Pest                 Target
                                  Grape Berry Moth     Grapes
                                  Grape Leafhopper     Leaves
                                  Japanese Beetles     Leaves and Grapes
                                  Spider Mites         Leaves

      It is important to note the behavioral patterns of the pests. For example, grape leafhoppers do not
affect the quality of the grapes significantly when present in moderate numbers, but they can have
a rapid population increase during hot and dry years, causing significant damage [13]. At the same
time, heavy rain can increase the chances of downy mildew. It is important to monitor the vineyard for
weather patterns that favor particular pests that can affect the yield and health of the plants.
      Another effect the weather has on vineyards that can reduce the yield or quality is winter
injury. Winter injury causes damage to the tissues inside the wood and buds of the grapevine due
to temperatures dropping below a critical level for the species of grape or due to large jumps in
temperature over a short period of time [14]. One of the methods to reduce winter injury in grapevines
is to bury the vines or trunks of the vine to protect the plant from the cold temperatures. This is done
to ensure that the vine is healthy and to reduce the damage caused by possible disease and pests.
With the proposed IoT- based system, when the low temperatures are reported, proper actions can be
performed on time, to avoid further damage.

3. Related Work
     Due to the major impact a disease or pest can have on the yield of a crop, numerous systems
have been proposed and tested in literature in an attempt to halt the spread of the pathogens [15].
Since preventing a disease from appearing is impossible due to the uncontrollable conditions in the
environment, the focus has been placed on early detection of a disease before it manifests into an
epidemic. In an attempt to counteract this growing problem, systems that both utilize drones and do
not utilize drones have been developed [16].
     Latouche et al. [17] were able to determine that if a plant was infected with downy mildew,
infected leaves would fluoresce violet-blue under an Ultra-Violet (UV) light. Tests performed showed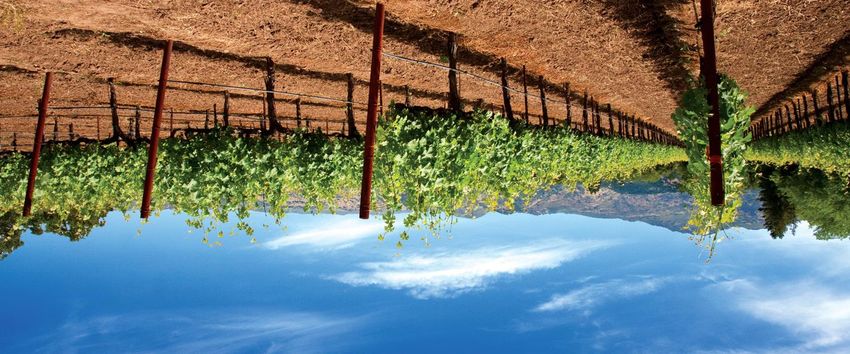
IoT 2020, 1, 2                                                                                  4 of 15

that they were able to design a portable sensor that was able to successfully detect the presence
of downy mildew in a plant in one day after the point of infection. The sensor was completely
non-invasive causing no harm to the plant while providing results immediately. Systems that have
focused on utilizing drones have had great success in determining the symptoms of diseases. Di
Gennaro et al. [18] used a drone equipped with a camera to take multi-spectral images. The images
could then be used to determine several vegetation parameters of the field. The use of the images
was able to determine vines showing symptoms of esca disease that human scouts in the field missed.
In addition, previous seasons’ weather conditions were used in estimating the likelihood of a disease
occurring. While able to detect early stages of the disease, images produced by the drone were not
able to confirm if a disease was present in the plant. Another drone-based system for agricultural use
is presented in [19]. They designed a system composed of two sensors, a stereo vision and thermal
imaging camera which are attached to a drone. Images taken by the drone were processed using a
deep neural network that was able to classify poor crops from healthy ones. When tested in a vineyard,
the system was correctly able to detect diseases such as downy mildew, powdery mildew, and acid rot,
but only when the occurrence was above a threshold in the monitoring area. Testing also showed that
the system was unable to function if the lighting conditions were not optimal for the sensors.
      There are also systems that use sensors for smart farming and viticulture. Several aspects of
sustainable IoT devices, including the wireless communication, sensing, and systems are presented
in [20]. In [21], a low-cost wireless system for agrochemical dosage reduction in precision farming
was introduced, while in [22] a low-cost wireless monitoring and decision support system for water
saving in agriculture was proposed. A comprehensive review of computer vision, image processing,
and machine learning techniques in viticulture is presented in [23]. In [24], a wireless underground
sensor networks (WUSA) for autonomous precision agriculture (PA) is proposed. The system gathers
soil information, from a WUSN in real-time to automatically control the center pivot (CP) irrigation
system for precision irrigation.
      In comparison with the works in the literature, the novelty of this work lies in the framework
and the system implementation. The introduced approach uses commercially available components,
design a real-time monitoring system for vineyards, properly program and configure the different
components and finally examine the feasibility of the system through real experimentation.

4. System Architecture
     An overview of the proposed system is shown in Figure 1. Information from sensors on the
ground is combined along with images from a UAV and after data fusion and analysis, the report is
sent to the system administrator.

                                           Data Processing
                                                                              Sensor Fusion
                                             & Analysis

                 Leaf picture                           Sensors             Micro controller

                                      Figure 1. System overview.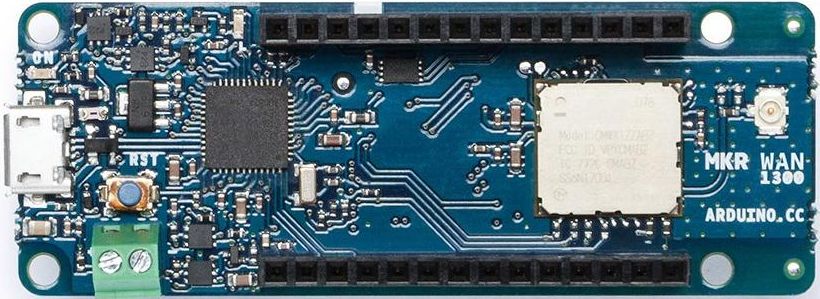
IoT 2020, 1, 2                                                                                        5 of 15

4.1. Application Scenario
      The proposed system focuses on using images from the UAV in conjunction with the sensor nodes
utilizing the information measured to determine if any changes have occurred in an area. If the sensors
report any results exceed a predefined threshold, a UAV could then be dispatched to the area for
images to be captured. There are two types of nodes. The first type, the monitoring nodes, they keep
collecting data from the sensor, form packets and forward the data to the relay nodes. The second
type of nodes, the relay nodes, they do not have any sensing capabilities, but they are able to receive
packets and forwards them towards the control room. The system contains the following seven steps:

1.     The monitoring node collects environmental information on the plant or the immediate vicinity
       where the node is located.
2.     The monitoring node transmits the collected information in a packet toward the destination node
       through the relay nodes.
3.     The collected data is then stored in a system containing a database of previous information
       collected at that location. The system can then analyze the new data with historical records
       and with existing models which are known for the different diseases in order to determine if
       conditions are favorable for the development of a disease or the presence of a pest.
4.     If attention is required the UAV is ordered to the area for surveillance images to be taken. To find
       the exact location, the UAV uses its GPS.
5.     Once the UAV reaches the required location it takes images of the area and then it returns to the
       control room.
6.     The images taken by the UAV are forwarded to the control room and then to the system
       administrator.
7.     Any further actions that need to be taken for the plant are done by the system administrator.

    In extreme weather conditions, the drone might not be able to fly and the system might not
operate as expected.

4.2. System Framework
      A framework of the proposed system is shown in Figure 2. The system has three main components:

1.     The first component includes the wireless monitoring nodes. The wireless monitoring nodes
       are equipped with a low energy processing unit, wired soil and moisture sensors and a wireless
       communication unit. Each node has four soil moisture and four soil temperature sensors.
       The nodes are powered through a rechargeable battery. The battery is charged through a solar
       panel. The sensor data are passed to the processing unit for initial filtering and to form data
       packets. The data packets are passed to the wireless communication unit to forward them
       wirelessly to the relay nodes.
2.     The second important component is the wireless network that forwards all the sensor data from
       the monitoring nodes to the control room. The network is composed of relay nodes. The relay
       nodes have only the necessary communication unit to forward the data as well as similar energy
       harvesting capabilities with the monitoring nodes. However, the relay nodes do not have
       any sensors. Each relay node is able to receive and to forward the data packets towards the
       control room.
3.     The third component is the control room which consists of a computer and a UAV. At the control
       room, all the data are collected and processed. If the collected data exceeds a predefined threshold,
       the control room sends a notification to the UAV. The UAV then can maneuver to the points of
       interest as determined by the sensor nodes.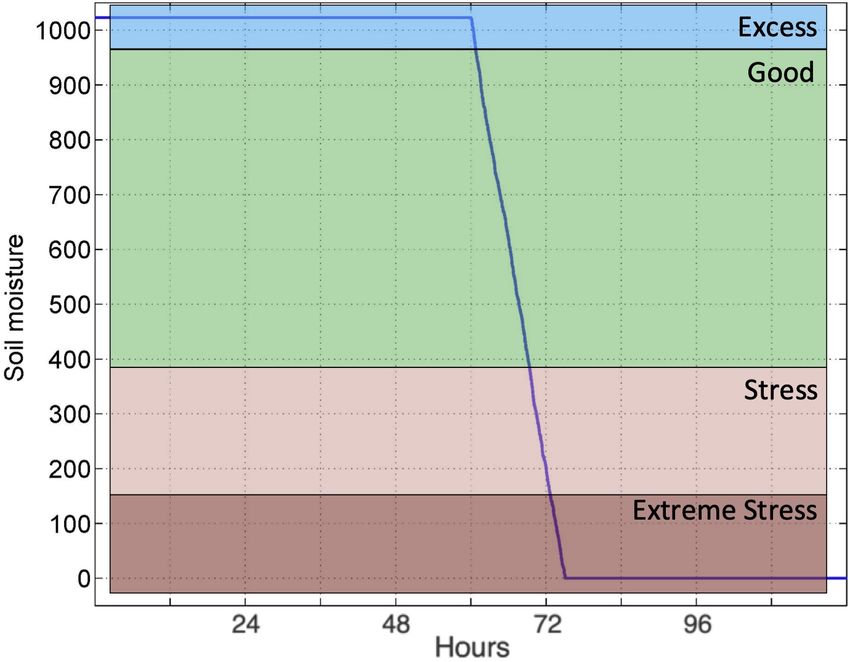
IoT 2020, 1, 2                                                                                                                               6 of 15

          Wireless Monitoring Nodes                                     Wireless Network                                     Control Room

                                                                                                                                    UAV

                                                                            Relay node

                     Monitoring Node

                                                                                                                              Base Station

                                                       Figure 2. System framework.
4.3. Flow Diagrams of the Processes
      There are three main processes in the proposed system, as shown in Figures 3–5.

                       Sensor 1

          Sensor 2
                                                                                              Data Packet
                                               Monitoring Node                                                      Relay Node
          Sensor 3

                           Sensor 4

                                                       Figure 3. Monitoring process.

                                                  Relay Node

                                                                                                             Data Packet
                                                                                   Relay Node                                Control Room

         Monitoring Node

                                                 Relay Node

                                                  Figure 4. Data forwarding process.

                                                           Send                                             Flying towards
                                                        coordinates                Take off
                                                                       UAV base                       UAV      the node
                       Notify system
                       administrator                                                                                       Take picture of
                                       Control Room
                                                                                                                              the leafs

                                                       Send pictures   UAV base                       UAV   Flying back to
                                                                                   Landing                  control room

                                                      Figure 5. Image capture process.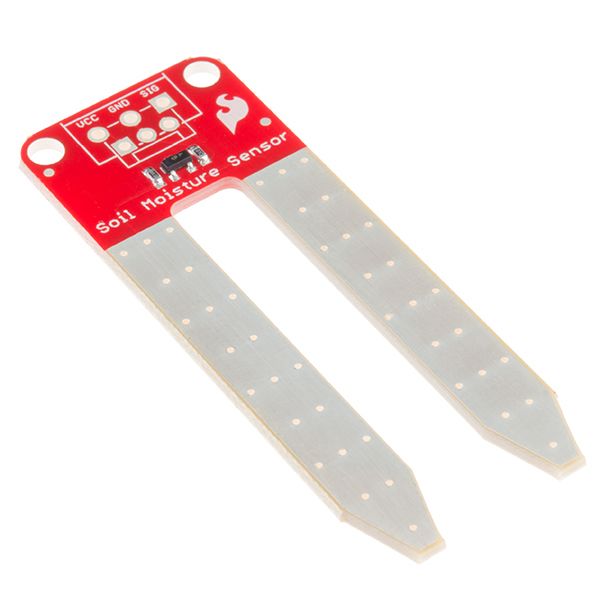
IoT 2020, 1, 2 7 of 15
4.3.1. Monitoring Process
When the system needs to monitor the area, the different sensors forward the data packets to
the monitoring nodes. The sensors are connected with the monitoring node through wires and one
monitoring node can have multiple sensors. When the monitoring node receives the data, it checks if
there is any difference from the previous time each sensor report data. This is necessary to minimize
the required data transmissions. In this way, the data that are new and different from the previous
time will be forwarded to the relay node, while the data that are the same with previous times will be
ignored. The diagram of the monitoring process is shown in Figure 3.
4.3.2. Data Forwarding Process
When a relay node receives data packets from a monitoring node, it needs to forward them
towards the control room. Since the relay nodes are static, the forwarding table for the relay nodes is
the same over time, unless one of the relay nodes runs out of battery. The relay node might receive the
same data packet from more than one neighbor relay nodes. In this case, the relay node, transmit the
packet only once and drop any future instances of the packet. The diagram of the data forwarding
process is shown in Figure 4.
4.3.3. Image Capture Process
The computer at the control room keeps a record of all the sensor data received. When the data
from one of the nodes exceed or is lower than expected values, the computer at the control room
forwards the location of the node to the UAV. Since the nodes are static the coordinates of each node
are known. The UAV then takes off and moves towards the node that reported the data [25]. When it is
over the node, it starts taking pictures of the leaves and the area around. The UAV takes two pictures
over each initial location and then rotates horizontally for 40◦ and takes pictures again. The process is
repeated until the drone rotates for 360◦ horizontal. Then, the UAV returns to the base station at the
control room. After landing, the UAV forwards all the pictures to the computer which sends them to
the administrator. The diagram of the image capture process is shown in Figure 5.
5. Hardware Infrastructure
The hardware components of the introduced system, along with their parameters and some initial
testing results are presented in this section.
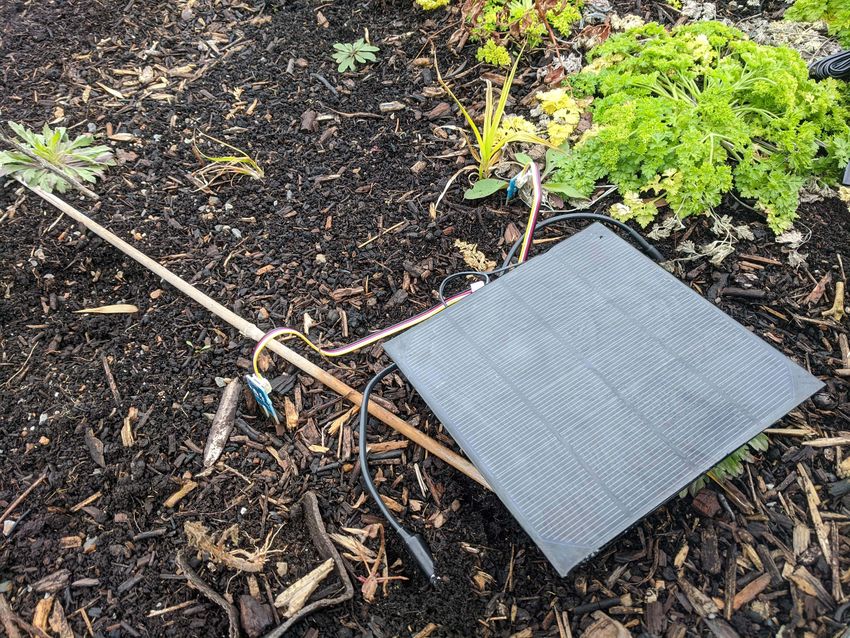
5.1. Sensor Unit
Sensors are used for monitoring the environmental conditions in the field. In the introduced
system, the sensors are selected to measure soil moisture and soil temperature. The sensors are shown
in Figures 6 and 7, along with some of the sensor data collected through initial testing. These are not
data from the field, but data collected during initial testing at an indoor environment to examine the
feasibility of the sensor node. The data are plotted for demonstration only.
Since after a heavy rainfall water can accumulate in a certain spot in the field, it would be
difficult to find wet spots if the field is not checked regularly. Sparkfun soil moisture sensor [26],
showing in Figure 6a, was selected because of each sufficient accuracy (accuracy 3% volumetric water
content (VWC), is sufficient to characterize the soil reading in the four general categories) , low energy
requirements and low-cost. Other soil moisture sensors that have better accuracy exist in the market,
however, that would increase significantly the cost per monitoring node. Initial testing with the soil
moisture sensor was conducted and the results are shown in Figure 6b. The sensor needed some initial
calibration, however, the accuracy of the sensor is sufficient for the proposed application.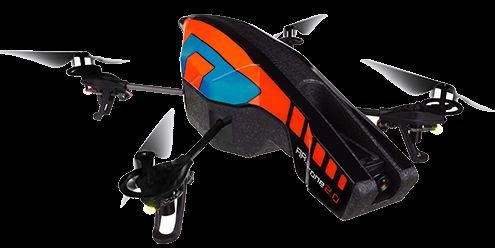
IoT 2020, 1, 2                                                                                        8 of 15

                 (a)                                                                (b)

                       Figure 6. Soil moisture (a) sensor and (b) experimental data readings.

                   (a)                                                              (b)

                  Figure 7. Soil temperature (a) sensor and (b) experimental data readings.

    For most diseases, the air temperature has a specific range where it is most likely to manifest.
However, soil temperature can also give important insight regarding the manifest of the diseases.
By monitoring when the temperature for an area is in the high-risk range of a disease developing,
proper protection practices can be applied well in advance. DS18B20 waterproof temperature
sensor [27], showing in Figure 7a, was selected for the proposed system. Similar to the soil moisture
sensor selection, this DS18B20 was preferred over other temperature sensors due to its low-cost and
low energy requirements. The results of initial testing with this sensor are shown in Figure 7b.

5.2. Processing Unit
     As a processing unit, a microcontroller was used. The microcontroller collects the sensor data,
processes them and forwards them to the control room. To keep a low energy consumption, a low
power microcontroller is required. There are several low-cost microcontrollers in the market. Due to its
low power consumption, low-cost and ease of integration with other devices, an Arduino from MKR
family was selected [28]. It has available pins to connect up to 8 sensors, for instance 4 for soil moisture
and 4 for soil temperature, it is small and has low power requirements, while it can provide different
wireless connectivity. An Arduino MKR is shown in Figure 8 along with the specifications in Table 3.
IoT 2020, 1, 2 9 of 15
Figure 8. Arduino MKR 1300 [28].
Table 3. MKR 1300 Specification.
Microcontroller SAMD21 Cortex-M0+ 32bit low power ARM MCU
Power Supply 5V
Digital I/O Pins 8
Analog Input Pins 7
Length × Width 67.64 mm × 25 mm
5.3. Radio Unit
The proper selection of the wireless communication technology that will be used to transfer data
between the nodes and the control room in crucial. It is important that the selected technology has
low power requirement so the total energy consumption in each node is low. In terms of transmission
range, a long transmission range would be more applicable for a viticulture application. The packets
usually need to travel from remote areas to a control room, hence, a long transmission range would
minimize the number of hops and relay nodes that would be necessary between the nodes and the
control room. At the same time, for the proposed application, the data size will be low. Only small
packets will be sent from the different nodes to the control room every couple of minutes, hence
real-time data transmission is not a requirement for such application.
Among the available wireless technologies, Wi-Fi (2.4GHz), Bluetooth Low Energy (BLE) and
LoRaWAN are popular for many applications. The characteristics of each technology are shown in
Table 4.
Table 4. Summary of wireless technology characteristics.
Transmission Bitrate Power
Technology Advantages Disadvantages
Range (m) (Mbit/s) Requirements
High availability, Prone to noise,
Wi-Fi up to 100 288.8 Moderate does not require high energy
extra hardware consumption
Low energy Prone to
BLE v4 up to 60 25 Low
consumption interference
Very long transmission
Requires extra
LoRaWAN up to 15000 0.05 Extremely Low range, low energy
hardware
consumption
The three wireless protocols were tested and evaluated mainly based on power consumption.
To experiment with Wi-Fi and Bluetooth, the Arduino MKR 1010 microcontroller was used [29]. This
contains a U-BLOX NINA-W102 chip, which is capable of 2.4 GHz operation, capable of Wi-Fi and
BLE [29]. For the LoRaWAN experiments, Arduino MKR 1300 was used, since it is designed to use
the LoRa protocol with an integrated Murata CMWX1ZZABZ chip [28]. The frequencies available
on this chip are 433 MHz, 868 MHz, and 915 MHz. The processor of each microcontroller is an
Atmel ATSAMD21 ARM-based microprocessor. The consistency of this microprocessor and other
peripherals on the boards keep the small variances between each prototype negligible. A summary of
each configuration of the prototype can be seen in Table 5.IoT 2020, 1, 2 10 of 15
Table 5. Wireless protocol overview.
MCU Protocol Frequency IEEE Standard
MKR 1010 Wi-Fi 2.40–2.50 GHz 802.11 b/g/n
MKR 1010 BLE v4 2.40–2.48 GHz 802.15.1
MKR 1300 LoRaWAN 433/868/915 MHz 802.11 ah
To examine the appropriateness of each wireless technology for the proposed system, the focus
was on the energy requirements. Three MKR boards were used, one for each technology and one soil
moisture and one soil temperature sensor in each board was connected. Each node transmitted data
reported from the sensor every second, without any filtering and processing, for approximately 5 min.
All the prototypes were powered using the Monsoon power monitor in order to be able to monitor the
energy requirements. The Monsoon power monitor is able to get very accurate measurement readings
and allows the user to easily log data to average the power over an amount of time [30].
The results are shown in Figure 9. The energy consumption of each board when the two sensors
are connected on the board was measured, shown in Figure 9a. As expected, the energy consumption
of the LoRa board is lower than the other two boards. The energy consumption of the boards without
the sensors was also measured, shown in Figure 9b. It is clear that LoRa technology is promising and
performs better in terms of energy requirements in both the monitoring and the relay nodes. The low
data rate of LoRa is not a drawback for our system since the sensor nodes are expected to transmit
only a few data over an hour of monitoring.
WiFi WiFi
350 BLE 350 BLE
LoRa LoRa
Average Power Consumption (mW)
Average Power Consumption (mW)
300 300
250 250
200 200
150 150
100 100
50 50
0 0
(a) Monitoring node with two sensors. (b) Relay node.
Figure 9. Power consumption of different wireless technologies (a) for the monitoring node and (b) for
the relay node.
5.4. UAV
The UAV is an important component of the system and will function based on the data that is
received from the sensor nodes in the field. If the computer at the control room determines that there
is an area that is likely a disease to manifest then the UAV is sent to that area to take pictures. Once the
UAV has returned the pictures are forwarded to the system administrator to decide any further action
needed. If the picture quality or the sensor data are not sufficient the system administrator can send
the UAV back over the node to take more pictures.
In the introduced system, the quadcopter AR Drone 2.0 was used [31]. The drone is shown in
Figure 10 along with some important specifications in Table 6.IoT 2020, 1, 2 11 of 15
Figure 10. AR Drone 2.0 [31].
Table 6. AR Drone 2.0 Specification.
Battery 1500 mAh LiPo
Camera HD camera 720p, 30 fps video output
Flight Time 18 min
Interfaces Wi-Fi 802.11b/g
The drone is also equipped with GPS. This increases energy consumption and decreases the
available flying time. To expend the available flying time, different configurations were examined.
At the default configuration, the drone uses its camera and forwards a live video to the controller device,
while it also uses the GPS. However, with this configuration, the flying time is 15 min. Without using
the Wi-Fi network and just store the video at the SD card, the flying time is 18 min. A third configuration
was designed. In this configuration, when the drone leaves the control room, it deactivates both the
camera and the wireless transmission. Only when the drone is over the node which reported the
problem, the drone turns on the camera and takes the picture. The drone returns to the base station
and after it lands successfully it enables its wireless transmission to forward the data to the computer.
This configuration can achieve a maximum of 22 min, hence not only the drone is active for more time
but it can also cover a greater area. The energy consumption of the three configurations is shown in
Figure 11a.
The current consumption of the drone was also examined, under the three different configurations,
when it needs to cover a distance of 1 km. The drone can reach the speed of 5 m/s (11 mph), while it
needs 20 s to receive the coordinates and take off from the control room, and 15 s to take pictures from
the node that reported problems. The results are shown in Figure 11b.
25
Video + GPS + WiFi Video + GPS + WiFi
Video + GPS 3200 Video + GPS
Camera + GPS Camera + GPS
20
3000
Current consumption (mA)
Flying time (min)
15 2800
2600
10
2400
5
2200
0 2000
0 100 200 300 400
Flying time (s)
(a) Flying time under different configurations. (b) Current consumption when flying 1 km,
for each configuration.
Figure 11. Experimental results of the drone (a) flying time and (b) current consumption when flying
1 km, under different configurations.IoT 2020, 1, 2 12 of 15
6. Experimental Results
In order to evaluate the performance of the system, several experiments were conducted in a
vineyard. The experiments took place in August 2019 and in October 2019, in order to have different
performance of the solar panels at the nodes. In total, 10 wireless monitoring nodes were used along
with 4 relay nodes. Each wireless monitoring node had 4 soil moisture and 4 soil temperature sensors.
The distance between the relay nodes was approximately 1 km. All the components of the system are
shown in Figure 12.
(a) Monitoring node 1. (b) Relay node on (c) System with drone.
mounting tripod.
(d) Monitoring node 2 (e) Relay node on the (f) System with drone.
groud.
Figure 12. Components of the proposed system.
6.1. Energy Consumption
In this experiment, the lifetime of the monitoring nodes was examined. The nodes keep
transmitting all the time until they run out of battery. The results are shown in Figure 13. In a
real scenario, the nodes will not transmit all the time, however, in this experiment, the upper bound
limit of the system was examined. According to the experimental results, in both periods, the wireless
nodes manage to transmit for more than 160 h, before running out of energy.
6.2. Location Accuracy
In this experiment, the accuracy of the drone to locate a node in the network is examined.
Experiments were conducted for all the 10 wireless monitoring nodes. The results are shown in
Figure 14. The maximum value of the error was 1.3 m. This error was due to the behavior of the drone
during different environmental conditions. According to the experimental results, factors such as the
wind or the residual energy in the drone will affect the accuracy of the GPS, the flying stability of the
drone and consequently the picture quality. In order to minimize these problems, better drones are
available in the market. However, that might increase the cost of the system significantly.IoT 2020, 1, 2 13 of 15
(a) Experiment 1: August 2019. (b) Experiment 2: October 2019
Figure 13. Power in each monitoring node.
1
0.9
0.8
0.7
0.6
CDF
0.5
0.4
0.3
0.2
0.1
0
0 0.2 0.4 0.6 0.8 1 1.2 1.4
Error (m)
Figure 14. Cumulative probability error for the different nodes.
7. Conclusions
In this paper, an IoT-based system for real-time monitoring in a vineyard by utilizing drones was
presented. The introduced system consists of a low-cost IoT network that can be used in the monitoring
of plants in a vineyard. When the monitoring values exceed some threshold, a drone is used to obtain
photographs of the problematic area which will be sent to the system administrator. The focus of this
work was on a low-cost system implementation for real-time data acquisition and monitoring.
Further experimentation is necessary to examine the performance of the introduced system, while
cybersecurity issues should also be considered. The experiments presented in this paper are promising
for the feasibility of the proposed system. The system was able to report the data in real-time and also
locate the node which collected the data that exceed a predefined threshold, with acceptable accuracy.
However, proper sensor calibration and parameter configuration are necessary for every different
application scenario.
Funding: This research was funded by the Natural Sciences and Engineering Research Council of Canada under
Grant RGPIN/2016-04007
Conflicts of Interest: The authors declare no conflict of interest.IoT 2020, 1, 2 14 of 15
References
1. Mulla, D.J. Twenty five years of remote sensing in precision agriculture: Key advances and remaining
knowledge gaps. Biosyst. Eng. 2013, 114, 358–371. doi:10.1016/j.biosystemseng.2012.08.009. [CrossRef]
2. Ponti, M.; Chaves, A.A.; Jorge, F.R.; Costa, G.B.P.; Colturato, A.; Branco, K.R.L.J.C. Precision Agriculture:
Using Low-Cost Systems to Acquire Low-Altitude Images. IEEE Comput. Graph. Appl. 2016, 36, 14–20.
doi:10.1109/MCG.2016.69. [CrossRef] [PubMed]
3. Hamrita, T.K.; Durrence, J.S.; Vellidis, G. Precision farming practices. IEEE Ind. Appl. Mag. 2009, 15, 34–42.
doi:10.1109/MIAS.2009.931816. [CrossRef]
4. Mahaffee, W.F.; Stoll, R. The ebb and flow of airborne pathogens: Monitoring and use in disease management
decisions. Phytopathology 2016, 106, 420–431. [CrossRef] [PubMed]
5. Griffiths, H.; Shen, H.; Li, N.; Rojas, S.; Perkins, N.; Liu, M. Vineyard management in virtual reality:
autonomous control of a transformable drone. Proc. SPIE 2017, doi:10.1117/12.2267726. [CrossRef]
6. Koshy, S.S.; Nagaraju, Y.; Palli, S.; Prasad, Y.; Pola, N. Wireless Sensor Network based Forewarning Models
for Pests and Diseases in Agriculture—A Case Study on Groundnut. Int. J. Adv. Res. Technol. 2014, 3, 74–82.
7. Qi, F.; Zhu, X.; Mang, G.; Kadoch, M.; Li, W. UAV Network and IoT in the Sky for Future Smart Cities.
IEEE Netw. 2019, 33, 96–101. doi:10.1109/MNET.2019.1800250. [CrossRef]
8. Menouar, H.; Guvenc, I.; Akkaya, K.; Uluagac, A.S.; Kadri, A.; Tuncer, A. UAV-Enabled Intelligent
Transportation Systems for the Smart City: Applications and Challenges. IEEE Commun. Mag. 2017,
55, 22–28. doi:10.1109/MCOM.2017.1600238CM. [CrossRef]
9. Spachos, P.; Gregori, S. Integration of Wireless Sensor Networks and Smart UAVs for Precision Viticulture.
IEEE Internet Comput. 2019, 23, 8–16. doi:10.1109/MIC.2018.2890234. [CrossRef]
10. Malveaux, C.; Hall, S.G.; Price, R. Using drones in agriculture: Unmanned aerial systems for agricultural
remote sensing applications. In Proceedings of the 2014 Montreal, Quebec, QC, Canada, 13–16 July 2014;
American Society of Agricultural and Biological Engineers: St. Joseph, MI, USA, 2014; p. 1.
11. Elijah, O.; Rahman, T.A.; Orikumhi, I.; Leow, C.Y.; Hindia, M.N. An Overview of Internet of Things (IoT)
and Data Analytics in Agriculture: Benefits and Challenges. IEEE Internet Things J. 2018, 5, 3758–3773.
doi:10.1109/JIOT.2018.2844296. [CrossRef]
12. Carisse, O.; Bacon, R.; Lasnier, J.; McFadden-Smith, W. Identification Guide to the Major Diseases of Grapes
[electronic Resource]; Agriculture and Agri-Food Canada: Ottawa, ON, Canada, 2006.
13. Carroll, J.; Weigle, T. 2016 Organic Production and IPM Guide for Grapes; New York State IPM Program:
Geneva, NY, USA, 2016.
14. Carter, K.; Huffman, L. Impacts of Cold Temperatures on Wine Grapes. 2014. Available online: http://www.
omafra.gov.on.ca/english/crops/hort/news/hortmatt/2014/01hrt14a1.htm/ (accessed on 19 February
2020).
15. McDonald, B.A.; Stukenbrock, E.H. Rapid emergence of pathogens in agro-ecosystems: global threats to
agricultural sustainability and food security. Philos. Trans. R. Soc. Lond. Ser. B Biol. Sci. 2016, 371. [CrossRef]
[PubMed]
16. Jiang, P.; Chen, Y.; Liu, B.; He, D.; Liang, C. Real-Time Detection of Apple Leaf Diseases Using Deep
Learning Approach Based on Improved Convolutional Neural Networks. IEEE Access 2019, 7, 59069–59080.
doi:10.1109/ACCESS.2019.2914929. [CrossRef]
17. Latouche, G.; Poutaraud, A.; Bellow, S.; Evain, S.; Ley, L.; Brown, S.C.; Cerovic, Z.G. Detection of downy
mildew in the field on grapevine leaves using a new portable fluorescence sensor. In Proceedings of the
Seventh International Workshop on Grapevine Downy and Powdery Mildew, Vitoria, Spain, 30 June–4 July
2014; pp. 118–121.
18. Di Gennaro, S.F.; Battiston, E.; Di Marco, S.; Facini, O.; Matese, A.; Nocentini, M.; Palliotti, A.; Mugnai, L.
Unmanned Aerial Vehicle (UAV)-based remote sensing to monitor grapevine leaf stripe disease within a
vineyard affected by esca complex. Phytopathol. Mediterr. 2016, 55, 262.
19. Rilling, S.; Nielsen, M.; Milella, A.; Jestel, C.; Fröhlich, P.; Reina, G. A multisensor platform for comprehensive
detection of crop status: Results from two case studies. In Proceedings of the 2017 14th IEEE International
Conference on Advanced Video and Signal Based Surveillance (AVSS), Lecce, Italy, 29 August–1 September
2017; pp. 1–6.IoT 2020, 1, 2 15 of 15
20. Salam, A. Internet of Things for Sustainable Community Development, 1st ed.; Springer Nature: London, UK,
2020. doi:10.1007/978-3-030-35291-2. [CrossRef]
21. Viani, F.; Bertolli, M.; Polo, A. Low-Cost Wireless System for Agrochemical Dosage Reduction in Precision
Farming. IEEE Sens. J. 2017, 17, 5–6. doi:10.1109/JSEN.2016.2622244. [CrossRef]
22. Viani, F.; Bertolli, M.; Salucci, M.; Polo, A. Low-Cost Wireless Monitoring and Decision Support for Water
Saving in Agriculture. IEEE Sens. J. 2017, 17, 4299–4309. doi:10.1109/JSEN.2017.2705043. [CrossRef]
23. Seng, K.P.; Ang, L.; Schmidtke, L.M.; Rogiers, S.Y. Computer Vision and Machine Learning for Viticulture
Technology. IEEE Access 2018, 6, 67494–67510. doi:10.1109/ACCESS.2018.2875862. [CrossRef]
24. Dong, X.; Vuran, M.C.; Irmak, S. Autonomous precision agriculture through integration of wireless
underground sensor networks with center pivot irrigation systems. Ad Hoc Netw. 2013, 11, 1975–1987.
[CrossRef]
25. González, R.; Rodríguez, F.; Sánchez-Hermosilla, J.; Donaire, J. Navigation techniques for mobile robots in
greenhouses. Appl. Eng. Agric. 2009, 25, 153–165. [CrossRef]
26. Soil Moisture Sensor. Available online: https://www.sparkfun.com/products/13322 (accessed on
19 February 2020).
27. Waterproof DS18B20 Digital Temperature Sensor. Available online: https://www.adafruit.com/product/381
(accessed on 19 February 2020).
28. Arduino MKR 1300. Available online: https://store.arduino.cc/usa/mkr-wan-1300 (accessed on 19 February
2020).
29. Arduino MKR 1010. Available online: https://store.arduino.cc/usa/mkr-wifi-1010 (accessed on 19 February
2020).
30. Monsoon Power Monitor. Available online: http://www.msoon.com/LabEquipment/PowerMonitor/
(accessed on 19 February 2020).
31. Parrot AR Drone 2.0 Elite Edition. Available online: https://www.parrot.com/global/drones/parrot-
ardrone-20-elite-edition (accessed on 19 February 2020).
c 2020 by the authors. Licensee MDPI, Basel, Switzerland. This article is an open access
article distributed under the terms and conditions of the Creative Commons Attribution
(CC BY) license (http://creativecommons.org/licenses/by/4.0/).You can also read