Postharvest Quality Monitoring and Variance Analysis of Peach and Nectarine Cold Chain with Multi-Sensors Technology - UNIRI
←
→
Page content transcription
If your browser does not render page correctly, please read the page content below
applied
           sciences
Article
Postharvest Quality Monitoring and Variance
Analysis of Peach and Nectarine Cold Chain with
Multi-Sensors Technology
Xiang Wang 1 , Maja Matetić 2 , Huijuan Zhou 3 , Xiaoshuan Zhang 1, * and Tomislav Jemrić 4, *
 1   Beijing Laboratory of Food Quality and Safety, China Agricultural University, Beijing 100083, China;
     wxzrjj@cau.edu.cn
 2   Department of Informatics, University of Rijeka, Radmile Matejčić 2, Rijeka HR-51000, Croatia;
     majam@inf.uniri.hr
 3   Key Laboratory of Protected Horticultural Technology, Forestry and Fruit Research Institute,
     Shanghai Academy of Agricultural Sciences, Shanghai 201403, China; zhouhuijuanzc@163.com
 4   Faculty of Agriculture, Department of Pomology, University of Zagreb, Svetošimunska 25,
     Zagreb HR-10000, Croatia
 *   Correspondence: zhxshuan@cau.edu.cn (X.Z.); tjemric@agr.hr (T.J.); Tel.: +86-10-6273-6717 (X.Z.);
     +385-1-2393-612 (T.J.)

 Academic Editor: Antonio Fernández-Caballero
 Received: 21 November 2016; Accepted: 23 January 2017; Published: 29 January 2017

 Abstract: Fresh peaches and nectarines are very popular for their high nutritional and therapeutic
 value. Unfortunately, they are prone to rapid deterioration after harvest, especially if the cold chain is not
 well maintained. The objective of this work is to study the environmental fluctuation and the quality
 change of fresh peaches and nectarines in cold chain. The temperature, relative humidity, and CO2 level
 were real-time monitored by sensor nodes with a wireless sensor network (WSN). The cold chain lasted
 for 16.8 h and consisted of six segments. The dynamic change of temperature, relative humidity, and CO2
 level were real-time monitored and analyzed in detail in each of the six stages. The fruit quality index
 (fruit weight, fruit firmness, and soluble solids concentration (SSC)) were detected and analyzed
 immediately before the first stage (S1) and at the beginning of the last stage (S6). The results show
 that without good temperature control fruit softening is the most significant problem, even in a short
 chain; the WSN node can provide complete and accurate temperature, humidity, and gas monitoring
 information for cold chains, and can be used to further improve quality and safety assurance for
 peach fruit cold chains.

 Keywords: fresh peaches and nectarines; gas monitoring; variance analysis; wireless sensor network;
 cold chain

1. Introduction
      Fresh peaches and nectarines are fruits that are appreciated worldwide by consumers for their juicy
texture, high nutrient content, and pleasant flavor [1,2]. As a kind of climacteric fruits, peaches and
nectarines have relatively short lives when compared with other fruits, such as apples, due to fast
softening, physiological disorders, and overall deterioration of quality, which significantly decrease
their marketing period [3–6]. The fruit cold chain aims to reduce the quality loss and safety hazards of
fruit by the use of artificial refrigeration technology. In that way, peaches and nectarines are stored
in a low temperature environment at all times when they are in various stages, such as processing,
storage, transportation, sale, etc. [7–9].
      With limited land resources and an ever-growing population, the food supply chain is faced
with the challenge of increasing the handling efficiency and minimizing post-harvest food losses.

Appl. Sci. 2017, 7, 133; doi:10.3390/app7020133                                  www.mdpi.com/journal/applsci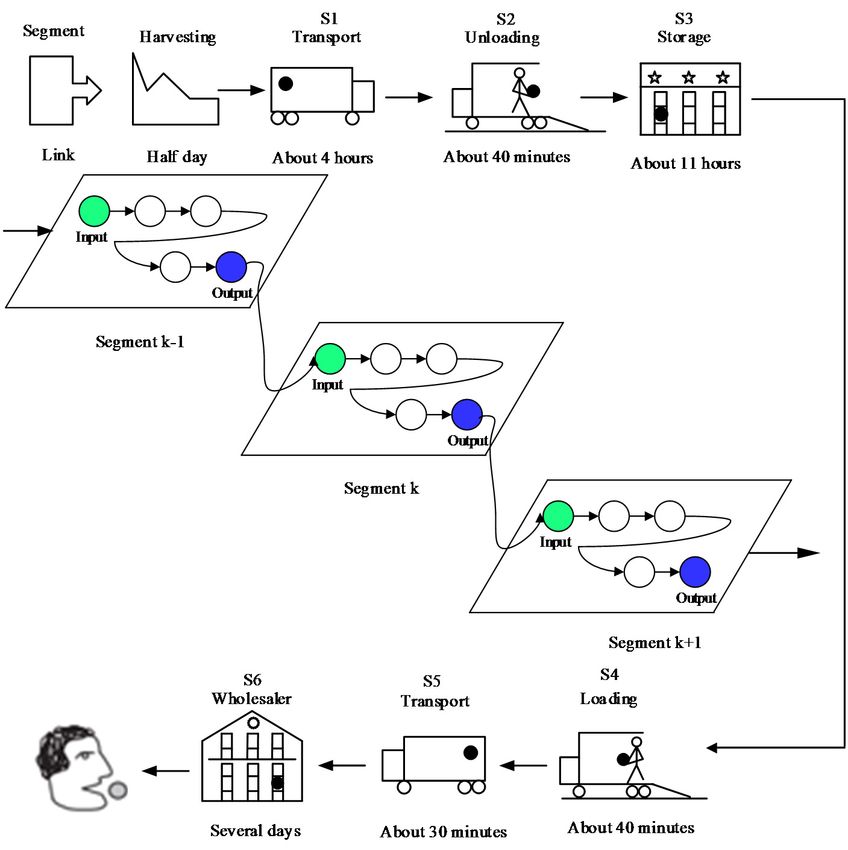
Appl. Sci. 2017, 7, 133                                                                                2 of 13

Those challenges can be resolved by intelligent food logistics technology, including sensor technology
to monitor the logistic conditions, radio frequency identification (RFID) and GPS technology to improve
transport modalities, new warehouse management approaches, shelf life models, or the combination of
one or more of these aspects [10,11]. The importance of these aspects is of crucial importance in highly
perishable fruits such as peaches and nectarines. The peach and nectarine cold chain is complex with
high information discrepancy. Different possible combinations of temperature, relative humidity, CO2 ,
O2 , and ethylene concentrations occurring in cold chain may significantly affect fruit perishability,
metabolic changes, and cause unpredictable variability in fruit quality, such as the loss of fruit
firmness, and the onset of physiological disorders and decay [12–15]. Therefore, it is urgent to analyze
the dynamic characteristics of peaches and nectarines in cold chain environments by intelligent
monitoring technology, and to improve the traceability and transparency of the peaches and nectarines
in cold chain and guarantee the quality and safety of the fruits.
      Though there are many environmental factors that affect the quality and safety of peach and
nectarine cold chains, temperature, relative humidity, and CO2 level are considered to be the main
factors [16–19]. Among them, temperature is the key factor [10] that directly affects the respiration
rate of the peaches and nectarines and the antioxidative activity of the fruits. Suitable temperature
management is an effective technology for slowing this ripening and reducing decay development
after harvest [20,21]. Humidity levels that are higher than an optimum value promote the growth of
microorganisms and result in abnormal splitting of peaches and nectarines, and humidity levels that
are lower than the optimum value can result in wilting, brown rot, and the decrease of firmness of
fruits, as well as damage to the appearance of fruit tissue [22,23]. CO2 and O2 concentrations strongly
affect fruit metabolism and fruit shelf life [10], therefore concentration levels must be monitored to
avoid postharvest losses. Peaches and nectarines are characterized by exhibiting a sharp rise in CO2
and ethylene production at the onset of ripening accompanied with the increase of respiration rate,
which leads to dramatic changes in fruit quality [24,25]. It is critical to monitor these factors in real time
in order to adjust the temperature, relative humidity, and CO2 at optimal levels during the cold chain.
      One of the best solutions and an inevitable trend for enabling real time cold chain monitoring is
the implementation of the Wireless Sensor Network (WSN), which is considered to be a cost-effective sensor
and communications technology with low energy consumption and advanced networking capabilities
for monitoring objects and transmitting information to the end-user via a wireless and multi-hop
network [26–30]. The sensed information can accurately reflect what happens in the fresh fruit cold chain
by providing suppliers and distributors with continuous and accurate readings throughout the distribution
process. Supply chain monitoring system is based on a smart logistic unit (SLU) which was originally built
for strawberries [26,31] and showed good potential for achieving food safety and shelf life together with
logistic efficiency and system sustainability. The data acquired with SLU can be used for implementing
a first-expired-first-out (FEFO) management strategy in order to optimize shelf life of the product in terms
of market distance and product shelf life potential. Although currently applied in many cases, the FIFO
management strategy has numerous disadvantages [10], but the most important are unpredictable shelf
life potential and high possibility of postharvest loss.
      This study aims to monitor the temperature, relative humidity and CO2 level and the quality
of peach and nectarine cold chain by multi-sensors technology (WSN) in real time in order to
improve the transparency and traceability of the cold chain. The cold chain process, variance analysis,
and the evaluation of quality parameters (firmness, soluble solids concentration (SSC), and weight
loss) were considered and implemented in the study methods.

2. Materials and Methods

2.1. Plant Material
     Peaches (cv. Sugar Top) and nectarines (cv. Big Bang Rebus 036) were grown in an orchard
near Kašić, Croatia (44◦ 080 59” N, 15◦ 280 22” E). The trees were four years old and grown in spindle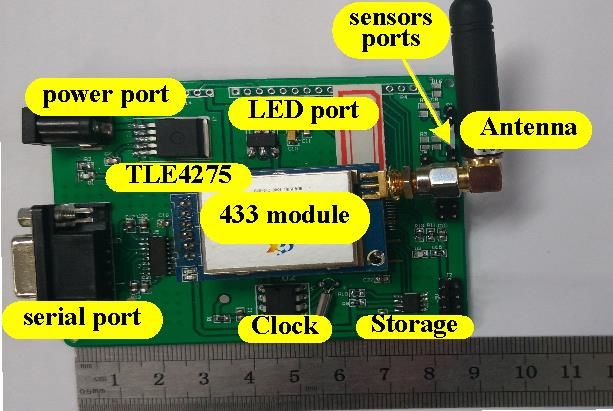
Appl. Sci. 2017, 7, 133 3 of 13
bush training form. All orchard management practices were applied regularly. The postharvest fruit
quality is also affected by various preharvest factors, such us cultivar, climate, orchard management
practices [32], and netting [33–35].
Photoselective netting is an innovative technology, by which chromatic elements are incorporated
into netting materials in order to gain specific physiological and horticultural benefits, in addition
to the initial protective purpose of each type of net (shade-, anti-hail-, wind-, insect-proof, etc.) [34].
Red nets absorb UV and B regions of light spectra and allow red and far-red parts of light spectra
(i.e., wavelengths of 580 nm and up) to pass. This light modification, together with increased scattering
and diffused light effect, causes photosynthetic and photomorphogenic processes [34,35] which can
significantly affect plant vigor and fruit maturation in various horticultural crops.
Two samples of fruits were harvested. One sample was harvested from trees grown under Agritenax
photoselective red anti-hail nets produced by Tenax S.r.l. (Italy) (mesh size 2.4 mm × 4.8 mm). Tree netting
was performed immediately after full bloom and the trees remained covered during the whole
vegetation period. The second sample was harvested from trees that were not covered with
photoselective nets, which served as control.
2.2. Experimental Scheme
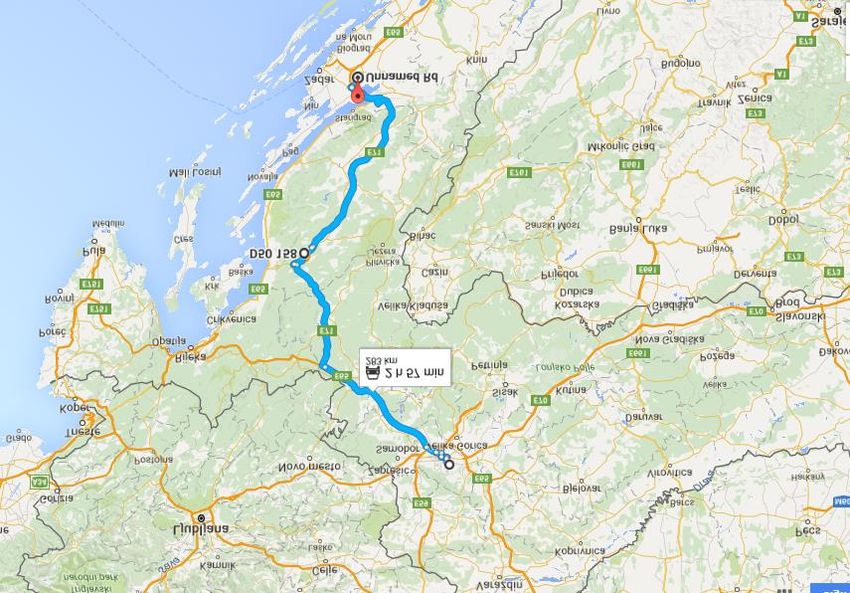
The cold chain was simulated by harvesting fruits into open cardboard boxes, and their loading
into vehicles, transportation, and cold storage. The fruits were transported 283 km from the orchard
to Zagreb, Croatia by the route presented in Figure 1. During the transport and in subsequent cold
storage, real-time monitoring of temperature, relative humidity, CO2 , and GPS for experimental fruit
was performed by WSN.
3 h 57 min
283 km
1
2 Fig. 1 The transport route used in the experiment
Figure 1. The transport route used in the experiment.
Firmness, weight loss, total soluble solids (TSS), titratable acid (TA), and sensory properties
Antenna
are important factors of fruit quality and they play significant roles in consumer preferences,
11.0592MHz Crystal
thus having a prominent role in fruit quality assessment during storage [36–38]. Weight loss (WL),
433 RF LCD1602
Microcontroller Storage chip
Sensors
( TEMP CO2 O2 SO2)
CLock chip
Power Supply
Appl. Sci. 2017, 7, 133 4 of 13
SSC, and firmness are the easiest quality indicator among these quality indicators to measure using
a handheld penetrometer during the cold chain logistics, while the others need special instruments or
environments. Therefore, it is practicable and important to select WL, SSC, and firmness to evaluate
the quality of peaches and nectarines in actual cold chain logistics.
Fruit weight was determined on the same subsamples using analytical balance before transport
(the
Appl. initial weight,
Sci. 2017, 7, 133 IW) and after cold storage (the final fruit weight, FW). Weight loss was calculated 4 of 12
from the difference (IW−FW) and expressed as the percent reduction of IW. Fruit firmness and juice
soluble solids
solids concentration
concentration(SSC)
(SSC)were
weremeasured
measured using
usingtenten
pieces of fruit
pieces from
of fruit eacheach
from subsample (i.e.,
subsample
the fruit
(i.e., grown
the fruit grownunder red net
under redand
net the
andcontrol fruit)fruit)
the control immediately before
immediately the transport
before and again
the transport after
and again
the cold
after the storage. Fruit firmness
cold storage. was determined
Fruit firmness with anwith
was determined Effegianpenetrometer (model FT
Effegi penetrometer 327, Milano,
(model FT 327,
Italy) fitted
Milano, with
Italy) a 7.9-mm
fitted with a diameter plunger. plunger.
7.9-mm diameter Measurements were taken
Measurements at four
were taken equatorial positions
at four equatorial
on each fruit
positions at 90°.fruit
on each ◦
SSCatvalues of the
90 . SSC juice were
values of themeasured
juice were in measured
each fruit with
in eacha digital refractometer
fruit with a digital
(Atago, PAL-2,
refractometer Tokyo,PAL-2,
(Atago, Japan).Tokyo, Japan).
2.3. WSN Nodes
The WSN nodes nodes consisted of a number
number of slaveslave sensor
sensor nodes
nodes (SSNs)
(SSNs) and aa master
master sensor
sensor node
node
(MSN),
(MSN), which
which applied
applied 433433 MHz
MHz as the radio frequency to increase the transmission performance and
form
form a wireless sensor network. Each SSN included a microcontroller,microcontroller, a 433 module with the antenna,
sensors, aa EEPROM
EEPROM(Electrically
(ElectricallyErasable
ErasableProgrammable
Programmable Read-Only
Read-Only Memory)
Memory) chip,chip, a clock
a clock chip,chip,
and
and a battery
a battery powerpower supply.
supply. The The
MSNMSN was was an integration
an integration of a of a microcontroller,
microcontroller, a 433a 433 module
module withwith
the
the antenna,
antenna, a GPRS
a GPRS (General
(General Packet
Packet RadioRadio Service)
Service) module,
module, andand a battery
a battery power
power supply.
supply.
The
The physical
physical implementation
implementation of of the
the WSN
WSN nodes
nodes is demonstrated
demonstrated in Figure 2a,b. STC12LE5A60S2
(STC
(STC micro
micro TM,
TM, Shanghai,
Shanghai, China) was used as the microcontroller to improve processing speed,
maintain low-power usage, and improve the capacity of disturbance resistance, in order to realize realize
system
system functionality
functionalityofofthe theSSN
SSNandandthetheMSN.MSN.Having
Havinga CC1110
a CC1110as the corecore
as the chipchip
of the
of433
themodule with
433 module
the
withantenna presented
the antenna many advantages
presented over traditional
many advantages wire transmission
over traditional due to its low
wire transmission maintenance
due to its low
cost, low power
maintenance consumption,
cost, low power high mobility, and
consumption, highhigh transmission
mobility, and highperformance.
transmission A GPRS module in
performance. A
the
GPRSMSN via theinRS232
module bus, was
the MSN usedRS232
via the to communicate between
bus, was used the MSN in the
to communicate vehiclethe
between andMSN
the remote
in the
server.
vehicle An
andEEPROM
the remotechip wasAn
server. used to save chip
EEPROM sensor
wasinformation
used to save when
sensorsignals were cut
information off in
when long
signals
international transport. A clock chip was used to control the time when data
were cut off in long international transport. A clock chip was used to control the time when datacollected was saved and
produced a timing
collected was savedpulse to wake up
and produced the CPU
a timing (Central
pulse to wake Processing
up the CPU Unit). The Processing
(Central use of LCD1602
Unit).was
The
optional, but it could
use of LCD1602 wasbe used to but
optional, display information
it could be usedwhen the sensor
to display nodes were
information whentested. Sensorsnodes
the sensor were
used
were together with the
tested. Sensors realused
were timetogether
remote monitoring
with the realterminal in order
time remote to monitor
monitoring the temperature,
terminal in order to
humidity,
monitor the COtemperature,
2 , O2 , and ethylene
humidity,levels
COperiodically.
2, O2, and ethylene levels periodically.
(a) (b)
Figure 2.
Figure 2. The
The physical
physical implementation
implementationofofthe
theWSN
WSN(wireless
(wirelesssensor
sensornetwork)
network) nodes.
nodes. (a)(a)
TheThe flow
flow chart
chart of slave sensor node; (b) Hardware of master sensor
of slave sensor node; (b) Hardware of master sensor node. node
Based on the field study and the existing literature review, sensor requirements are specified in
Based on the field study and the existing literature review, sensor requirements are specified in
Table 1. The temperature, relative humidity, CO2, and GPS data in the peach and nectarine cold chain
Table 1. The temperature, relative humidity, CO2 , and GPS data in the peach and nectarine cold chain
logistics were acquired and monitored by adopting the digital temperature and relative humidity
logistics were acquired and monitored by adopting the digital temperature and relative humidity
sensor AM2322 (AOSONG, Guangzhou, China), CO2 sensor ATI (analytical technology incorporated,
sensor AM2322 (AOSONG, Guangzhou, China), CO2 sensor ATI (analytical technology incorporated,
New York, NY, USA), and U-BLOX M8030 (u-blox, Thalwil, Zürich, Switzerland). The range of
temperature, relative humidity, and CO2 were from −40 °C to +80 °C, 0% to 99.9%, and 0%–5%,
respectively, and the accuracy was ±0.3 °C, ±2.0%, and ±0.1%, respectively. The temperature,
humidity, and CO2 sensors were not used in the fruit cold chain until they were calibrated. The supply
voltage of the slave sensor node was supplied by a lithium battery (aigo, Beijing, China), whose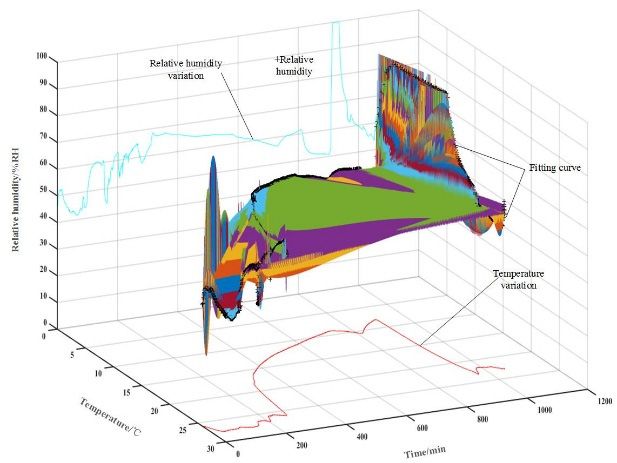
Appl. Sci. 2017, 7, 133                                                                                         5 of 13

New York, NY, USA), and U-BLOX M8030 (u-blox, Thalwil, Zürich, Switzerland). The range of
temperature, relative humidity, and CO2 were from −40 ◦ C to +80 ◦ C, 0% to 99.9%, and 0%–5%,
respectively, and the accuracy was ±0.3 ◦ C, ±2.0%, and ±0.1%, respectively. The temperature,
humidity, and CO2 sensors were not used in the fruit cold chain until they were calibrated. The supply
voltage of the slave sensor node was supplied by a lithium battery (aigo, Beijing, China), whose nominal
voltage and capacity was 5 V and 8000 mAh, respectively, while the master sensor node was equipped
with a 5 V, 2 A power adapter to provide a continuous supply.

                          Table 1. Monitoring parameters for peach and nectarine cold-chain.

        Parameter           Temperature Range    Humidity Range     Volume of CO2              GPS Module
     Theoretical range        −2 ◦ C–36 ◦ C         50%–95%            0%–5%          Maximum height: 50,000 m
      Sensor module             AM2322               AM2322             ATI                  U-BLOX M8030
       Sensor range           −40 ◦ C–80 ◦ C        0%–99.9%           0%–5%                    WGS-84
                                                                                         Speed error < 0.1 m/s,
     Sensor accuracy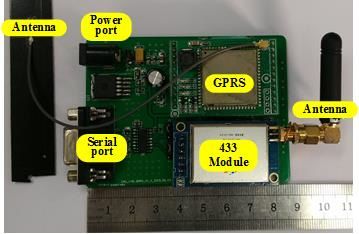
Appl. Sci. 2017, 7, 133                                                                               6 of 13

4      S6: Display and sale (several days). The fruit were simulated as being displayed and sold
       by wholesalers or retailers. The temperature, relative humidity, and CO2 level varied with
       the ambient temperature.

     The information flow from segment k − 1 to segment k + 1 is also showed in Figure 3. The output
of segment k − 1 is the input of segment k. The output of segment k is not only significantly affected
by temperature, relative humidity, and CO2 level, but is also affected by the input of the segment.
As such, the dynamic changes of temperature, relative humidity, and CO2 level need to be real-time
monitored and analyzed in detail in each of the six stages.

                   Figure
                Figure    3. Process
                       3. Process andand information flow
                                       information   flow of
                                                          of the
                                                              thepeach
                                                                  peachand
                                                                        andnectarine cold
                                                                             nectarine    chain.
                                                                                        cold chain.

3.2. Environmental Fluctuation Analysis for Cold Chain

3.2.1. Temperature Change along with Time
      The temperature fluctuation for the fresh peach and nectarine cold chain is described in
Figure 4. The black shadowed area is the projection of the three-dimensional curve, which stands for
the temperature variation with the change of time. The segment S1 represents the normal transportation
stage after the fresh fruit were harvested in the orchard. The temperature in the segment S1, which mainly
varied with the ambient temperature, ranged from about 25.8 ◦ C to 27.7 ◦ C. The temperature slowly rose
because of the influence of the ambient temperature and the energy released by the respiration of fresh
fruit. The segment S2 represents the process of unloading the fruit, and the temperature ranged from
26.5 ◦ C to 27.60 ◦ C. The quality management of fresh fruit cold chain demanded a quick fruit unloading.
Appl. Sci. 2017, 7, 133 7 of 13
The segment S3 represents the cold storage of fresh fruit at 4 ◦ C refrigeration temperature; at this point
the temperature was quickly reduced from 26.08 ◦ C to 9.4 ◦ C. There was a small decrease in temperature
in the loading segment, represented by S4. The temperature in the segment S5 started to rise slowly,
while the fresh fruit were transported to the market. During the S6, the temperature rose rapidly from
8 ◦ C to the ambient temperature of 23.3 ◦ C.
Transportation
Unloading
Cold storage Display and sale
Temperature
variation
Loading Transportation
D
B E F G
C D
A B E
F
C
Appl. Sci. 2017, 7, 133 7 of 12
3.2.2. Relative Humidity Change
Figure 4. The over Time
temperature fluctuation in the fresh peach and nectarine cold chain.
The relative
3.2.2. Relative humidity and temperature
Humidity Change over Time fluctuation in the fresh fruit cold chain is illustrated in
Figure 5. The green curve is the relative humidity variation over time, and the red curve is the
The relative humidity and temperature fluctuation in the fresh fruit cold chain is illustrated
temperature variation over time. During the segment S1, the relative humidity slowly decreased in
in Figure 5. The green curve is the relative humidity variation over time, and the red curve is
the beginning and then increased as a consequence of the temperature change and energy released
the‘temperature variation over time. During the segment S1, the relative humidity slowly decreased in
by the
therespiration
beginning andof fresh peaches. as
then increased The relative humidity
a consequence rapidly rosechange
of the temperature from and
44.40%
energyto 60.8%
releasedin the
transportation segmentofS2.
by the respiration Thepeaches.
fresh relativeThehumidity
relativeofhumidity
segmentrapidly
S3 hadrosea small
fromfluctuation in the in
44.40% to 60.8% initial
stagethe
and then declined
transportation slowly
segment S2.as
Thethe temperature
relative humiditydeclined.
of segment InS3the segment
had S4, the relative
a small fluctuation humidity
in the initial
decreased
stage and then declined slowly as the temperature declined. In the segment S4, the relative humidity of
continuously. The change of the relative humidity was the same as the change
temperature
decreasedin the loadingThe
continuously. segment
change of S5the
and S6. The
relative results
humidity was show thatasthe
the same thesystem
change ofworked well and
temperature
in the loading segment S5 and S6. The results show that the system worked well and
largely reflects the temperature and humidity information of fresh peaches cold chain logistics, which largely reflects
the temperature
is consistent and literature
with other humidity information
[39]. of fresh peaches cold chain logistics, which is consistent
with other literature [39].
Figure
Figure 5. The
5. The relative
relative humidityand
humidity andtemperature
temperature fluctuation
fluctuationininthe fresh
the fruit
fresh coldcold
fruit chain.
chain.
Absolute humidity is the water content of air at a given temperature expressed in grams per
cubic meter, which is calculated by the equation of state of a hypothetical ideal gas and the relative
humidity. It does not take temperature into consideration. The absolute humidity and temperatureAppl. Sci. 2017, 7, 133 8 of 13
Figure 5. The relative humidity and temperature fluctuation in the fresh fruit cold chain.
Absolute humidity
humidityisisthe thewater
watercontent
contentof of
airair
at aatgiven
a given temperature
temperature expressed
expressed in grams
in grams per
per cubic
cubic
meter,meter,
which which is calculated
is calculated by the equation
by the equation of state of astate of a hypothetical
hypothetical ideal gasideal gasrelative
and the and thehumidity.
relative
humidity.
It does not Ittake
does not take temperature
temperature into consideration.
into consideration. The absoluteThe absolute
humidity andhumidity andfluctuation
temperature temperaturein
fluctuation
the fresh fruitin cold
the fresh
chainfruit cold chain
is showed is showed
in Figure 6. Thein Figure
curve 6. The
trend curve trend
of absolute of absolute
humidity humidity
and temperature
and temperature
appear almost theappear
same in almost the
the S3, S4,same in the
S5, and S6 S3, S4, S5, and S6 segments.
segments.
18 30
Absolute humidity Temperature
16
25
14
Absolute humidity/mg*L-1
Temperature/℃
12 20
S5
10
S6 15
S1 S4
8
S2
6 10
S3
4
5
2
0 0
0
30
60
90
120
150
180
210
240
270
300
330
360
390
420
450
480
510
540
570
600
630
660
690
720
750
780
810
840
870
900
930
960
990
1020
1050
Time/min
Figure
Figure 6.
6. The
The absolute
absolute humidity
humidity and
and temperature
temperature fluctuation in the fresh fruit cold chain.
3.2.3. CO22 Level
Level Change
Change with
with Temperature
Temperature and Relative Humidity Fluctuation
The CO22 level
level change
change withwith temperature
temperature and and relative
relative humidity
humidity fluctuation
fluctuation in in the peach and
nectarine
nectarine cold
cold chain
chain isispresented
presentedininFigure
Figure7.7.TheThecurve
curveof of
thethe
COCO
2 level
2 is
level very
is complex
very withwith
complex the
energy released by the life activities of fresh fruits and mutual influence of temperature and
the energy released by the life activities of fresh fruits and mutual influence of temperature and relative relative
humidity. The curve of CO22 level and the CO22 level level per
per kg
kg and
and volume
volume of of fruit over time is showed
in Figure 8. As the volume of headspace for peach and nectarine
headspace for peach and nectarine in in the loading,
loading, unloading
unloading process,
process,
and display and sale process is difficult to quantitatively estimate, the CO22 level per kg and volume
of fruit over time in these processes are not calculated. Moreover, the curve trend of CO22 level and
the CO2 level per kg and volume of fruit over time are the same in the segment S1, S3, and S5 (among
them, 0.06% CO2 is equal to the CO2 level of 600 ppm).
Figure
Figure 7.
7. The
The CO
CO22 level
levelchange
changewith
withtemperature
temperature and
and relative
relative humidity
humidity fluctuation
fluctuation for
for the
the peach
peach and
and
nectarine cold chain.
nectarine cold chain.Figure 7. The CO2 level change with temperature and relative humidity fluctuation for the peach and
Appl. Sci. 2017, 7, 133 9 of 13
nectarine cold chain.
0.4 0.35
CO2 per kg and volume of fruit CO2
CO2 per kg and volume of fruit\ppm*kg-1*L-1
0.35 0.3
0.3 8:00 am
0.25
concentration of CO2/%
S5
0.25
S4
0.2
7:00 am
0.2
23:15 pm S3
S6 0.15
0.15
10:00 am
22:35 pm
0.1
0.1 S2S2
0.05 0.05
S1
0 0
0
30
60
90
120
150
180
210
240
270
300
330
360
390
420
450
480
510
540
570
600
630
660
690
720
750
780
810
840
870
900
930
960
990
1020
1050
Time/s
Figure 8.
Figure 8. The
The curve
curve of
of CO
CO22 level
level and
and the
the CO
CO22 level
level per
per kg
kg and
and volume
volume of
of fruit
fruit over
over time.
time.
The CO2 level experienced rapid changes in segment S1 and S2 from about 0.03% to 0.33%, as
The CO2 level experienced rapid changes in segment S1 and S2 from about 0.03% to 0.33%,
the consequence of the influence of the ambient air, temperature, and relative humidity, as well as
as the consequence of the influence of the ambient air, temperature, and relative humidity, as well
the respiration of the fresh fruit. During the storage segment S3, the CO2 level changed following a
as the respiration of the fresh fruit. During the storage segment S3, the CO2 level changed following
ladder-like fluctuation. The CO2 level declined rapidly in segment S4 and S5 from about 0.33% to
a ladder-like fluctuation. The CO2 level declined rapidly in segment S4 and S5 from about 0.33%
0.03%. During segment S6, after a brief delay the CO2 level experienced a sharp decline due to the
to 0.03%. During segment S6, after a brief delay the CO2 level experienced a sharp decline due to
effect of temperature and humidity change, then varied with the ambient air. The monitoring data
the effect of temperature and humidity change, then varied with the ambient air. The monitoring data
results largely reflect the atmosphere of fresh peach and nectarine cold chain logistics, which could
results largely reflect the atmosphere of fresh peach and nectarine cold chain logistics, which could be
be real-time monitored via the sensor nodes installed. The results show that the system could provide
real-time monitored via the sensor nodes installed. The results show that the system could provide
complete and accurate temperature, humidity, and gas monitoring information throughout the cold
complete and accurate temperature, humidity, and gas monitoring information throughout the cold
chain, and was thereby able to provide more effective safety and quality assurance for fresh fruit in
chain, and was thereby able to provide more effective safety and quality assurance for fresh fruit in
the cold chain.
the cold chain.
3.2.4.
3.2.4. Accuracy
Accuracy Evaluation
Evaluation of of Sensor
Sensor Nodes
Nodes
Critical
Critical factors
factors for
for the
the sensor
sensor nodes
nodes include
include packet
packet losses
losses rate,
rate, battery
battery life,
life, and the accuracy
and the accuracy of
of
sensor nodes [31], as can be observed in Table 2. The packet losses rate of radio transmission
sensor nodes [31], as can be observed in Table 2. The packet losses rate of radio transmission was was
below
below 0.2%
0.2% in the peach
in the peach and
and nectarine
nectarine cold
cold chain
chain from
from Kašić
Kašić to
to Zagreb,
Zagreb, Croatia.
Croatia. The
The node
node power
power
management
management circuit ensured the nodes’ stable operation up until a total voltage drop to 3 V to
circuit ensured the nodes’ stable operation up until a total voltage drop (0%3 battery
V (0%
battery charge). The battery charge status varied from 80% to 90% after approximately
charge). The battery charge status varied from 80% to 90% after approximately one day. one day.
Table 2. The
Table 2. accuracy evaluation
The accuracy evaluation of
of sensor
sensor nodes.
nodes.
Species Packet Losses Rate Accuracy Error Battery Charge Status
Species Packet Losses Rate Accuracy
Temperature: ErrorAppl. Sci. 2017, 7, 133 10 of 13
3.3.2. The Firmness Change of Peaches and Nectarines
The firmness of nectarines and peaches fruit largely decreased during the experimental chain.
There were large differences in the fruit softening rates between peaches and nectarines, as well
between fruits grown under red net as compared to control fruit. Moreover, the firmness decline
rate for nectarines from control trees and nectarines grown under red net were 31.2% and 42.6%,
respectively, which is larger than the firmness decline rate of peaches grown under red net (22.07%)
and peaches from control (12.71%) trees. The firmness decline rate of fruit grown under red net is
higher than in control fruits. This is especially pronounced in nectarines whose softening rate for fruits
grown under the red nets was almost double the softening rate of control fruits. In the fresh peach
industry, mechanical properties of the fruit flesh and particularly the softening speed are the most
limiting factors of fruit quality along the commercial chain [3]. The results of this study show that fruit
softening is not only cultivar-dependent [3,41], but is also significantly affected by the red netting since
fruits grown under red net softened more rapidly than control fruit. Red netting increases firmness in
nectarines [42], which is contrary to the results of our study since no significant differences were found
in fruit firmness as affected by red netting. This might be a consequence of some other environmental
preharvest factors or cultivar differences. Increased CO2 concentration during cold chain (Figure 6)
was always below 5% and could significantly decrease softening [43].
3.3.3. The SSC Change of Peaches and Nectarines
The SSC of nectarines and peaches is largely decreased during the experimental chain. The SSC
decline rate of nectarines grown under red net and nectarines from control were 8.15% and 11.06%,
respectively. The SSC decline rate for nectarines was more than four times higher than in peaches
(2.06% and 2.35%). Regarding the SSC values for nectarines, the decline rate for nectarines grown
under the red net was a little smaller than the SSC decline rate of nectarines from control trees. The SSC
decline rate of peaches grown under the red net was also a little smaller than the SSC decline rate of
peaches from control trees. The quality data results largely reflect the quality change of nectarine and
peach fruit in the short chain [37] and suggest that nectarines are more prone to postharvest quality
deterioration than peaches. Therefore, postharvest cold chain of nectarines must be monitored and
controlled more closely in order to preserve fruit quality.
Table 3. The quality of peaches and nectarines in the experimental fresh peach and nectarine chain.
Average Weight Initial Final Firmness Decline Initial Final SSC Decline
Sample
Loss (%) Firmness Firmness Rate (%) x SSC SSC Rate (%) x
nectarine control 1.86 b 3.59 ab 2.47 ab 31.20 9.23 a 8.21 a 11.06
nectarine red net 2.18 ab 3.85 a 2.21 b 42.60 9.20 a 8.45 a 8.15
peach control 2.43 ab 2.99 bc 2.61 a 12.71 8.50 ab 8.3 a 2.35
peach red net 2.89 a 2.94 c 2.29 ab 22.07 8.27 b 8.1 a 2.06
Note: Values inside column followed by the same letter are not statistically significant according to LSD (Least
Significant Difference) test at p ≤ 0.05 level; X —statistical analysis was not performed.
4. Conclusions
This paper presents the determination and identification of the critical quality parameters for fresh
peaches and nectarines in cold chain logistics implemented by the real-time monitoring of temperature,
relative humidity, and CO2 fluctuation. The implementation comprises the use of the implemented
WSN nodes, and their effect on fresh peach and nectarine fruits, in order to improve the cold chain
management as well as provide the sustainability of fresh peach fruit cold chain logistics.
The environmental fluctuation analysis for cold chain demonstrates the temperature, relative humidity,
and CO2 characteristics in the fresh peaches and nectarine cold chain logistics. The identification of dramatic
changes provides an early warning for the need to take effective measures in advance and resolve any
problems that may cause unexpected quality loss.Appl. Sci. 2017, 7, 133 11 of 13
Several quality parameters for cold chain, such as weight loss, firmness, and SSC can be used
to describe the quality change of fresh peaches and provide a comprehensive assessment of fruit
quality in general. In this study, the weight of the peaches and nectarines, as well as their firmness
and SSC, was largely decreased during the short chain. The quality data suggest that nectarine fruit is
more prone to postharvest quality deterioration than peach fruit. Therefore, postharvest cold chain of
nectarines must be more precisely monitored and controlled to preserve fruit quality.
The results of this study provide some theoretical basis for the assessment of the fresh peach fruit
quality in cold chain logistics, which can be used by producers and distributors in the further planning
of their cold chain logistics in order to maintain a good economic value of their products.
Acknowledgments: This work was supported by DBN Young Scholars Research Program and the National
Key Research and Development Program of China (2016YFD0400901). This experiment was done in Croatia
during a visit by the first author that was supported by the Chinese-Croatian bilateral Scientific and Technological
Cooperation Programme (7-1).
Author Contributions: Xiaoshuan Zhang and Tomislav Jemrić conceived and designed the experiments,
they made the same contributions. Xiang Wang and Tomislav Jemrić performed the experiments. Xiang Wang and
Huijuan Zhou analyzed the data. Maja Matetić contributed materials/analysis tools. Xiang Wang wrote the paper.
Xiaoshuan Zhang, Tomislav Jemrić and Maja Matetić contributed to the paper’s modification and refinement.
Conflicts of Interest: The authors declare no conflict of interest.
Practical Applications: The proposed method could be adapted into other fruits postharvest quality monitoring
and traceability applications.
References
1. Gang, C.; Li, J.; Chen, Y.; Wang, Y.; Li, H.; Pan, B.; Odeh, I. Synergistic Effect of Chemical Treatments on
Storage Quality and Chilling Injury of Honey Peaches. J. Food Process. Preserv. 2015, 39, 1108–1117. [CrossRef]
2. Rizzolo, A.; Bianchi, G.; Vanoli, M.; Lurie, S.; Spinelli, L.; Torricelli, A. Electronic nose to detect volatile
compound profile and quality changes in ‘Spring Belle’ peach (Prunus persica L.) during cold storage in
relation to fruit optical properties measured by time-resolved reflectance spectroscopy. J. Agric. Food Chem.
2013, 61, 1671–1685. [CrossRef] [PubMed]
3. Shinya, P.; Contador, L.; Predieri, S.; Rubio, P.; Infante, R. Peach ripening: Segregation at harvest and
postharvest flesh softening. Postharvest Biol. Technol. 2013, 86, 472–478. [CrossRef]
4. Zhang, L.; Chen, F.; Yang, H.; Sun, X.; Liu, H.; Gong, X.; Jiang, C.; Ding, C. Changes in firmness, pectin content
and nanostructure of two crisp peach cultivars after storage. LWT-Food Sci. Technol. 2010, 43, 26–32.
[CrossRef]
5. Zhang, L.; Chen, F.; Yang, H.; Ye, X.; Sun, X.; Liu, D.; Yang, B.; An, H.; Deng, Y. Effects of temperature
and cultivar on nanostructural changes of water-soluble pectin and chelate-soluble pectin in peaches.
Carbohydr. Polym. 2012, 87, 816–821. [CrossRef]
6. Raffo, A.; Nardo, N.; Tabilio, M.R.; Paoletti, F. Effects of cold storage on aroma compounds of white- and
yellow-fleshed peaches. Eur. Food Res. Technol. 2008, 226, 1503–1512. [CrossRef]
7. Laguerre, O.; Hoang, H.M.; Flick, D. Experimental investigation and modelling in the food cold chain:
Thermal and quality evolution. Trends Food Sci. Technol. 2013, 29, 87–97. [CrossRef]
8. Aung, M.M.; Chang, Y.S. Temperature management for the quality assurance of a perishable food supply
chain. Food Control 2014, 40, 198–207. [CrossRef]
9. Lim, T.-P.; Chye, F.Y.; Sulaiman, M.R.; Suki, N.M.; Lee, J.-S. A structural modeling on food safety knowledge,
attitude, and behaviour among Bum Bum Island community of Semporna, Sabah. Food Control 2016,
60, 241–246. [CrossRef]
10. Hertog, M.L.A.T.M.; Uysal, I.; McCarthy, U.; Verlinden, B.M.; Nicolaï, B.M. Shelf life modelling for
first-expired-first-out warehouse management. Philos. Trans. R. Soc. A Math. Phys. Eng. Sci. 2014, 372, 20130306.
[CrossRef] [PubMed]
11. Sciortino, R.; Micale, R.; Enea, M.; La Scalia, G. A webGIS-based system for real time shelf life prediction.
Comput. Electron. Agric. 2016, 127, 451–459. [CrossRef]Appl. Sci. 2017, 7, 133 12 of 13
12. Li, Y.X.; Wang, G.X.; Liang, L.S. Effect of cold acclimation treatment and exogenous ethylene treatment on
woolliness related enzymes on ‘Okubo’ peach fruits during low temperature storage. Acta Hortic. 2012,
934, 1103–1109. [CrossRef]
13. Infante, R.; Aros, D.; Contador, L.; Rubio, P. Does the maturity at harvest affect quality and sensory attributes
of peaches and nectarines? N. Z. J. Crop Hortic. Sci. 2012, 40, 103–113. [CrossRef]
14. Yang, H.; Chen, F.; An, H.; Lai, S. Comparative studies on nanostructures of three kinds of pectins in
two peach cultivars using atomic force microscopy. Postharvest Biol. Technol. 2009, 51, 391–398. [CrossRef]
15. Girardi, C.L.; Corrent, A.R.; Lucchetta, L.; Zanuzo, M.R.; Da Costa, T.S.; Brackmann, A.; Twyman, R.M.;
Nora, F.R.; Nora, L.; Silva, J.A.; et al. Effect of ethylene, intermittent warming and controlled atmosphere
on postharvest quality and the occurrence of woolliness in peach (Prunus persica cv. Chiripá) during cold
storage. Postharvest Biol. Technol. 2005, 38, 25–33. [CrossRef]
16. Akbudak, B.; Eris, A. Physical and chemical changes in peaches and nectarines during the modified
atmosphere storage. Food Control 2004, 15, 307–313. [CrossRef]
17. Lurie, S.; Crisosto, C.H. Chilling injury in peach and nectarine. Postharvest Biol. Technol. 2005, 37, 195–208.
[CrossRef]
18. Ortiz, A.; Echeverría, G.; Graell, J.; Lara, I. Overall quality of ‘Rich Lady’ peach fruit after air- or CA storage.
The importance of volatile emission. LWT-Food Sci. Technol. 2009, 42, 1520–1529. [CrossRef]
19. Ahmed, M.J.; Singh, Z.; Khan, A.S. Postharvest Aloe vera gel-coating modulates fruit ripening and quality
of ‘Arctic Snow’ nectarine kept in ambient and cold storage. Int. J. Food Sci. Technol. 2009, 44, 1024–1033.
[CrossRef]
20. Jin, P.; Wang, K.; Shang, H.; Tong, J.; Zheng, Y. Low-temperature conditioning combined with methyl
jasmonate treatment reduces chilling injury of peach fruit. J. Sci. Food Agric. 2009, 89, 1690–1696. [CrossRef]
21. Zhang, B.; Xi, W.; Wei, W.; Shen, J.; Ferguson, I.; Chen, K. Changes in aroma-related volatiles and gene
expression during low temperature storage and subsequent shelf-life of peach fruit. Postharvest Biol. Technol.
2011, 60, 7–16. [CrossRef]
22. Zhu, S.; Liu, M.; Zhou, J. Inhibition by nitric oxide of ethylene biosynthesis and lipoxygenase activity in
peach fruit during storage. Postharvest Biol. Technol. 2006, 42, 41–48. [CrossRef]
23. Casals, C.; Teixidó, N.; Viñas, I.; Llauradó, S.; Usall, J. Control of Monilinia spp. on stone fruit by curing
treatments: Part I. The effect of temperature, exposure time and relative humidity on curing efficacy.
Postharvest Biol. Technol. 2010, 56, 19–25. [CrossRef]
24. Ziosi, V.; Noferini, M.; Fiori, G.; Tadiello, A.; Trainotti, L.; Casadoro, G.; Costa, G. A new index based on
vis spectroscopy to characterize the progression of ripening in peach fruit. Postharvest Biol. Technol. 2008,
49, 319–329. [CrossRef]
25. Ortiz, A.; Seymour, G.B.; Tucker, G.A.; Lara, I. Cell wall disassembly during the melting phase of softening
in ‘Snow Queen’ nectarines. Postharvest Biol. Technol. 2010, 58, 88–92. [CrossRef]
26. La Scalia, G.; Nasca, A.; Corona, O.; Settanni, L.; Micale, R. An innovative shelf life model based on smart
logistic unit for an efficient management of the perishable food supply chain. J. Food Process Eng. 2015, 40.
[CrossRef]
27. Xiao, X.; Wang, X.; Zhang, X.; Chen, E.; Li, J. Effect of the Quality Property of Table Grapes in Cold Chain
Logistics-Integrated WSN and AOW. Appl. Sci. 2015, 5, 747–760. [CrossRef]
28. Xiao, X.; He, Q.; Fu, Z.; Xu, M.; Zhang, X. Applying CS and WSN methods for improving efficiency of
frozen and chilled aquatic products monitoring system in cold chain logistics. Food Control 2016, 60, 656–666.
[CrossRef]
29. Wang, J.; Wang, H.; He, J.; Li, L.; Shen, M.; Tan, X.; Min, H.; Zheng, L. Wireless sensor network for real-time
perishable food supply chain management. Comput. Electron. Agric. 2015, 110, 196–207. [CrossRef]
30. Qi, L.; Xu, M.; Fu, Z.; Mira, T.; Zhang, X. C2SLDS: A WSN-based perishable food shelf-life prediction and
LSFO strategy decision support system in cold chain logistics. Food Control 2014, 38, 19–29. [CrossRef]
31. Ruiz-Garcia, L.; Barreiro, P.; Robla, J.I. Performance of ZigBee-Based wireless sensor nodes for real-time
monitoring of fruit logistics. J. Food Eng. 2008, 87, 405–415. [CrossRef]
32. Mahajan, P.V.; Caleb, O.J.; Singh, Z.; Watkins, C.B.; Geyer, M. Postharvest treatments of fresh produce.
Philos. Trans. R. Soc. A Math. Phys. Eng. Sci. 2014, 372, 20130309. [CrossRef] [PubMed]
33. Lee, T.-C.; Zhong, P.-J.; Chang, P.-T. The effects of preharvest shading and postharvest storage temperatures
on the quality of ‘Ponkan’ (Citrus reticulata Blanco) mandarin fruits. Sci. Hortic. 2015, 188, 57–65. [CrossRef]Appl. Sci. 2017, 7, 133 13 of 13
34. Shahak, Y. Photoselective netting: An overview of the concept, R&D and practical implementation in
agriculture. Acta Hortic. 2014, 1015, 155–162.
35. Shahak, Y.; Kong, Y.; Ratner, K. The wonders of yellow netting. Acta Hortic. 2016, 1134, 327–334. [CrossRef]
36. Cano-Salazar, J.; Echeverría, G.; Crisosto, C.H.; Lopez, L. Cold-Storage Potential of Four Yellow-Fleshed Peach
Cultivars Defined by Their Volatile Compounds Emissions, Standard Quality Parameters, and Consumer
Acceptance. J. Agric. Food Chem. 2012, 60, 1266–1282. [CrossRef] [PubMed]
37. Cano-Salazar, J.; López, M.L.; Echeverría, G. Relationships between the instrumental and sensory characteristics
of four peach and nectarine cultivars stored under air and CA atmospheres. Postharvest Biol. Technol. 2013,
75, 58–67. [CrossRef]
38. Ma, C.; Fu, Z.; Xu, M.; Trebar, M.; Zhang, X. Evaluation on home storage performance of table grape based on
sensory quality and consumers’ satisfaction. J. Food Sci. Technol. 2016, 53, 1363–1370. [CrossRef] [PubMed]
39. Aiello, G.; La Scalia, G.; Micale, R. Simulation analysis of cold chain performance based on time–temperature
data. Prod. Plan. Control 2012, 23, 468–476. [CrossRef]
40. Tareen, M.J.; Abbasi, N.A.; Hafiz, I.A. Postharvest application of salicylic acid enhanced antioxidant enzyme
activity and maintained quality of peach cv. ‘Flordaking’ fruit during storage. Sci. Hortic. 2012, 142, 221–228.
[CrossRef]
41. Giné-Bordonaba, J.; Cantín, C.M.; Echeverría, G.; Ubach, D.; Larrigaudière, C. The effect of chilling
injury-inducing storage conditions on quality and consumer acceptance of different Prunus persica cultivars.
Postharvest Biol. Technol. 2016, 115, 38–47. [CrossRef]
42. Giaccone, M.; Forlani, M.; Basile, B. Tree vigor, fruit yield and quality of nectarine trees grown under red
photoselective anti-hail nets in southern Italy. Acta Hortic. 2012, 287–293. [CrossRef]
43. Nanos, G.D.; Mitchell, F.G. Carbon dioxide injury and flesh softening following high-temperature
conditioning in peaches. Hortscience 1991, 26, 562–563.
© 2017 by the authors; licensee MDPI, Basel, Switzerland. This article is an open access
article distributed under the terms and conditions of the Creative Commons Attribution
(CC BY) license (http://creativecommons.org/licenses/by/4.0/).You can also read