Flow Stress Behaviour and Static Recrystallization Characteristics of Hot Deformed Austenite in Microalloyed Medium-Carbon Bainitic Steels - MDPI
←
→
Page content transcription
If your browser does not render page correctly, please read the page content below
metals
Article
Flow Stress Behaviour and Static Recrystallization
Characteristics of Hot Deformed Austenite in Microalloyed
Medium-Carbon Bainitic Steels
Pentti M. Kaikkonen * , Mahesh C. Somani                          , Leo Pentti Karjalainen           and Jukka I. Kömi

                                           Materials and Mechanical Engineering, Centre for Advanced Steels Research, University of Oulu,
                                           90014 Oulun yliopisto, Finland; mahesh.somani@oulu.fi (M.C.S.); pentti.karjalainen@oulu.fi (L.P.K.);
                                           jukka.komi@oulu.fi (J.I.K.)
                                           * Correspondence: pentti.kaikkonen@oulu.fi; Tel.: +358-440-172-490

                                           Abstract: In the past decade, efforts have been focused on developing very fine, medium-carbon
                                           bainitic steels via the low-temperature (typically 300–400 ◦ C) ausforming process, which not only
                                           enables shorter isothermal holding times for bainitic transformation at low temperatures, but also
                                           offers significantly improved strength. This paper describes static recrystallization (SRX) characteris-
                                           tics of austenite in four medium-carbon 2%Mn-1.3%Si-0.7%Cr steels with and without microalloying
                                           intended for the development of these steels. The stress-relaxation method on a Gleeble simula-
                                           tor resulted in recrystallization times over a wide range of temperatures, strains and strain rates.
                                           Also, the occurrence of precipitation was revealed. Powers of strain (−1.7 to −2.7) and strain rate
                                           (−0.21 to −0.28) as well as the apparent activation energies (225–269 kJ/mol) were in the ranges
                                           reported in the literature for C-Mn and microalloyed steels with lower Mn and Si contents. The new
                                           regression equations established for estimating times for 50% SRX revealed the retardation effects

                                           of microalloying and Mo addition showing reasonable fits with the experimental data, whereas the
                                    previous model suggested for ordinary microalloyed steels tended to predict clearly shorter times on
Citation: Kaikkonen, P.M.; Somani,         average than the experimental values for the present coarse-grained steels. The Boratto equation to
M.C.; Karjalainen, L.P.; Kömi, J.I.        estimate the non-recrystallization temperature was successfully modified to include the effect of Mo
Flow Stress Behaviour and Static           alloying and high silicon concentrations.
Recrystallization Characteristics of
Hot Deformed Austenite in                  Keywords: medium-carbon steels; austenite; flow stress; stress relaxation; recrystallization kinet-
Microalloyed Medium-Carbon                 ics; precipitation
Bainitic Steels. Metals 2021, 11, 138.
https://doi.org/10.3390/met11010138

Received: 21 December 2020
                                           1. Introduction
Accepted: 8 January 2021
Published: 12 January 2021
                                                 Nanostructured bainite, also called superbainite, is a novel type of microstructure for
                                           creating modern tool and construction steels exhibiting exceptional durability [1]. Recently,
Publisher’s Note: MDPI stays neu-          efforts have been focused on developing very fine, medium-carbon bainitic steels by
tral with regard to jurisdictional clai-   introducing a low-temperature (typically 300–400 ◦ C) ausforming process, thus facilitating
ms in published maps and institutio-       a very fine nanostructured bainitic structure in the steels [2–5]. Not only does the low
nal affiliations.                          temperature deformation offer improved strength, but it also enables shorter isothermal
                                           holding times for the completion of bainitic transformation at a given temperature. A
                                           careful alloy design is, therefore, necessary as a low martensite start temperature MS must
                                           be obtained. This is possible typically by the addition of austenite stabilizing elements such
Copyright: © 2021 by the authors. Li-
                                           as Mn. Additions of Mo and microalloying elements V and Nb are quite usual in order to
censee MDPI, Basel, Switzerland.
                                           utilize their grain refinement and strengthening effects on the final bainitic microstructure.
This article is an open access article
                                           On the other hand, Si addition in suitable quantities hinders the undesirable formation
distributed under the terms and con-
                                           of carbides during low temperature (typically 300–400 ◦ C) isothermal holding and helps
ditions of the Creative Commons At-
                                           stabilize a fraction of finely divided, carbon-enriched retained austenite (RA) at room
tribution (CC BY) license (https://
creativecommons.org/licenses/by/
                                           temperature (RT) during final cooling. While a nanostructured bainitic matrix has the
4.0/).
                                           potential to provide the required ultrahigh strength, a small fraction of RA finely divided

Metals 2021, 11, 138. https://doi.org/10.3390/met11010138                                                       https://www.mdpi.com/journal/metals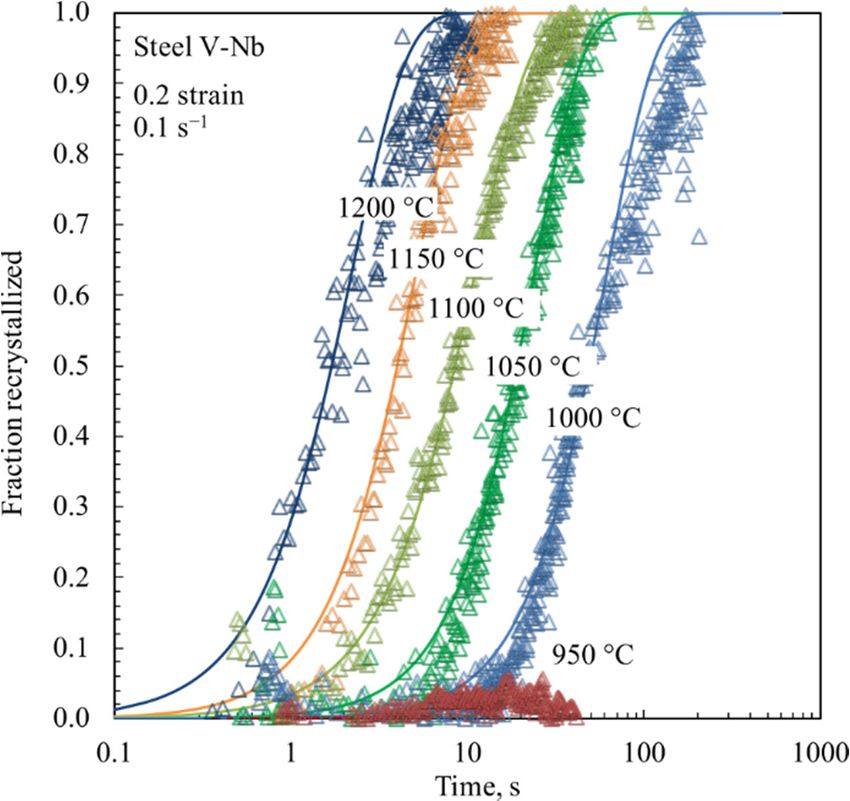
Metals 2021, 11, 138                                                                                              2 of 19

                       between the bainitic laths is expected to provide improved work hardening and uniform
                       elongation without a loss of impact toughness.
                             In addition to the composition design, hot rolling in the recrystallization regime, i.e.,
                       above the no-recrystallization temperature Tnr , is an essential stage in terms of refinement
                       of the austenite grain size prior to low temperature ausforming. Also, the characteristics
                       and kinetics of precipitation in the steels, if any, need to be understood in order to complete
                       the recrystallization process prior to its occurrence. An appropriate control of the hot
                       rolling sequence in accord with the static recrystallization (SRX) characteristics and kinetics
                       is, therefore, inevitably necessary.
                             The SRX kinetics of hot deformed austenite in C-Mn steels (with Mn < 1.5%, Si < 0.25%;
                       hereinafter, all concentrations are in wt.%) as a function of chemical composition including
                       the effects of V, Ti and Nb have been reported by numerous authors, for example, [6–12].
                       Medina and Quispe [13] have published experimental recrystallization-precipitation-time-
                       temperature diagrams for various V and Nb microalloyed steels illustrating the start and
                       finish temperatures of SRX as well as precipitation at different temperatures. Garcia-Mateo
                       et al. [8] reported retardation of SRX kinetics due to the addition of 0.18 and 0.24% V in
                       a C-Mn steel. Furthermore, they pointed out the mechanisms that discretely caused the
                       retardation at low as well as high temperatures; the solute drag effect being the main reason
                       at high temperatures and the presence of fine precipitates at low temperatures. Vervynckt
                       et al. [9] also examined the influence of different levels of Nb-microalloying on the SRX
                       kinetics in low-carbon steels at 900 ◦ C, and according to their study, 0.02% Nb alloying
                       caused delay in the SRX kinetics only due to the solute drag effect, whereas a higher Nb
                       alloying (0.04–0.16% Nb) resulted in both precipitation as well as the solute drag effect,
                       respectively. The hindering effect of V and Nb on SRX kinetics in low alloy steels was
                       also reported by Esterl et al. [10]. Pereda et al. [11] concluded that increasing Mo content
                       in 0.05C-Nb steels increased the Tnr essentially due to an enhanced solute drag effect in
                       steels with low Nb content (0.03% Nb), whereas in steels with relatively higher Nb content
                       (0.06% Nb), the acceleration of strain induced precipitation became more relevant than the
                       solute drag.
                             In general, the time for 50% SRX fraction (t50 ) can be described by the following
                       empirical relation [14,15]:
                                                        t50 = A εp ε’q ds exp(Qapp /RT)                            (1)
                       where A, p, q and s are material dependent constants, ε is strain, ε’ is strain rate, d is initial
                       grain size and Qapp is the apparent activation energy of static recrystallization. R is the
                       universal gas constant and T is the absolute temperature. Generally, the double-hit defor-
                       mation technique has been used for determining the powers of the variables in Equation (1)
                       after compression or torsion deformation, for example, [16–20]. However, stress relaxation
                       testing has been shown to be a very effective and reliable technique in determining the
                       SRX and metadynamic recrystallization (MDRX) kinetics, because a single stress relax-
                       ation experiment can provide a complete restoration curve describing the recrystallized
                       fraction versus holding time for a given set of conditions [16,17]. Also, the recovery and
                       recrystallization processes can be distinguished [16]. Somani et al. [18,21–23] developed a
                       comprehensive regression model to predict the kinetics of SRX for hot-deformed austenite
                       based on the stress relaxation test results for over 40 different carbon steels. The model
                       is able to satisfactorily predict the SRX kinetics of common carbon steel grades includ-
                       ing microalloyed steels and also several special steel grades. During the development
                       of this model, the influence of alloying with Mn in the range 0.02–2% and Si up to 1.5%
                       alloying was also considered by including the instances of a couple of dual-phase and
                       transformation induced plasticity (TRIP) steels. Although a large number of steels were
                       found to obey a simple relationship, certain alloying elements such as Si, resulted in
                       differences and an upper saturation limit had been successfully considered [18,24]. The
                       maximum concentration of Nb too seemed to be limited to fit the common relationship and
                       likewise, an upper saturation limit was considered [18]. Recently, the effects of Si and Mn
                       on recrystallization characteristics of high-Si steels have also been investigated [25].
Metals 2021, 11, 138                                                                                                              3 of 19

                                        In V, Ti and Nb-microalloyed steels, strain-induced precipitation tends to occur at low
                                  rolling temperatures close to Tnr , and a drop in stress with time, normally seen during
                                  relaxation, may halt or even increase for some duration, so that the relaxation testing
                                  technique can also be used to determine the start (Ps ) and finishing time (Pf ) of precipitation
                                  corresponding to the stop and restart of relaxation process, respectively [6,26–29]. The
                                  occurrence of precipitation in various steels, microalloyed with Ti and Ti-V [12], as well as
                                  V, Ti, Nb [6,26,29–32], have been investigated by the stress relaxation technique.
                                        Optimization of the thermomechanical processing can be done with the aid of physical
                                  simulation studies. In the present work, the chosen approach was to design the appropriate
                                  processing conditions for select medium-carbon compositions considered suitable for
                                  low-temperature ausforming and subsequent fine-grained bainite formation. However,
                                  determining the SRX behaviour of these steels was the main target of the present study in
                                  order to be able to finetune the hot rolling processes prior to cooling and low temperature
                                  ausforming. The aim is to understand the effects of supplementary additions of V and Mo
                                  on the SRX characteristics and kinetics of Nb-microalloyed, medium carbon steels with
                                  high-Mn/Si ((0.4–0.5)C-2Mn-1.3Si). Notably, many regression equations describing the
                                  effects of microalloying on the SRX rates already exist in the literature for conventional low-
                                  carbon steels, as mentioned above and also listed by Lenard et al. [33]. Owing to significant
                                  scatter in predictions using these equations, this study further aims to re-examine the
                                  potential roles of V-Nb and Mo-Nb alloying in medium-carbon steels with high Mn and
                                  Si contents, particularly in the light of the previous model developed at the authors’
                                  laboratory [18,21–23]. The well-known equations from Barbosa et al. [34] and Bai et al. [35]
                                  for estimating Tnr were realised to give unreliable results for the present steels, so this
                                  study also proposes a modification of the equation, to include the effect of Mo.

                                  2. Materials and Methods
                                       Four medium-carbon 2Mn-1.3Si steels designed for achieving nanostructured bainite,
                                  coded Mn-Si, Mo-Nb, V-Nb and C-V-Nb with varying C, Mo, V and Nb alloying, were
                                  the experimental materials in this study for the characterization of flow stress and SRX
                                  behaviours. All steels were received in the form of homogenized and hot rolled 12 mm
                                  thick plates from OCAS, Ghent, Belgium. The chemical compositions of the steels are
                                  shown in Table 1. The prior austenite grain sizes (PAGS) of the steels, measured using the
                                  linear intercept method according to ASTM E112-12 standard on specimens austenitized at
                                  the reheating temperature 1250 ◦ C for 2 min, followed by quenching with water spray to
                                  room temperature (RT) and etched in 2% Nital solution, are also included in Table 1.

               Table 1. Chemical compositions of the steels in wt.-% (Fe balance) and prior austenite grain sizes (PAGS).

  Steel Code            C          Si          Mn               Cr             Mo               V          Nb          PAGS (µm)
     Mn-Si             0.39        1.4          2.0            0.7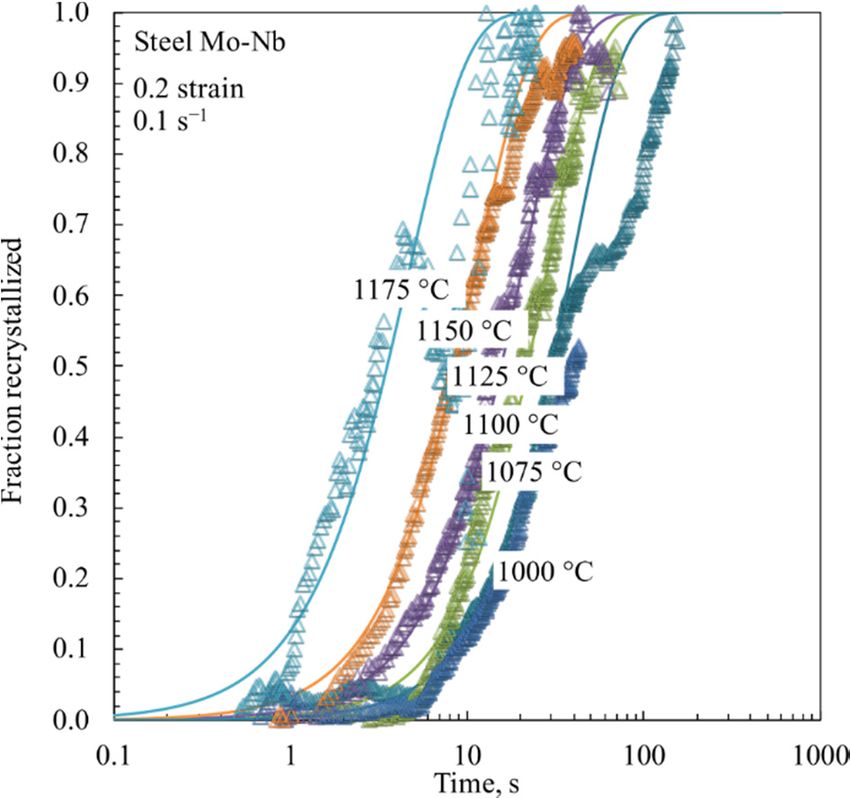
The specimens were heated at a constant rate of 10 °C/s to the reheating temperature
of 1250 °C, held for 2 min, followed by cooling at 2 °C/s to the deformation temperature,
Metals 2021, 11, 138 where the specimens were first held for 15 s to stabilize the temperature prior to4compres- of 19
sion and stress relaxation. Subsequently, the samples were compressed to a prescribed
strain at a particular strain rate, followed by stress relaxation for 200–600 s in the stroke
mode, where
strain the compressive
at a particular force
strain rate, was relaxed
followed byrelaxation
by stress keeping for
the200–600
strain constant during the
s in the stroke
course
mode, ofwhere
holding. However, aforce
the compressive verywas
small strain
relaxed byrate of about
keeping 0.0003
the strain s−1 had
constant to bethe
during applied
course of holding. However, a very small strain rate of about 0.0003 s −1 had to be applied
during holding in order to maintain electrical contact between the specimen and the an-
during
vils. holding
The stress in order
was to maintain
recorded electricalof
as a function contact between
the time the holding,
during specimen andand the
theanvils.
relaxation
The stress was recorded as a function of the time during holding, and the relaxation curve
curve fitted with an Avrami-type (JMAK) equation for determining t50 in order to obtain
fitted with an Avrami-type (JMAK) equation for determining t50 in order to obtain the SRX
the SRX fraction as a function of holding time t [36,37]
fraction as a function of holding time t [36,37]
Χ = 1 − exp(−0.693(t/t50)n) (2)
X = 1 − exp(−0.693(t/t50 )n ) (2)
where n is the Avrami (JMAK) exponent. Tests were carried out in the deformation tem-
where (T
perature n is the Avrami (JMAK) exponent. Tests were carried out in the deformation
Def) range 900–1200 °C corresponding to the hot rolling regime and also, the
temperature (TDef ) range 900–1200 ◦ C corresponding to the hot rolling regime and also,
strain (0.125–0.4) and strain rate (0.01–5 s−1) were suitably varied over wide ranges in order
the strain (0.125–0.4) and strain rate (0.01–5 s−1 ) were suitably varied over wide ranges in
to determine the SRXthe
order to determine characteristics and respective
SRX characteristics and respectivematerial constants.
material constants.AAschematic
schematic illus-
tration of the of
illustration experiment schedule
the experiment is shown
schedule in Figure
is shown 1a and
in Figure the the
1a and corresponding
correspondingexperi-
mental setup showing a sample between the anvils just before deformation
experimental setup showing a sample between the anvils just before deformation in the in the Gleeble
simulator
Gleeble is presented
simulator in Figure in
is presented 1b.Figure
Detailed
1b. test conditions
Detailed are presented
test conditions in Tablein2.
are presented
Table 2.
(a) (b)
Figure
Figure1.1.(a)
(a)Schematic of stress-relaxation
Schematic of stress-relaxation test
test schedules,
schedules, (b) experimental
(b) experimental setup setup in thestate
in the initial initial state
(prior to(prior to defor-
deformation).
mation).
For the Nb-microalloyed steels, the suitable reheating temperatures were determined
using
For the
theThermo-Calc
Nb-microalloyedsoftware (version
steels, the 2019a, Thermo-Calc
suitable reheating Software
temperaturesAB, Solna,
wereSweden)
determined
with the Precipitation module (TC-PRISMA), with the objective to dissolve all of the 0.026%
using the Thermo-Calc software (version 2019a, Thermo-Calc Software AB, Solna, Swe-
of Nb into the solid solution. The critical solution temperatures of NbC were found to be
den) with the Precipitation module (TC-PRISMA), with the objective to dissolve all of the
1220 ◦ C and 1235 ◦ C for 0.4% steel and 0.5% C-bearing steel respectively (see Figure 2). In
0.026% of Nb
addition, into
the the solid
reheating solution. The
temperature (TRHcritical
) and/orsolution
time (tRH temperatures of NbC
) of all the steels werewere
aptlyfound
to be 1220 °C and 1235 °C for 0.4% steel and 0.5% C-bearing steel respectively
varied (Table 2) to produce relatively finer grain structures in order to determine the (see Figure
2). influence
In addition, the reheating
of grain size on SRXtemperature (TRH) the
kinetics and check and/or timeof(tthe
validity RH)empirical
of all theequations
steels were
for aptly
varied (Table
fractional 2) to produce relatively finer grain structures in order to determine the in-
softening.
fluence of grain size on SRX kinetics and check the validity of the empirical equations for
fractional softening.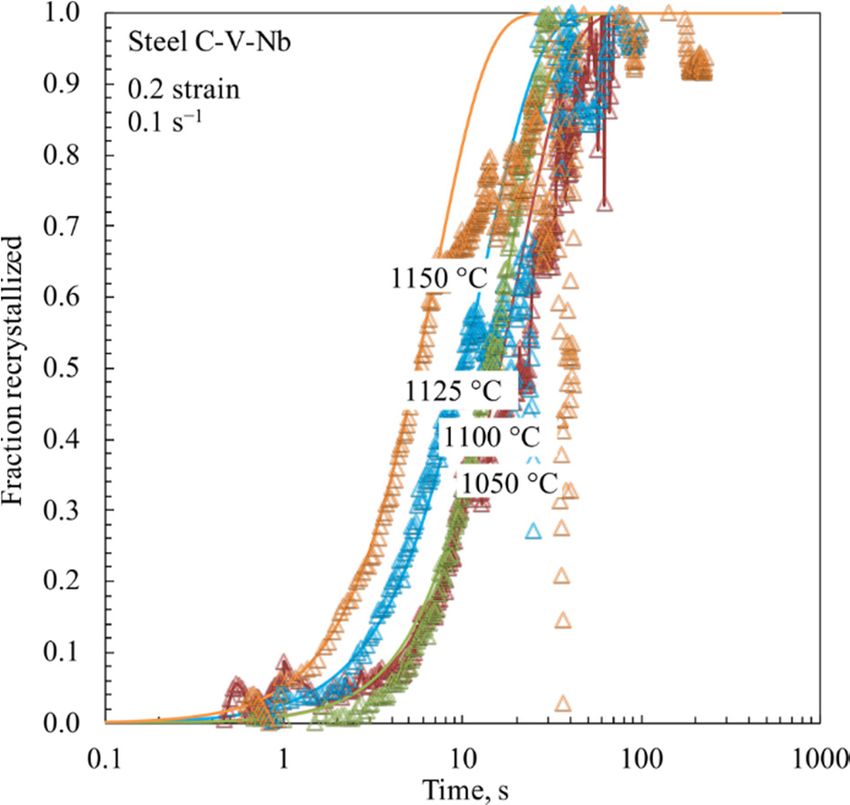
Metals 2021, 11, 138                                                                                                       5 of 19

                                           Table 2. Test conditions for the medium-carbon steels.

      Steel Code          TRH (◦ C)/tRH (min)       PAGS (µm)               TDef (◦ C)               Strain     Strain Rate (s−1 )
                                                                    900, 950, 1000, 1050, 1150,
                                                                                                       0.2             0.1
                                                                               1200
                                1250/2                  650
                                                                               1050                 0.125–0.4          0.1
         Mn-Si                                                                 1050                    0.2           0.01–5
                                                                         1000, 1050, 1100              0.2             0.1
                                1250/1                  132
                                                                               1050                 0.15–0.35          0.1
                                1150/2                  121                    1050                    0.2             0.1
                                                                    900, 950, 1000, 1075, 1125,
                                                                                                       0.2             0.1
                                                                         1150, 1175, 1200
                                1250/2                  461
                                                                               1100                 0.125–0.4          0.1
        Mo-Nb                                                                  1100                    0.2           0.01–5
                                                                         1000, 1050, 1100              0.2             0.1
                                1250/1                  195
                                                                               1050                 0.15–0.35          0.1
                                1150/2                  157                    1050                    0.2             0.1
                                                                    900, 950, 1000, 1050, 1150,
                                                                                                       0.2             0.1
                                                                               1200
                                1250/2                  417
                                                                               1050                 0.125–0.4          0.1
         V-Nb
                                                                               1050                    0.2           0.01–5
                                                                            1000, 1100                 0.2             0.1
                                1250/1                  207
                                                                               1050                 0.15–0.35          0.1
                                                                    900, 950, 1000, 1050, 1125,
                                                                                                       0.2             0.1
                                                                            1150, 1200
                                1250/2                  401
        C-V-Nb                                                                 1050                 0.125–0.4          0.1
                                                                               1050                    0.2           0.01–5
Metals 2021, 11, x FOR PEER REVIEW
                             1150/1                     154                    1050                    0.2             0.1

                                      Figure
                                     Figure 2. 2. Mass
                                               Mass    fraction
                                                    fraction     of NbC
                                                             of NbC       in equilibrium
                                                                    in equilibrium         condition
                                                                                   condition calculatedcalculated with TC-PRISMA.
                                                                                                        with TC-PRISMA.

                                     3. Results and Discussion
                                             Table 2. Test conditions for the medium-carbon steels.
                                     3.1. Flow Stress Behaviour
  Steel Code          TRH (°C)/tRH (min)Examples
                                             PAGSof(µm)                         TDef (°C)
                                                       typical true stress-true strain  curves for the Mn-Si and Strain     Strain Rate
                                                                                                                    Mo-Nb steels
                                    reheated at 1250 ◦ C/2 min and     compressed    to  a true strain
                                                                  900, 950, 1000, 1050, 1150, 1200     of ~0.2 at a constant
                                                                                                                   0.2       true 0.1
                                    strain rate of 0.1 s−1 in the temperature range of 900–1200 ◦ C are shown in Figure 3,
                            1250/2                650                              1050                        0.125–0.4           0.1
                                                                                   1050                            0.2           0.01–5
     Mn-Si
                                                                            1000, 1050, 1100                       0.2             0.1
                            1250/1                132
                                                                                   1050                        0.15–0.35           0.1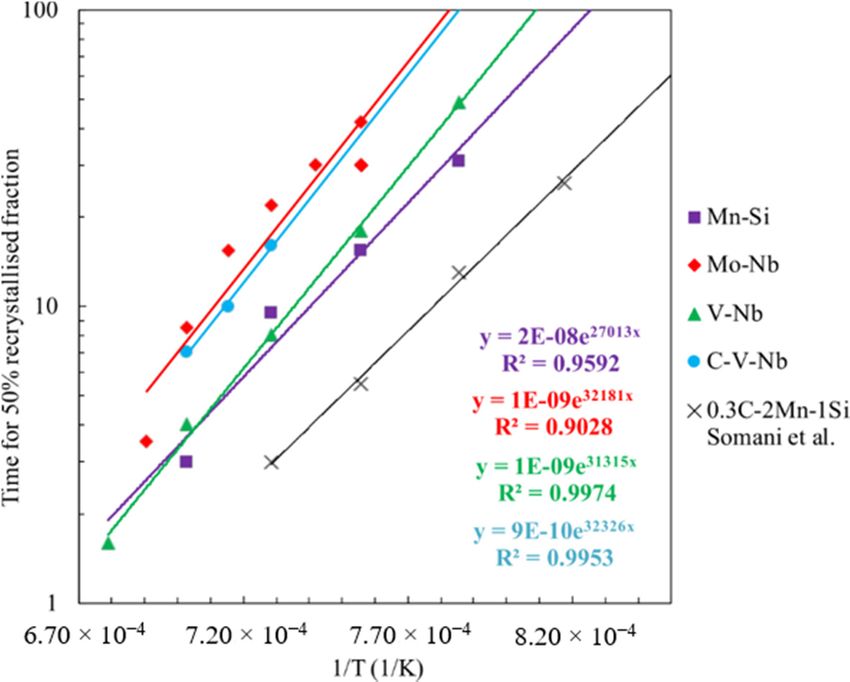
ing the empirical equations.
As far as the flow stress levels of the steels are concerned, it seems that there were no
significant differences among the four steels tested, except the Mo-Nb steel (Figure 3b),
which showed somewhat higher flow stresses especially at the two lowest deformation
Metals 2021, 11, 138 temperatures. As regards the Mn-Si steel, the maximum flow stress at 0.2 strain is compa- 6 of 19
rable with the previous measurements made at the authors’ laboratory for Mn-Si steels
[25]. Grajcar et al. [30,39] reported that Mn did not affect the hot flow stress behaviour of
3%Mn and 5%Mn steels in the range 850–1150 °C. For better clarification of the effect of
illustrating
alloying typicalon
elements flow
thestress behaviour
flow stress level of the steels
at low prior
and high to stress relaxation.
temperatures, Thecurves
flow stress shape
of the flow stress curves suggests work hardening and dynamic recovery processes
of all four steels at two respective temperatures of 950 °C and 1150 °C, are plotted in Figure at all
deformation temperatures. Thus, relaxation after hot compression should
4. Obviously, all three Nb-microalloyed steels exhibit slightly higher flow stresses at 950 characterize
the(maximum
°C static restoration (recovery
stress 100–110 MPa andat recrystallization) processes,
~0.2 strain) in comparison to except
that of presumably
Mn-Si steel (90 at
1150–1200 ◦ C, where the critical strain for the onset of dynamic recrystallization (≈0.8
MPa at ~0.2 strain), whereas at 1150 °C the effect of Nb-microalloying is not evident. Fur-
times peakthe
thermore, strain)
Mo-Nbmight be very
steel close
has the or exceeded
highest [15,38],
flow stress at even though
950 °C (110 MPathe peak strain
at ~0.2 was
strain).
In agreement, Singh et al. [40] reported increased flow stress in the range of 850–1100 the
not determined (and not reached yet). Flow stress behaviour of such cases, in which °C,
borderline
caused situation
by solute of and
drag staticpinning
and MDRX was
effects in suspected, was carefully
Mo- and Nb-alloyed lowexamined in order
carbon steels. Kaik-to
exclude them while modelling the fractional softening equations for SRX.
konen et al. [5] also observed a noticeable increase in the mean flow stress at 900 °C in a Similarly, those
cases, where recrystallized
Mo-Nb-alloyed medium-carbon fractions
steel.after relaxation were clearly partial, were excluded
from developing the empirical equations.
Figure 3. Typical
Typical true
truestress–true
stress–truestrain
straincurves
curvesduring
duringhot
hotcompression to to
compression 0.20.2
strain at 0.1
strain s−1sat
at 0.1 various
−1 at temperatures
various for for
temperatures (a)
(a) Mn-Si
Mn-Si andand
(b) (b) Mo-Nb
Mo-Nb steel.
steel.
As far as the flow stress levels of the steels are concerned, it seems that there were
no significant differences among the four steels tested, except the Mo-Nb steel (Figure 3b),
which showed somewhat higher flow stresses especially at the two lowest deformation
temperatures. As regards the Mn-Si steel, the maximum flow stress at 0.2 strain is compara-
ble with the previous measurements made at the authors’ laboratory for Mn-Si steels [25].
Grajcar et al. [30,39] reported that Mn did not affect the hot flow stress behaviour of 3%Mn
and 5%Mn steels in the range 850–1150 ◦ C. For better clarification of the effect of alloying
elements on the flow stress level at low and high temperatures, flow stress curves of all
four steels at two respective temperatures of 950 ◦ C and 1150 ◦ C, are plotted in Figure 4.
Obviously, all three Nb-microalloyed steels exhibit slightly higher flow stresses at 950 ◦ C
(maximum stress 100–110 MPa at ~0.2 strain) in comparison to that of Mn-Si steel (90 MPa at
~0.2 strain), whereas at 1150 ◦ C the effect of Nb-microalloying is not evident. Furthermore,
the Mo-Nb steel has the highest flow stress at 950 ◦ C (110 MPa at ~0.2 strain). In agreement,
Singh et al. [40] reported increased flow stress in the range of 850–1100 ◦ C, caused by solute
drag and pinning effects in Mo- and Nb-alloyed low carbon steels. Kaikkonen et al. [5]
also observed a noticeable increase in the mean flow stress at 900 ◦ C in a Mo-Nb-alloyed
medium-carbon steel.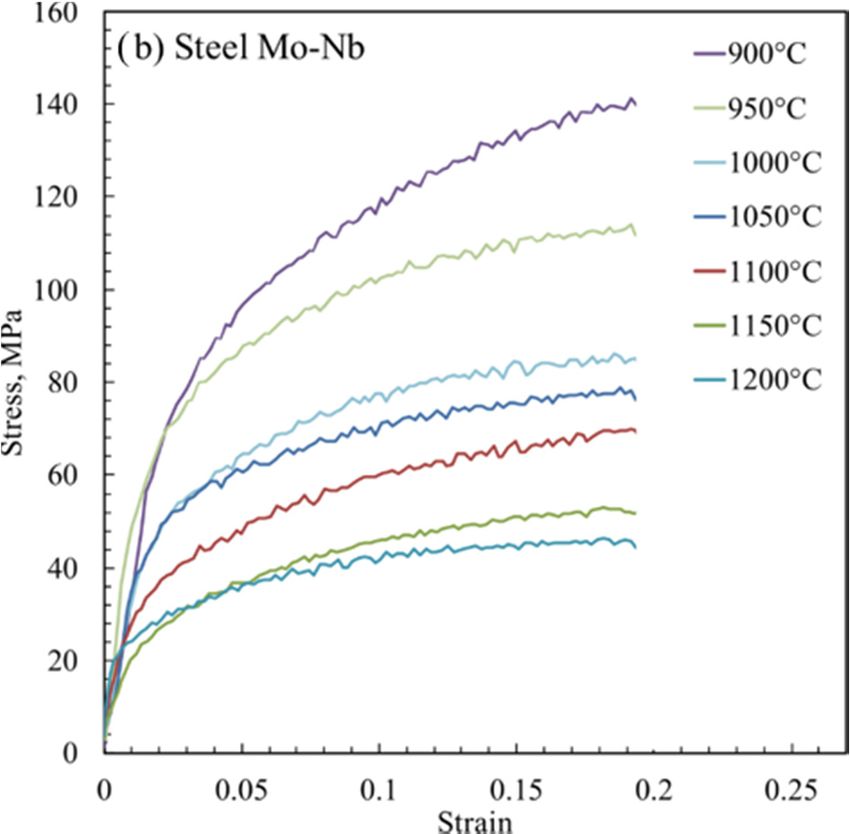
als 2021, 11, x FOR PEER REVIEW
      Metals 2021, 11, 138                                                                                               7 of 19

                              Figure
                             Figure      4.stress–strain
                                    4. True True stress–strain           curves
                                                         curves of the four steels at of
                                                                                      1150the  950 ◦ C.steels
                                                                                           and four             at 1150 and 950 °C.
                             3.2. Stress Relaxation Behaviour
                              3.2.Typical
                                    Stress    Relaxation
                                          stress-relaxation    Behaviour
                                                            curves for the studied steels are plotted in Figure 5. Although
                             the curves look somewhat flat at short relaxation times (note the logarithmic time scale)
                                      Typical
                             because of             stress-relaxation
                                        several curves   plotted together, but the curves       for the studied
                                                                                     essential information,  i.e., the threesteels
                                                                                                                             stages are
                             of the restoration process can still be discerned. Several earlier studies have presented
                              hough
                             that         the
                                  the initial andcurves      look
                                                  final linear  stagessomewhat           flat at short
                                                                        of the curves correspond              relaxation
                                                                                                     to the occurrence            times (n
                                                                                                                           of static
                              scale)and
                             recovery    because
                                             slow creep,ofrespectively,
                                                             severaland    curves       plottedfaster
                                                                              the intermediate       together,
                                                                                                         drop in the butstress the
                                                                                                                               level essen
                             indicates the occurrence of either SRX or MDRX process, cf. [16,17,41]. Stress relaxation
                              threewere
                             curves     stages      ofanalysed
                                            carefully   the restoration
                                                                  to determine the  process      can ofstill
                                                                                      characteristics           be process
                                                                                                          the SRX     discerned.as a   Sev
                              presented
                             function           that the
                                       of deformation         initial Recrystallized
                                                         parameters.     and final linear           stages
                                                                                          fraction vs.         of the
                                                                                                        time curves        curves
                                                                                                                        stating  the corr
                             SRX (or MDRX) rates can be computed from the stress relaxation data by determining the
                              of static
                             slopes           recovery
                                    of the first              and[17,42].
                                                 and third stages    slow creep, respectively, and the interm
                                  An example
                              stress    levelofindicates
                                                   a stress relaxation
                                                                   thecurve    fitted with the
                                                                         occurrence          ofhelp  of two SRX
                                                                                                  either    lines (Aor  andMDRX
                                                                                                                             B) and    pro
                             determination of the recrystallized fraction X at a particular time is shown in Figure 6, as
                              relaxation
                             explained           curves
                                        in [17,42].         wereandcarefully
                                                    More details        analysis of theanalysed
                                                                                         experimental toparameters
                                                                                                           determine    on the the
                                                                                                                                SRX chara
                             kinetics are discussed   in subsequent    sections.
                              cess as a function of deformation parameters. Recrystallized frac
                              ing the SRX (or MDRX) rates can be computed from the stress
                              mining the slopes of the first and third stages [17,42].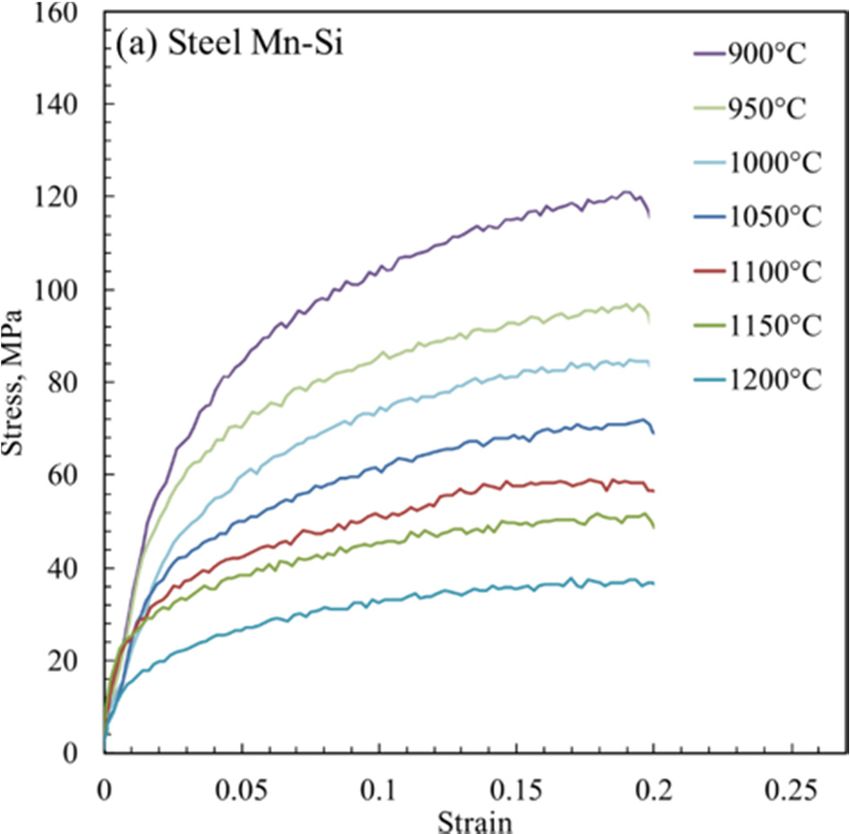
of static recovery and slow creep, respectively, and the intermediate faster drop in the
                                  stress level indicates the occurrence of either SRX or MDRX process, cf. [16,17,41]. Stress
                                  relaxation curves were carefully analysed to determine the characteristics of the SRX pro-
                                  cess as a function of deformation parameters. Recrystallized fraction vs. time curves stat-
Metals 2021, 11, 138              ing the SRX (or MDRX) rates can be computed from the stress relaxation data by deter-8 of 19
                                  mining the slopes of the first and third stages [17,42].

Metals 2021, 11, x FOR PEER REVIEW                                                                                                  8 of 18

                                     (a)                                                           (b)

                                     (c)                                                           (d)
      Figure 5.
      Figure 5. Typical
                Typical stress
                        stress relaxation
                               relaxation curves
                                            curves obtained
                                                     obtained on
                                                              on the
                                                                  the bainitic
                                                                      bainiticsteels
                                                                               steelsreheated
                                                                                      reheatedat
                                                                                               at1250
                                                                                                  1250◦°C/2
                                                                                                       C/2 min
                                                                                                            min and
                                                                                                                and compressed in the
                                                                                                                    compressed in the
      range 900–1200  °C
                      ◦   to 0.2 strain at 0.1 s−1 for (a) Mn-Si, (b) Mo-Nb (c) V-Nb and (d) C-V-Nb.
                                                − 1
      range 900–1200 C to 0.2 strain at 0.1 s for (a) Mn-Si, (b) Mo-Nb (c) V-Nb and (d) C-V-Nb.

                                        An example of a stress relaxation curve fitted with the help of two lines (A and B)
                                  and determination of the recrystallized fraction X at a particular time is shown in Figure
                                  6, as explained in [17,42]. More details and analysis of the experimental parameters on the
                                  SRX kinetics are discussed in subsequent sections.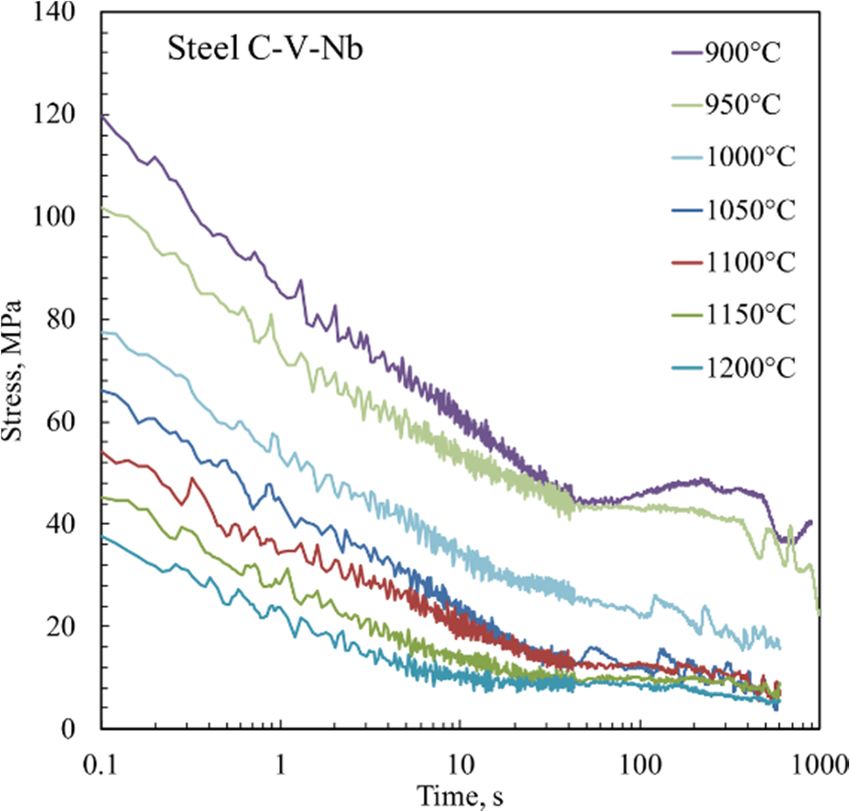
Figure 5. Typical stress relaxation curves obtained on the bainitic steels reheated at 1250 °C/2 min and compressed in the
range 900–1200 °C to 0.2 strain at 0.1 s−1 for (a) Mn-Si, (b) Mo-Nb (c) V-Nb and (d) C-V-Nb.
An example of a stress relaxation curve fitted with the help of two lines (A and B)
Metals 2021, 11, 138 and determination of the recrystallized fraction X at a particular time is shown in 9Figure
of 19
6, as explained in [17,42]. More details and analysis of the experimental parameters on the
SRX kinetics are discussed in subsequent sections.
Figure6.6.An
Figure Anexample
exampleofoffitting
fittingaastress
stressrelaxation
relaxationcurve
curve (Mn-Si
(Mn-Si steel;
steel; reheating
reheating at
at 1250
1250 °C/1
◦ C/1min,
min,
deformation at 1050◦ °C/0.2/0.1 s−1−)1 using the linear log-t slopes (A and B) for the stress in the 1st
deformation at 1050 C/0.2/0.1 s ) using the linear log-t slopes (A and B) for the stress in the 1st
and 3rd stages for determining t50 and the Avrami exponent n.
and 3rd stages for determining t50 and the Avrami exponent n.
3.3.Effect
3.3. EffectofofTemperature
TemperatureandandPrecipitation
Precipitation
onon SRX
SRX Rate
Rate
Fromthe
From thestress
stressrelaxation
relaxation data (Figure 5) 5) and
andEquation
Equation(1) (1)the SRX
the SRX fraction
fractionX vsX log-
vs
t data
log-t datacancanbe be
obtained,
obtained,andandexamples
examplesareare
plotted
plottedin in
Figure
Figure7. 7.
AsAs shown
shown in in
[16–18], the
[16–18],
Avrami-type
the Avrami-type equation
equationdescribing
describingthethe
SRX kinetics
SRX cancan
kinetics be reasonably
be reasonablyfitted withwith
fitted the data,
the
as also
data, demonstrated
as also in theinfigure.
demonstrated From From
the figure. these curves, for instance,
these curves, t50 times
for instance, t50attimes
different
at
different temperatures can be extracted. It is seen that the SRX rate increases significantly
with an increase in the temperature from 900 ◦ C to 1150 ◦ C. For instance, in the case of
Mn-Si steel, t50 decreases from 31 s at 1000 ◦ C to 3 s at 1150 ◦ C (Figure 7a). Complete
softening was obtained in all studied cases, except at the lowest temperature of 900 ◦ C,
where the stress at the final stage remained clearly higher than seen at other temperatures,
indicating that the recrystallization was only partial (see Figures 5a and 7a). Karjalainen [16]
earlier demonstrated that in the instance of partial recrystallization, the stress relaxation
curve remains at a relatively high stress level for the given temperature, although it still
keeps declining.
As regards the Mo-Nb steel, the effect of temperature on the SRX kinetics is more
complicated, as seen in Figure 5b. For instance, the time t50 increases from 3.5 s at 1175 ◦ C
to 30 s at 1075 ◦ C. However, it can be noticed that the stress remained relatively high
at the three lowest temperatures, 1000, 950 and 900 ◦ C, denoting that the softening was
incomplete. Furthermore, at 950 and 900 ◦ C, the stress relaxation curves displayed plateaus
(constant stress periods), or even a slight increase in the stress level after about 30–40 s,
followed by a drop after about 300–400 s. It is well known that strain-induced precipitation
results in an increase in stress level during stress relaxation manifesting as plateaus in the
curves or even an increase in stress [6,9,11,26–28].
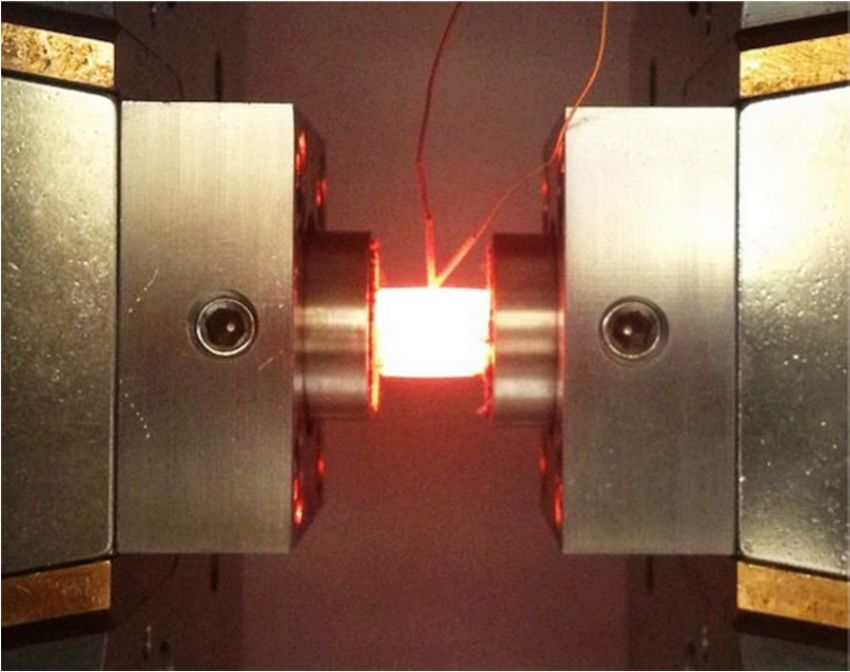
Similarly, for the V-Nb steel, SRX fraction data in Figure 7c show an enhanced SRX
rate with an increase in the temperature. For instance, the t50 decreases from 49 s at
1000 ◦ C to 1.6 s at 1200 ◦ C. Obviously, the precipitation at 1000 ◦ C and below, especially at
950 ◦ C and 900 ◦ C, seems to significantly affect the relaxation stress (see Figures 5c and 7c).
Furthermore, at 950 and 900 ◦ C, the precipitation halts are evident after about 30–40 s of
relaxation. Thus, the appearance of plateaus through stress enhancement can be connected
with the occurrence of carbide or carbonitride precipitation, as they were observed in
all three Nb-bearing steels. A further decrease in stress could be due to coarsening of
precipitates [27]. The start and finishing (coarsening) times of precipitation, Ps and Pf,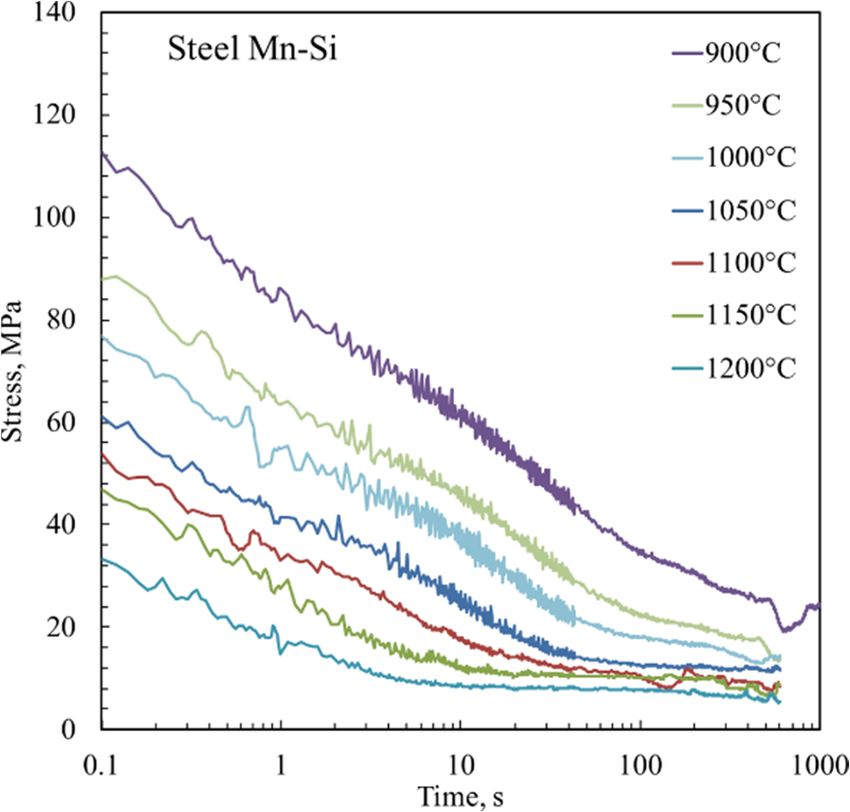
temperatures can be extracted. It is seen that the SRX rate increases significantly with an
                                      increase in the temperature from 900 °C to 1150 °C. For instance, in the case of Mn-Si steel,
Metals 2021, 11, 138                  t50 decreases from 31 s at 1000 °C to 3 s at 1150 °C (Figure 7a). Complete softening         was
                                                                                                                                10 of 19
                                      obtained in all studied cases, except at the lowest temperature of 900 °C, where the stress
                                      at the final stage remained clearly higher than seen at other temperatures, indicating that
                                      the recrystallization was only partial (see Figures 5a and 7a). Karjalainen [16] earlier
                                      respectively, were
                                      demonstrated    thatdetermined  from of
                                                           in the instance thepartial
                                                                               stress relaxation curves and
                                                                                      recrystallization,     listed in
                                                                                                         the stress    Table 3, where
                                                                                                                    relaxation   curve
                                      some relevant data from literature are also included for comparison [6,26–29]. As seen, the
                                      remains at a relatively high stress level for the given temperature, although it still keeps
                                      range of precipitation temperatures and times in the current study correlated well with the
                                      declining.
                                      data published in the literature.

                                       (a)                                                         (b)

                                       (c)                                                         (d)
      Figure 7.
      Figure 7. Fraction
                Fraction recrystallized
                         recrystallized vs.
                                        vs. time
                                             timedata
                                                  datafitted
                                                       fittedwith
                                                              withJMAK-type
                                                                   JMAK-typecurves
                                                                             curvesfor
                                                                                     for(a)(a)Mn-Si,
                                                                                               Mn-Si,(b)(b)
                                                                                                          Mo-Nb, (c)(c)
                                                                                                            Mo-Nb,   V-Nb  and
                                                                                                                        V-Nb   d)(d)
                                                                                                                             and  C-
      V-Nb.
      C-V-Nb.

                                           As
                                           Theregards
                                                Avramithe    Mo-Nb was
                                                           exponent   steel,found
                                                                             the effect of temperature
                                                                                    to vary  in a narrowon     the SRX
                                                                                                            range       kineticswhich
                                                                                                                    of 1.4–1.5,  is more
                                                                                                                                       is
                                     complicated,
                                     consistent withas the
                                                        seentypical
                                                              in Figure 5b. Forfor
                                                                    exponents    instance, the time
                                                                                     low carbon      t50 [25].
                                                                                                 steels  increases from 3.5 s at 1175 °C
                                           Hot rolling is intended to take place in the recrystallization range, above Tnr tempera-
                                     ture. The well-known Boratto equation [34] has been proposed for estimating Tnr , but as
                                     listed in Table 4, it does not give realistic values for the present steels having high Si content,
                                     and it does not include the effect of Mo. Thus, a modification for the Boratto equation is
                                     proposed based on the recrystallization behaviour of the present steels as Equation (3):
                                                             √                                                    √
                       Tnr = 887 + 464C + (6445Nb − 644 Nb) + 500V + 363Al − 357Si + (400Mo − 175 Mo)                                (3)
Metals 2021, 11, 138 11 of 19
√
where the effect of V is changed (originally 732V–230 V) and the effect of Mo is added. C
and Si are limited to the maximum of 0.4%. As seen from Table 4, the predicted values by
the modified equation suggest Tnr values which are close to the approximate values which
can be drawn from the relaxation curves (the lowest temperature resulting in complete
recrystallization, Figures 5 and 7).
Table 3. Start and coarsening times of precipitation reported in the literature and obtained from the present relaxation tests.
Steel Source TP [◦ C] Ps [s] Pf [s]
0.07C-0.96Mn-0.21Si-0.004V-0.046Nb-0.011Ti Perttula [26] 900 30–50
0.21C-1.1Mn-0.2Si-0.062V Medina [27] 800–900 20–80 100–500
0.2C-1.0Mn-0.2Si-0.007Nb Medina [27] 850–950 30–90 110–600
0.19C-1.5Mn-0.45Si-0.125V-0.035Nb Pandit [6] 1000 30 100
0.11C-1.23Mn-0.23Si-0.048V-0.058Nb-0.017Ti Buhler [29] 920 25 550
0.06C-1.9Mn-0.33Si-0.09Nb-0.01Ti Lan [28] 900–1000 7–30 10–50
Mo-Nb Current study 900–950 30–40 300–400
V-Nb Current study 900–950 30–40 150–500
Table 4. Tnr temperatures as estimated by the Boratto equation, calculated by the modified Boratto
equation and approximated from stress relaxation data.
Steel Code Boratto Tnr (◦ C) Regression Tnr (◦ C) Approx. Tnr (◦ C)
Mn-Si 596 901 900
Mo-Nb 674 1018 1015
V-Nb 645 999 1000
C-V-Nb 697 1014 1020
3.4. Powers of Strain and Strain Rate
The powers of strain (p) and strain rate (q) in Equation (1) were estimated by plotting
(i) t50 versus strain between 0.125–0.4 at 0.1 s−1 at a particular temperature, 1050 ◦ C or
1100 ◦ C, and (ii) t50 versus the strain rate between 0.01–5 s−1 , following compression to
0.2 strain at 1050 ◦ C. The corresponding plots for all four steels are displayed in Figure 8.
The powers p and q may be determined from the linear slopes of the data points in the
log–log plot. Alternatively, a power function appears as a linear fit when plotted in a
log–log plot. The power functions and their determination coefficients (R2 ) are listed in
Figure 8. Determination coefficients vary in the range of 0.89–0.99, which is a reasonable
level when scatter in the data is expected.
The values of p in Figure 8a are −2.2, −2.7, −1.9 and −1.7 for steels Mn-Si, Mo-
Nb, V-Nb and C-V-Nb, respectively. They are rather low, as the typical values reported
in the literature vary between −4 and −2 [18,21–23,25,33,43,44], and for microalloyed
steels between −3 and −2 [18,26,41]. Values of −2.8 and −2.5 for the strain exponent p
were estimated by Somani et al. [15,16,19] for C/C–Mn/Nb/Ti/Nb–Ti and Mn–V steels,
respectively [18,23,25]. Lang et al. [45] and Suikkanen et al. [24] obtained −2.1 for p in the
case of a 0.2C-2.0Mn-1.48Si-0.6Cr steel, which is very close to the Mn-Si steel used in the
present study (0.4C-2.0Mn-1.3Si-0.7Cr; Table 1) except for the difference in C content. The
present steels contain 0.7% Cr, but the low concentrations of Cr have hardly shown any
influence on the SRX kinetics of C-Mn steels [39,46,47] and therefore Cr cannot be expected
to have any significant influence on the power of strain or strain rate.
It was observed that all experimental values of the strain rate exponent q fall within
a rather narrow range (−0.21, −0.26, −0.28, −0.27 for Mn-Si, Mo-Nb, V-Nb and C-V-Nb,
respectively), indicating a weak dependence of SRX on the strain rate, irrespective of the
steel alloying. Lang et al. [46] and Suikkanen et al. [24] determined the power of the strain
rate q to be −0.18 for a 0.2C-2.0Mn-1.48Si-0.6Cr steel. This value of q is slightly lower than
the value −0.21 obtained for the present Mn-Si steel, although there is a significant scatter
in the data (see Figure 8a). For Nb and Nb–Ti and also Mo-steels, q has been reported to beliterature vary between −4 and −2 [18,21–23,25,33,43,44], and for microalloyed steels be-
tween −3 and −2 [18,26,41]. Values of −2.8 and −2.5 for the strain exponent p were estimated
by Somani et al. [15,16,19] for C/C–Mn/Nb/Ti/Nb–Ti and Mn–V steels, respectively
[18,23,25]. Lang et al. [45] and Suikkanen et al. [24] obtained −2.1 for p in the case of a 0.2C-
Metals 2021, 11, 138 2.0Mn-1.48Si-0.6Cr steel, which is very close to the Mn-Si steel used in the present12 study
of 19
(0.4C-2.0Mn-1.3Si-0.7Cr; Table 1) except for the difference in C content. The present steels
contain 0.7% Cr, but the low concentrations of Cr have hardly shown any influence on the
SRX kinetics of C-Mn steels [39,46,47] and therefore Cr cannot be expected to have any
approximately −0.26, which is in good agreement with the q obtained for the microalloyed
significant influence on the power of strain or strain rate.
steels in the current study (−0.26, −0.28, −0.27) [18,23].
(a) (b)
Figure 8.
Figure 8. Dependence
Dependenceof
oft t50 on
on(a)
(a)strain
strainand
and(b)
(b)the
thestrain
strainrate
rate
forfor experimental
experimental steels
steels deformed
deformed at 1050
at 1050 ◦ C, °C, except
except Mo-
Mo-Nb,
50
Nb, which is deformed and relaxed at 1100 °C. See Table 1 for austenite grain size of the steels.
which is deformed and relaxed at 1100 ◦ C. See Table 1 for austenite grain size of the steels.
It was observed that all experimental values of the strain rate exponent q fall within
a rather
3.5. Effectnarrow
of Grainrange
Size on(−0.21, −0.26, −0.28, −0.27 for Mn-Si, Mo-Nb, V-Nb and C-V-Nb,
SRX Rate
respectively), indicating
To understand a weak
the effect dependence
of grain of SRX
size on the SRX rate,
on the strain rate,
different irrespective
reheating of the
temperatures
steel alloying. Lang et al. [46] and Suikkanen et al. [24] determined the power
and/or times were selected to vary the grain size. For instance, Mn-Si steel specimens of the strain
reheated at 1250 ◦ C for 2 min resulted in a very coarse grain size of ~650 µm, whereas
holding for just 1 min at the same temperature resulted in a grain size of 132 µm. The
stress relaxation data (1050 ◦ C/0.2/0.1 s−1 ) revealed t50 times of 15.5 s and 9.9 s (see
Figure 9a) for the two grain sizes, respectively, i.e., a significant retardation of SRX rate
by grain coarsening in the instance of very coarse grain size. Similarly, reheating Mo-
Nb steel at 1250 ◦ C/2 min resulted in a grain size of 461 µm in comparison to 157 µm
obtained at 1150 ◦ C/2 min. The corresponding t50 times were 30.0 s and 16.6 s (see
Figure 9b), respectively. More details about the grain size data for the experimental steels
corresponding to different reheating temperatures and/or times are given in Table 2.
Similar effects of grain size on the SRX rate were observed in other steels, as well. These
were later used in validation of empirical equations developed in this study and also
compared with the predictions of the previous model for microalloyed steels [18,21–23].
3.6. Apparent Activation Energy of Recrystallization (Qapp )
For estimating the apparent activation energy for recrystallization (Qapp ), the t50 data,
as expressed in Equation (1), was plotted against the inverse absolute temperature (1/T) in
Figure 10, where the corresponding R2 values are also presented. In the analysis of the t50
data, the cases of incomplete recrystallization (at low temperatures) and MDRX (at high
temperatures) were systematically excluded. The possibility of partial recrystallization at
low temperatures were discussed earlier (see Section 3.3), whereas the occurrence of MDRX
was suspected at high temperatures 1150–1200 ◦ C as well as at high strains 0.35–0.4 for the
three Nb microalloyed steels. From the plots, the Qapp was estimated as 225, 268, 260 and
269 kJ·mol−1 for Mn-Si, Mo-Nb, V-Nb and C-V-Nb steels, respectively. For comparison,
t50 data for a 0.3-2Mn-1.5Si steel from Somani et al. [25] were also included in the figure.reheated at 1250 °C for 2 min resulted in a very coarse grain size of ~650 µm, whereas
holding for just 1 min at the same temperature resulted in a grain size of 132 µm. The
stress relaxation data (1050 °C/0.2/0.1 s−1) revealed t50 times of 15.5 s and 9.9 s (see Figure
9a) for the two grain sizes, respectively, i.e., a significant retardation of SRX rate by grain
Metals 2021, 11, 138 coarsening in the instance of very coarse grain size. Similarly, reheating Mo-Nb steel at
13 of 19
1250 °C/2 min resulted in a grain size of 461 µm in comparison to 157 µm obtained at 1150
°C/2 min. The corresponding t50 times were 30.0 s and 16.6 s (see Figure 9b), respectively.
More details about the grain size data for the experimental steels corresponding to differ-
Despite the different
ent reheating carbon and/or
temperatures contentstimes
of 0.3%C and 0.4%C
are given of the
in Table two Mn-Si
2. Similar steels,
effects the Qsize
of grain app
of 224.6 kJ/mol was the same as that of the current Mn-Si steel (225 kJ/mol). However,
on the SRX rate were observed in other steels, as well. These were later used in validation
the measuredequations
of empirical t50 times for the 0.3C-2Mn-1Si
developed were
in this study significantly
and also comparedshorter
withthan
thefor the current
predictions of
Mn-Si steel, obviously as a consequence of its finer austenite grain size (132 µm vs. 650
the previous model for microalloyed steels [18,21–23].
µm), and not due to the different carbon content.
Metals 2021, 11, x FOR PEER REVIEW 13 of 18
260 and 269 kJ·mol−1 for Mn-Si, Mo-Nb, V-Nb and C-V-Nb steels, respectively. For com-
parison, t50 data for a 0.3-2Mn-1.5Si steel from Somani et al. [25] were also included in the
figure. Despite the different carbon contents of 0.3%C and 0.4%C of the two Mn-Si steels,
the Qapp of 224.6 kJ/mol was the same as that of the current Mn-Si steel (225 kJ/mol). How-
ever,vs.the measured ◦ C/0.2/0.1
t50 times −for
1 ) curves
the 0.3C-2Mn-1Si were significantly shorter
Figure 9. Recrystallized fraction
Figure 9. Recrystallized fraction vs. time
time (1050°C/0.2/0.1
(1050 s−1)scurves after after two austenitization
two austenitization conditions
conditions thethan
revealing
revealing thefor the
effect
effect of grain size: (a) Mn-Si current
at °C
1250 ◦ Mn-Si steel, obviously as ata 1150
consequence of for◦
its 2C
finer
for 2austenite grain size (132 µm
of grain size: (a) Mn-Si at 1250 for 1C for 12 and
and min 2and
min and
(b) (b) Mo-Nb,
Mo-Nb, atand
11501250
and °C
1250 min. min.
vs. 650 µm), and not due to the different carbon content.
3.6. Apparent Activation Energy of Recrystallization (Qapp)
For estimating the apparent activation energy for recrystallization (Qapp), the t50 data,
as expressed in Equation (1), was plotted against the inverse absolute temperature (1/T)
in Figure 10, where the corresponding R2 values are also presented. In the analysis of the
t50 data, the cases of incomplete recrystallization (at low temperatures) and MDRX (at high
temperatures) were systematically excluded. The possibility of partial recrystallization at
low temperatures were discussed earlier (see Section 3.3), whereas the occurrence of
MDRX was suspected at high temperatures 1150–1200 °C as well as at high strains 0.35–
0.4 for the three Nb microalloyed steels. From the plots, the Qapp was estimated as 225, 268,
Figure10.
Figure 10.Estimation
EstimationofofQQ app of the experimental steels. Data of 0.3C-2Mn-1Si steel are also in-
app of the experimental steels. Data of 0.3C-2Mn-1Si steel are also included
cluded for comparison
for comparison [25]. [25].
3.7.Effect
3.7. EffectofofMo,
Mo,VVand
andNb
Nbon
onQQrexrex
Theactivation
The activation energy
energy of of
SRX SRX
(Q(Q ) is
rex )rexis dependent
dependent onon
thetheQapp
Q,app , the
the power
power of strain
of strain q,
raterate
and the activation
q, and energy
the activation of deformation
energy of deformation Qdef . Q
Somani et al. et
def. Somani [18,21,22,25] considered
al. [18,21,22,25] the Qdef
considered the
ofQ340 kJ/mol
def of for C–Mn
340 kJ/mol steelssteels
for C–Mn and 400and kJ/mol for Nb-microalloyed
400 kJ/mol for Nb-microalloyed steels while
steels developing
while devel-
the regression model for the
oping the regression model for Q rex the Qrex of hot deformed austenite. Suikkanen reported
of hot deformed austenite. Suikkanen et al. [32] et al. [32]
reported Qdef values increasing in the range 324 to 353 kJ/mol for 0.2C-2.0Mn-0.6Cr-Si
steels with the Si content increasing from 0.04% to 1.48%. Cabañas et al. [48] determined
the effect of Mn on Qdef in Fe-Mn binary systems and reported that generally Mn, below
10%, increased the Qdef whereas Mn contents ≥10% decreased it, although the maximumMetals 2021, 11, 138 14 of 19
Qdef values increasing in the range 324 to 353 kJ/mol for 0.2C-2.0Mn-0.6Cr-Si steels with the
Si content increasing from 0.04% to 1.48%. Cabañas et al. [48] determined the effect of Mn
on Qdef in Fe-Mn binary systems and reported that generally Mn, below 10%, increased the
Qdef whereas Mn contents ≥10% decreased it, although the maximum Qdef was obtained
for an Fe-3Mn alloy.
If assuming that the Qdef is 340 kJ/mol for Mn-Si steel, Qrex of 296 kJ/mol is obtained,
and considering a Qdef of 400 kJ/mol for the current Nb-microalloyed steels would result
in Qrex values of 372, 372 and 377 kJ/mol for Mo-Nb, V-Nb and C-V-Nb steels, respectively.
It can be noted that the value of q for Mn-Si steel (−0.21) was somewhat lower than those
of Mo-Nb (−0.26), V-Nb (−0.28) and C-V-Nb (−0.27) steels, so that the relatively low Qapp
value (225 kJ/mol) of Mn-Si steel results in a lower Qrex value than in the other steels, as
also expected from its lower alloying content. Nevertheless, the Qrex values of Mo-Nb and
V-Nb steels was equal (372 kJ/mol). The only difference between the V-Nb and C-V-Nb
steel is the carbon content (see Table 1). The difference 0.4% and 0.5% in the carbon content
cannot be expected to cause any difference, so the slightly different values of p, q, Qapp and
Qrex can be attributed to simple data scatter.
A linear regression analysis [18,21,22] suggested that Qrex (in J/mol) for C–Mn and
microalloyed steels can be given by:
Qrex = 3803CF + 109,418 (4)
Here CF, the composition factor, is:
CF = 2Cr + 10Cu + 15Mn + 50Mo + 60Si + 70V + 230Ti + 700Nb (5)
where the elements are in wt.% and the effects of Si and Nb are considered to saturate at
0.4% and 0.044%, respectively. These equations lead to Qrex values of 323, 445, 400, and
401 kJ/mol, respectively for the Mn-Si, Mo-Nb, V-Nb and C-V-Nb steels. The predicted
value of 323 kJ/mol for the Mn-Si is slightly higher than the experimentally obtained value
(296 kJ/mol), whereas for the Nb-microalloyed steels the predicted values are remarkably
higher than the experimental ones. As the predictions of Qrex deviate for all four steels
in the same direction, it might suggest that the regression is not valid with 2%Mn, but
the upper limit of saturation should be lower, or the coefficient of Mn should be lower.
Decreasing the coefficient of Mn in the Equation (5) from 15 to 11 could result in more
comparable Qrex values, specifically 293, 415, 370 and 372 kJ/mol for the Mn-Si, Mo-Nb, V-
Nb and C-V-Nb steels, respectively. However, the difference in the predicted and obtained
value still remains notably high for the Mo-Nb steel (372 kJ/mol and 415 kJ/mol).
3.8. Fractional Softening Equations
In Equation (1), the power of the grain size (s) described by the relation s = 2.13d–0.105
was previously determined based on measured SRX data for a large number of carbon steels,
with and without microalloying [18]. The constant A for the present four experimental
steels could be obtained by taking s by the same relation, together with the values for
the other parameters (Qapp , p and q) in Equation (1). Finally, t50 can be described by the
following SRX equations:
Mn-Si t50 = 2.63 × 10⁻¹³ ε−2.2 ε’−0.21 ds exp(225,000/RT) (6)
Mo-Nb t50 = 8.66 × 10⁻¹⁵ ε−2.7 ε’−0.26 ds exp(268,000/RT) (7)
V-Nb t50 = 2.71 × 10⁻¹⁴ ε−1.9 ε’−0.28 ds exp(260,000/RT) (8)
C-V-Nb t50 = 2.11 × 10⁻¹⁴ ε−1.7 ε’−0.27 ds exp(269,000/RT) (9)
The predictions for all four steels including confirmation tests for Mn-Si steel and a
comparison with the predictions of an equation for V-Nb steel from Shen et al. [49] areMetals 2021, 11, 138 15 of 19
Metals 2021, 11, x FOR PEER REVIEW 15 of 18
displayed in Figure 11. A reasonable consistence is obvious, although the experimental
scatter is pronounced.
(a) (b)
(c) (d)
Figure 11. Predictions
Figure11. Predictionsvs.vs. experimental
experimentaltt5050 times: (a) Mn-Si,
times: (a) Mn-Si, (b)
(b) Mo-Nb,
Mo-Nb, (c)
(c) V-Nb
V-Nb and
and (d)
(d) C-V-Nb
C-V-Nbsteels.
steels. Confirmation
Confirmationteststests
for
forMn-Si
Mn-Sisteel,
steel,predicted
predicteddata
dataof
ofShen
Shenetetal.
al.[49]
[49] for
for aa V-Nb
V-Nbsteel
steeland
andthe
thepredictions
predictionsof
ofprevious
previousregression
regressionmodel
model[21–23]
[21–23]
experimentaldata
experimental datafor
fordifferent
differentgrain
grainsizes
sizesare
arealso
also included
included forfor comparison.
comparison. The
The only
only testtest
forfor grain
grain sizesize effect
effect in the
in the casecase
of
of C-V-Nb
C-V-Nb steelsteel
waswas
not not successful.
successful.
4. Conclusions
In order to check the reliability of the fractional softening Equation (9) derived for
the Mn-Si steel,relaxation
The stress two confirmation
method onexperiments were conducted
a Gleeble simulator was usedby randomly the
to determine varying
static
the deformation parameters, (1075 ◦ C/0.17/0.15 s−1 , 1025 ◦ C/0.24/0.2 s−1 ) and using
recrystallization (SRX) kinetics of coarse-grained hot-deformed austenite in four medium-
carbon Fe-2Mn-1.3Si-0.7Cr steels with different microalloying over a wide range of tem-
peratures (900–1200 °C), strains (0.125–0.4) and strain rates (0.01–5 s−1). The effects of MoMetals 2021, 11, 138 16 of 19
a coarse grain size (650 µm; see Table 1). As seen in Figure 11, the predictions for the
confirmation tests resulted in reasonable predicted/experimental ratios of 1.3 and 2.0, for
1025 ◦ C/0.24/0.2 s−1 and 1075 ◦ C/0.17/0.15 s−1 respectively.
The results of the prior regression model developed for estimating t50 [18,21–23] are
also shown in Figure 11. It is obvious that the previous model generally predicts shorter
t50 times than the present model and experimental values obtained for the microalloyed
steels, whereas for the Mn-Si steel those predictions follow more closely the agreement
line, although with large scatter. From Figure 11, it can be seen that the predicted values
deviated from experimental ones particularly for the Mo-Nb steel and to some extent for
C-V-Nb steel. Two reasons may be suggested for this deviation: first the pronounced scatter
of the data (after many repeats) and secondly because of the unsuitability of the prior
model for very coarse grain sizes (450–650 µm) existing in the present experiments. The
predicted/experimental ratios using the empirical equations derived in this study are in
range of 0.6–2 for Mn-Si, 0.6–2.1 for Mo-Nb, 0.7–1.2 for V-Nb and 0.6–4.0 for C-V-Nb steels,
where the grain size variation results in some scatter. Grain size effect is determined from
data from different reheating temperatures or times (see Table 2).
4. Conclusions
The stress relaxation method on a Gleeble simulator was used to determine the
static recrystallization (SRX) kinetics of coarse-grained hot-deformed austenite in four
medium-carbon Fe-2Mn-1.3Si-0.7Cr steels with different microalloying over a wide range
of temperatures (900–1200 ◦ C), strains (0.125–0.4) and strain rates (0.01–5 s−1 ). The effects
of Mo and V together with Nb on SRX kinetics and the plausible occurrence of precipitation
were thoroughly investigated. The main results are as follows:
Strain hardening and dynamic recovery occurred during compression under all defor-
mation conditions. At low (≈950 ◦ C) temperatures, V-Nb microalloying and particularly
Mo-Nb alloying increased the flow stress.
The stress relaxation method was capable to reveal the SRX kinetics under various
conditions and new Avrami-type equations could be established based on the recorded
relaxation data.
V-Nb microalloying and particularly the Mo-Nb alloying retarded the SRX kinetics,
whereas the difference between carbon contents of 0.4% and 0.5% (both with Nb microal-
loying) was considered minor and attributed to data scatter. For instance, the t50 times
are 9.9, 30.0, 18.0 and 20.5 s for Mn-Si, Mo-Nb, V-Nb and C-V-Nb, respectively, at 1050 ◦ C
(strain 0.2, strain rate 0.1 s−1 , though it should be emphasized that grain sizes vary among
the steels).
In the Avrami-type equation, the powers of strain p (−1.7 to −2.7) and strain rate q
(−0.21 to −0.28) were in the same range as reported earlier for C-Mn microalloyed steels.
Thus, the influence of V and Mo in connection with Nb is negligible.
The apparent activation energy of SRX increased due to V-Nb and Mo-Nb alloying
(260–269 kJ/mol) but the Qapp of the Mn-Si steel (225 kJ/mol) without microalloying was
in the range reported earlier for C-Mn microalloyed steels with lower Mn and Si contents.
The prior SRX regression model suggested for hot deformed austenite [21–23] showed
reasonable 50% recrystallization times (t50 ) for the Mn-Si steel, but for the present microal-
loyed steels the predicted values were distinctly shorter than the experimental ones. A
very large grain size of the present steels might be a reason for the discrepancy.
Stress relaxation curves also revealed the occurrence of partial recrystallization and
the start of precipitation at low deformation temperatures. Strain-induced precipitation
occurred after 30–40 s at around 950 ◦ C for V- and Mo-Nb steels.
The Boratto equation for predicting the Tnr temperature was modified successfully
for these medium carbon bainitic steels containing high silicon, whereby the effect of V
was changed, and C and Si were limited to the maximum of 0.4%, in order to include the
influence of Mo alloying.Metals 2021, 11, 138 17 of 19
The equations derived to describe the SRX kinetics can be used in the design of
the industrial rough rolling scheme of thermomechanical processing to avoid partial
recrystallization.
Author Contributions: Conceptualization, M.C.S. and L.P.K.; formal analysis, P.M.K. and M.C.S.;
data curation, P.M.K.; writing—original draft preparation, P.M.K.; writing—review and editing,
M.C.S. and L.P.K.; visualization, P.M.K.; supervision, J.I.K.; project administration; J.I.K. All authors
have read and agreed to the published version of the manuscript.
Funding: This research was funded by European Research Fund for Coal and Steel under the contract
RFCS-2015-709607 and the Academy of Finland under the “Genome of Steel” project #311934.
Institutional Review Board Statement: Not applicable.
Informed Consent Statement: Not applicable.
Data Availability Statement: The raw/processed data required to reproduce these findings cannot
be shared at this time as the data also forms part of an ongoing study.
Acknowledgments: The authors would like to thank Juha Uusitalo for conducting the stress-
relaxation experiments on the Gleeble simulator.
Conflicts of Interest: The authors declare no conflict of interest.
References
1. Sourmail, T.; Smanio, V.; Ziegler, C.; Heuer, V.; Kuntz, M.; Caballero, F.G.; Garcia-Mateo, C.; Cornide, J.; Elvira, R.; Leiro, A.; et al.
Novel nanostructured bainitic steel grades to answer the need for high-performance steel components (Nanobain). RFSR 2013.
[CrossRef]
2. Garcia-Mateo, C.; Paul, G.; Somani, M.; Porter, D.; Bracke, L.; Latz, A.; de Andres, C.G.; Caballero, F.G. Transferring nanoscale
bainite concept to lower C contents: A perspective. Metals 2017, 7, 159. [CrossRef]
3. Fan, H.L.; Zhao, A.M.; Li, Q.C.; Guo, H.; He, J.G. Effects of ausforming strain on bainite transformation in nanostructured bainite
steel. Int. J. Miner. Metall. Mater. 2017, 24, 264–270. [CrossRef]
4. Zhang, M.; Wang, Y.H.; Zheng, C.L.; Zhang, F.C.; Wang, T.S. Effects of ausforming on isothermal bainite transformation behaviour
and microstructural refinement in medium-carbon Si-Al-rich alloy steel. Mater. Des. 2014, 62, 168–174. [CrossRef]
5. Kaikkonen, P.M.; Somani, M.C.; Miettunen, I.H.; Porter, D.A. Constitutive flow behaviour of austenite at low temperatures and
its influence on bainite transformation characteristics of ausformed. Mater. Sci. Eng. 2020, 775, 9–11. [CrossRef]
6. Pandit, A.; Murugaiyan, A.; Podder, A.S.; Haldar, A.; Bhattacharjee, D.; Chandra, S.; Ray, R.K. Strain induced precipitation of
complex carbonitrides in Nb-V and Ti-V microalloyed steels. Scr. Mater. 2005, 53, 1309–1314. [CrossRef]
7. Medina, S.F.; Mancilla, J.E. Static recrystallization modelling of hot deformed steels containing several alloying elements. ISIJ Int.
1996, 36, 1070–1076. [CrossRef]
8. García-Mateo, C.; López, B.; Rodriguez-Ibabe, J.M. Static recrystallization kinetics in warm worked vanadium microalloyed steels.
Mater. Sci. Eng. A 2001, 303, 216–225. [CrossRef]
9. Vervynckt, S.; Verbeken, K.; Thibaux, P.; Liebeherr, M.; Houbaert, Y. Control of the austenite recrystallization in niobium
microalloyed steels. Mater. Sci. Forum 2010, 638–642, 3567–3572. [CrossRef]
10. Esterl, R.; Sonnleitner, M.; Schnitzer, R. Microstructural analysis of the recrystallization behavior of low alloyed steels. Steel Res.
Int. 2019, 90, 1–10. [CrossRef]
11. Pereda, B.; López, B.; Rodriguez-Ibabe, J.M. Increasing the non-recrystallization temperature of Nb microalloyed steels by Mo
addition. In Proceedings of the Microstructure, Properties and Performance Proceedings, Pittsburgh, PA, USA, 1–3 July 2007;
pp. 151–159.
12. Liu, W.J.; Jonas, J.J. A stress relaxation method for following carbonitride precipitation in austenite at hot working temperatures.
Metall. Trans. A 1988, 19, 1403–1413. [CrossRef]
13. Medina, S.F.; Quispe, A. Improved model for static recrystallization kinetics of hot deformed austenite in low alloy and Nb/V
microalloyed steels. ISIJ Int. 2001, 41, 774–781. [CrossRef]
14. Sellars, C.M.; Whiteman, J.A. Recrystallization and grain growth in hot rolling. Met. Sci. 1979, 13, 187–194. [CrossRef]
15. Sellars, C.M.; Davies, G.J. Hot working and forming processes. In Proceedings of the International Conference Organized Jointly
by the Sheffield Metallurgical and Engineering Association and the University of Sheffield in Assocation with The Metals Society,
London, UK, 8 January 1980.
16. Karjalainen, L.P. Stress relaxation method for investigation of softening kinetics in hot deformed steels. Mater. Sci. Technol. 1995,
11, 557–565. [CrossRef]
17. Karjalainen, L.P.; Perttula, J. Characteristics of static and metadynamic recrystallization and strain accumulation in hot-deformed
austenite as revealed by the stress relaxation method. ISIJ Int. 1996, 36, 729–736. [CrossRef]You can also read