Comparative Study on the Hydraulic Characteristics of Nature-Like Fishways - MDPI
←
→
Page content transcription
If your browser does not render page correctly, please read the page content below
water
Article
Comparative Study on the Hydraulic Characteristics
of Nature-Like Fishways
Tiegang Zheng 1 , Zhipan Niu 2, * , Shuangke Sun 1 , Jiayue Shi 3 , Haitao Liu 1 and Guangning Li 1
 1   State Key Laboratory of Simulation and Regulation of Water Cycle in River Basin, China Institute of Water
     Resources and Hydropower Research, Beijing 100038, China; zhengtg@iwhr.com (T.Z.);
     sunsk@iwhr.com (S.S.); htliou@163.com (H.L.); lgnchina@163.com (G.L.)
 2   Institute for Disaster Management and Reconstruction, Sichuan University, Chengdu 610207, China
 3   Power china Huadong Engineering Corporation, Hangzhou 311122, China; shi_jy@ecidi.com
 *   Correspondence: niuzhipan@sina.com; Tel.: +86-28-8599-6656

 Received: 24 February 2020; Accepted: 25 March 2020; Published: 27 March 2020

 Abstract: Due to the complex structure and the multiformity of boulder arrangements, there is
 currently no perfect design criterion for nature-like fishways. This paper proposes four types of
 nature-like fishways arranged with an impermeable partition wall (IPW), a semi-permeable partition
 wall (SPPW) or a fully permeable partition wall (FPPW). The hydraulic characteristics of these
 fishways were investigated experimentally. The results show that the discharge of the fishway
 arranged with a FPPW was almost twice that of an IPW fishway, and the discharge of a SPPW fishway
 was between the two extremes. The mean flow velocity of the FPPW fishway was larger than that
 of the other schemes. For the fishway arranged with an IPW, the flow information was basically
 consistent with that of the engineered technical fishway. In the FPPW or SPPW fishway, there was
 more abundant flow information and no obvious recirculation zones in the fishway pool, and these
 conditions are suitable for migratory fish moving up- and downstream. Notably, for the fishway
 arranged with two fish passages, two mainstreams were formed in the pool, which divided the flow
 pattern of the pool into three flow regions. A weak recirculation area was formed in the low-velocity
 region, which facilitates swimming for migratory fish. According to this comprehensive comparative
 study, the SPPW fishway with two fish passages had low discharge, abundant flow information and
 favorable fish migration characteristics; thus, it is the optimal fishway scheme among those studied
 in this paper.

 Keywords:    nature-like fishway; hydraulic characteristics;               impermeable partition wall;
 semi-permeable partition wall; fully permeable partition wall

1. Introduction
      Fishways are special facilities that enable fish to migrate through obstacles such as dams, and they
play an irreplaceable role in maintaining the continuity of rivers and the intercommunion between
different fish species [1,2]. The success or failure of a fishway is the evaluating indicator of the health
of a river ecosystem, which is also an important ecological indicator for hydropower engineering [3,4].
Nature-like fishways are very popular all over the world at present [5,6]. Compared with traditional
engineering fishways, nature-like fishways are advantageous for fish passage because of the familiar
flow patterns for fish [7]. A nature-like fishway is suitable for the upstream migration of many kinds
of fish, especially for gated dam projects with large dam widths and low water heads [8].
      Since their initial construction, nature-like fishways have been widely used in Germany,
Switzerland, Finland, Australia, Japan and many other countries [9–11]. Nature-like fishways
are built with diverse materials, such as combinations of gravel, rocks, boulders, wood and riparian

Water 2020, 12, 955; doi:10.3390/w12040955                                         www.mdpi.com/journal/water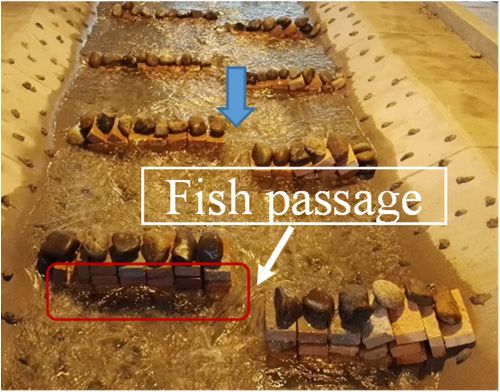
Water 2020, 12, 955                                                                               2 of 15

vegetation, to imitate natural stream geomorphological conditions. Thus, they create more diverse
flow conditions within a cross-section than standard fishways and are amenable to many species of
fish [7,12,13]. After some nature-like fishways were built, monitoring and evaluation were carried
out. Aarestrup et al. [14] used the passive integrated transponder (PIT) technique to monitor the fish
passing situation in a nature-like bypass fishway in Denmark. The monitoring results showed that
over 90% of target fish could enter the fishway, but the passing rate was only about 55%, which was
affected by the overlength and the excessive flow velocity in the fishway. Kim et al. [15] also used PIT
to investigate the effectiveness of the nature-like fishway installed at Sangju Weir on the Nakdong
River, Korea. The monitoring results showed that 63.2% of the fish tested could pass through the
fishway, and some of the fish were found to stay inside the fishway for more than 28 days, which means
that the nature-like fishway has uses other than fish passing. Comparing the passage efficiency of the
nature-like fishway, denil fishway, vertical slot fishway and weir-type fishway, Bunt et al. [7] pointed
out that the upstream migration rate of fish in the nature-like fishway was the highest. It can be seen
from the monitoring results that the flow structure in a nature-like fishway is obviously diversified,
and the flow condition is suitable for different kinds of aquatic organisms.
      The hydrodynamics of conventional fishways have been studied for many years, but the same is
not true for nature-like fishways [8,16]. Although the design principles in geometry and many examples
of implementation of such nature-like fishways have been presented [17,18], it is difficult to establish
uniform dimensions for nature-like fishways, such as the distance of boulders, the shapes of boulders
and their arrangement, which are important indexes that influence the hydraulic characteristics of
nature-like fishways [19–23]. Therefore, in the past few years, studies of nature-like fishways have
always focused on the shape or the arrangement of boulders. For example, Acharya et al. [24]
performed a comparative study of the hydraulic characteristics of two different kinds of nature-like
fishways, focusing on the analysis of how the hemispherical tectonic structure, cylindrical tectonic
structure and square tectonic structure of the fish channel influenced the downstream migration of
fish. Similarly, Muraoka et al. [19] studied how the shape, arrangement and height of the boulders
influenced the migration of fish in the rock-ramp-type fishway, a nature-like fish pass with a staggered
arrangement of boulders, via physical experiments. Baki et al. [25] put forward a design scheme for a
rock-ramp-type fishway and studied the mean flow characteristics at three different slopes (5%, 3%
and 1.5%). It was found that this type of fish pass can produce an adequate water depth and favorable
flow velocity suitable for fish passage. Baki et al. [26] also examined the turbulence characteristics
of a rock-ramp-type fishway considering slopes of 1.5% and 3% tested under different discharges. It
should be pointed out that there are some major differences between the flow with a cluster of boulders
(wake-interference flow) and the flow with isolated boulders (isolated-roughness flow) in the decay
rate of turbulence and the turbulence magnitude. In addition, some researchers, such as Tran et al. [20]
and He et al. [27], have used numerical simulations to study the layout of boulders in nature-like
fishways and put forward some layout proposals. Wang and Hartlieb [16] presented a verification
of the hydraulic and geometric parameters of nature-like pool-type fish passes via experimental and
field investigations. Additionally, some researchers have also put forward many types of fishways
piled with boulders [28,29]. However, most materials of partition walls formed by boulders in the
above-mentioned nature-like fishways are impermeable; such fishways are actually imitations of
engineered technical fishways, and not really nature-like fishways. Because of the diversity of the
placement and arrangement of boulders in nature-like fishways, the layout of nature-like fishways has
remained in the stage of optimization and exploration in recent years [16].
      Plenty of research has shown that when a river is blocked by gated dams, a nature-like fishway is
the best alternative scheme to guarantee an unblocked ecosystem. However, because of the complexity
of the structure, the variability of section types, the high roughness of the slope and bottom material
and the difficulty in estimating the roughness coefficient of nature-like fishways, neither the perfect
research method nor design criterion for nature-like fishways has been formed to date, especially for
the layout of a fishway piled with boulders [16,30]. This paper presents a new fishway type formed by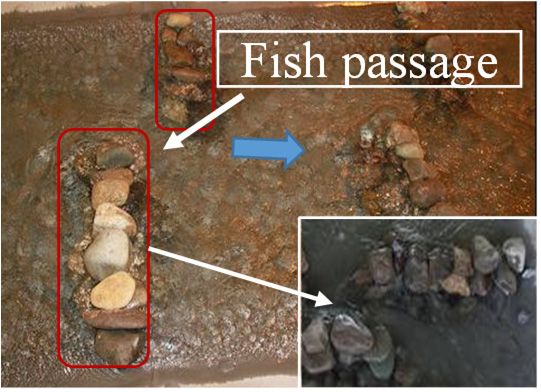
Water 2020, 12, x FOR PEER REVIEW 3 of 15
Water 2020,
Water 2020, 12,
12, 955
x FOR PEER REVIEW 33 of 15
of 15
fishway type formed by a rubble wall. The hydraulic characteristics of fishways formed under
impermeable,
fishway type formed semi-permeable
by a rubble andwall. fullyThepermeable
hydraulicrubble wall conditions
characteristics of fishwaysare comparatively
formed under
analyzed,
aimpermeable,
rubble wall.which The could provide
hydraulic
semi-permeable the
andbasis
characteristicsfullyforof the engineering
fishways
permeable rubble design
formed under and application
impermeable,
wall conditions of nature-like
aresemi-permeable
comparatively
fishways.
and fully permeable rubble wall conditions are comparatively analyzed,
analyzed, which could provide the basis for the engineering design and application of nature-like which could provide the basis
for the engineering design and application of nature-like fishways.
fishways.
2. Materials and Methods
2. Materials and
2. Materials and Methods
Methods
2.1. Experimental Arrangements and Instruments in the Model Test
2.1. Experimental Arrangements and Instruments in the Model Test
2.1. Experimental Arrangements and Instruments in the Model Test
Figure 1 shows a schematic diagram of the model design. The model included an impounding
pool,Figure
a test 11section
Figure
shows in a schematic
the fishway
shows a schematic
diagram
and aof
diagram
thepool.
oftail
model
the model The design. The and
tail pool
design.
model
The model theincluded
impounding
included
an impounding
pool were
an impounding
pool, a
connected test section in the fishway and a tail pool. The tail pool and the impounding pool were
pool, a testbysection
a groundwater reservoir.
in the fishway andFour fishway
a tail pool. The types,tailwith
poolimpermeable, semi-permeable
and the impounding pool were and
connected
fully permeableby a groundwater reservoir.
rubble walls, reservoir.
were arranged Four fishway
in the test types, with
section. impermeable,
The semi-permeable
cross-sectionsemi-permeable
of the fishway was and
connected by a groundwater Four fishway types, with impermeable, and
fully permeable
trapezoidal, as rubble
shown walls,
in Figure were 1. arranged
The length in the
of test
the section.
fishway The
test cross-section
section (L) was of
17 the
m, fishway
including was
a
fully permeable rubble walls, were arranged in the test section. The cross-section of the fishway was
trapezoidal,
total as
of 11 fishway shown in
pools, Figure
and the 1. The length of the fishway test section (L) was 17 m, including a
trapezoidal, as shown in Figure 1. longitudinal
The length ofslope (J) was 1%.
the fishway test The bottom
section and17
(L) was them,side slope ofa
including
totalfishway
the of 11 fishway pools, andby
were smoothed theconcrete.
longitudinal The slope
bottom (J) width
was 1%. The bottom and the side slope of the
total of 11 fishway pools, and the longitudinal slope (J) was (a)
1%.wasThe0.75 m,
bottom and
andthetheside
sideslope
slope(iofa)
fishway
was were
1:2.5. The smoothed by concrete. The bottom width (a) was 0.75 m, and the side slope (i a ) was
the fishway wereflow velocitybyand
smoothed flow The
concrete. patternsbottom were analyzed,
width (a) wasas0.75described
m, and thein the
sidefollowing
slope (ia)
1:2.5. The flow
paragraphs, byvelocity
taking and
the flow
fish andpatterns and
channel werethe analyzed, as described
intermediate pondas in
inthe
thefollowing
fishway paragraphs, by
was 1:2.5. The flow velocity flow patterns were analyzed, described in test
the section
following as
taking
typical the fish
research channel
objects.and the
Figure intermediate
2 shows a pond
picture in
of the
the fishway
original test section
experimental as typical
model. research objects.
paragraphs, by taking the fish channel and the intermediate pond in the fishway test section as
Figure 2 shows a picture of the original experimental model.
typicalEletromagnetic
researchFlowmeter
objects.Control
Figure
valve
2 shows a picture of the original experimental model.
Eletromagnetic Flowmeter Control valve
Sluice Gate
Sluice Gate L
fishway test
L section
Baffle Tailwater Control Gate
fishway
J=1%test section
Baffle Tailwater Control Gate
A
J=1%
A
Impounding Pool A Tailwater Pool
Fishway Baffle Wall
Impounding Pool A Tailwater Pool
:2.5
Fishway Baffle Wall a ia=1
:2.5
a ia=1
A-A
A-A
Groundwater Reservoir
Groundwater Reservoir
Figure 1. Scheme of the experimental flume, representing a side view of the channel on a slope of 1%
Figure 1. Scheme of the experimental flume, representing a side view of the channel on a slope of 1%
with
Figurethe location of the
impounding area, test area and tailwater area.
view“A” represents the cross section
with the1.location
Scheme of experimental
impounding area,flume, representing
test area a side
and tailwater area. of the
“A” channel the
represents on across
slopesection
of 1%
number
with the and “A-A”
location ofrefers to the cross
impounding area, section
test of the
area and experimental
tailwater flume
area. “A” with a 1:2.5 side
represents the cross (ia). L =
slope section
number and “A-A” refers to the cross section of the experimental flume with a 1:2.5 side slope (ia ).
length
number ofand
the “A-A”
fishway test section;
refers to the J = longitudinal
cross of theslope; a = bottom width.
L = length of the fishway test section; Jsection
= longitudinal experimental flume
slope; a = bottom with
width.a 1:2.5 side slope (ia). L =
length of the fishway test section; J = longitudinal slope; a = bottom width.
Figure 2.2.Picture
Pictureof of
thethe
original experiment
original flumeflume
experiment without roughening,
without facing upstream.
roughening, The materials
facing upstream. The
of the bottom
materials and
Figure 2. ofPicture side
the bottom slope are concrete.
andoriginal
of the side slope are concrete.
experiment flume without roughening, facing upstream. The
materials of the bottom and side slope are concrete.
Water 2020, 12, 955                                                                                      4 of 15

    According to the uniform flow theory in an open channel, the roughness coefficient (n) of the
open channel can be expressed as:
                                             A 2/3 1/2
                                       n =     R i ,                                           (1)
                                             Q
     In the above formula, A is the wetted cross-sectional area of the open channel, Q is the flow
discharge, R is the hydraulic radius and i is the channel slope.
     According to the cross-sectional dimension of the model, the wetted cross-sectional area of the
open channel can be expressed as:

                                        A = h(b + mh) = h(0.75 + 2.5h),                                      (2)

      The corresponding wetted perimeter can be expressed as:
                                                p
                                      χ = b + 2h 1 + m2 = 0.75 + 5.3852h,                                    (3)

      The corresponding hydraulic radius can be expressed as:

                                                      A   h(0.75 + 2.5h)
                                           R =          =                .                                   (4)
                                                      χ   0.75 + 5.3852h

      In the above formula, h is the depth of the water, b is the width of the bottom, m is the slope ratio
of the channel and χ is the wetted perimeter. The literature indicates that when the angle between the
slope and the horizontal is less than 6◦ , the hydraulic gradient J can be used as an approximation to
replace the channel gradient I; therefore, the channel roughness value can be solved by knowing the
upstream flow rate and the uniform flow depth.
      By adjusting the water depth and flow rate in the channel, the channel roughness was calculated
using three scenarios (Table 1). Scenario I was the original scheme with no roughening, and the average
roughness of the channel was measured to be 0.012, as shown in Table 1. In actual engineering, in
order to reduce the flow velocity in the fishway pool, sand gravels are usually laid at the bottom and
slope of the pools, which can increase the roughness of the fishway and bring the flow information in
the fishway much closer to a natural river channel.

      Table 1. Roughness calculation table of the test under three schemes with nine scenarios. “Original
      roughness” represents a scheme without roughening. “Bottom roughness” refers to a scheme with
      roughening at the bottom only. “Overall roughness” refers to a scheme with roughening at the bottom
      and side slope all. “-I, -II and –III” represent different scenarios under diverse flow rates.

                                         Flow Rate          Depth of Water   Roughness   Average Roughness
           Scheme          Scenario
                                          Q (m3 /s)             h (m)            n               n
                             I-1           0.057                0.055          0.0111
      Original roughness     I-II          0.045                0.049          0.0115          0.012
                             I-III         0.024                0.035          0.0121
                             II-I          0.057                0.081          0.0219
       Bottom roughness      II-II         0.045                0.073          0.0231          0.023
                            II-III         0.027                0.054          0.0227
                             III-I         0.057                0.098          0.0308
       Overall roughness    III-II         0.043                0.085          0.0316          0.034
                            III-III        0.024                0.067          0.0372

     Scenario II represented the scheme with bottom roughening. During the test, concrete blocks
with an equivalent particle size of 2.0 cm were used to simulate sand gravel, and the spacing between
concrete blocks at the bottom of the channel was about 1 cm, as shown in Figure 3. After the concrete
blocks were laid at the bottom of the channel, the average value of roughness was increased to 0.023.
calculated using three scenarios (Table 1). Scenario I was the original scheme with no roughening,
and the average roughness of the channel was measured to be 0.012, as shown in Table 1. In actual
engineering, in order to reduce the flow velocity in the fishway pool, sand gravels are usually laid
at the bottom and slope of the pools, which can increase the roughness of the fishway and bring the
flow information in the fishway much closer to a natural river channel.
Scenario II represented the scheme with bottom roughening. During the test, concrete blocks
Water 2020, 12,
with955an equivalent particle size of 2.0 cm were used to simulate sand gravel, and the spacing 5 of 15
between concrete blocks at the bottom of the channel was about 1 cm, as shown in Figure 3. After the
concrete blocks were laid at the bottom of the channel, the average value of roughness was increased
In addition, according
to 0.023. to the
In addition, research
according results
to the researchpublished by Hou
results published et al.
by Hou [31],
et al. [31],the
the slope could
slope could be be further
roughenedfurther
by theroughened
quincunxbyroughening
the quincunx roughening
method. The method. The particle
equivalent equivalent
sizeparticle
of thesize of the material
roughened
roughened material was 2.0 cm, and the spacing between the particles was 12 cm. Therefore, an
was 2.0 cm, and the spacing between the particles was 12 cm. Therefore, an overall roughness test of the
overall roughness test of the channel was carried out (scenario III), and the concrete arrangement is
channel was showncarried out4.(scenario
in Figure The overallIII), and the
roughness concrete
of the channelarrangement
reached 0.034. is shown in Figure 4. The overall
roughness of the channel reached 0.034.
(a) (b)
Figure 3. Simulation
Figure 3. Simulation of sandof sand pebbles
pebbles at thebottom
at the bottom of
ofthe
thefishway: (a) Sand
fishway: pebblespebbles
(a) Sand in prototype; (b)
in prototype; (b)
Simulated sand pebbles in the test. The red circle means a local region in experimental flume.
Simulated sand
Water 2020, pebbles
12, x FOR in the test. The red circle means a local region in experimental flume.
PEER REVIEW 5 of 15
12 cm
6 cm
12 cm
6 cm
(b)
(a)
Figure 4. Figure 4. Roughening
Roughening schemeof
scheme of the
theside
sideslope: (a) the
slope: (a)schematic diagram; (b)
the schematic simulated(b)
diagram; result in the
simulated result in
test.
the test.
Table 1. Roughness calculation table of the test under three schemes with nine scenarios. “Original
2.2. Structural Designrepresents
roughness” of the Pool in thewithout
a scheme Fishwayroughening. “Bottom roughness” refers to a scheme with
roughening at the bottom only. “Overall roughness” refers to a scheme with roughening at the
One of bottom
the main features of the nature-like fishway is the use of natural stones to construct the
and side slope all. “-I, -II and –III” represent different scenarios under diverse flow rates.
inner partition wall of the fishway. The wall can be constructed to be either permeable or impermeable.
Flow Rate Depth of Water Roughness Average Roughness
In this regard,Scheme
rounded Scenario
cobbles were Q (m3used
/s) to simulate
h (m) the permeablen rubble wall.
n The diameter of the
cobbles was 10–15Original
cm. A brick
I-1 wall was
0.057 used to simulate
0.055 the impermeable
0.0111 masonry wall. The specific
I-II 0.045 0.049 0.0115 0.012
layout was determined
roughness by comparing the two kinds of walls and their combined types. According
I-III 0.024 0.035 0.0121
to the research results onII-I the living habits of the
0.057 target fish, 0.0219
0.081 the migration characteristics of the four
Bottom
major Chinese carps
roughness
are different.
II-II Therefore,
0.045 this
0.073study added 0.0231a design scheme
0.023 using multiple fish
II-III 0.027 0.054 0.0227
passages to complicate the flow pattern and improve the selectivity of upstream migration paths for
III-I 0.057 0.098 0.0308
Overall in addition to the water permeability of the partition wall, different widths of the
fish. In this regard, III-II 0.043 0.085 0.0316 0.034
roughness
fish channel and differentIII-III numbers0.024 of fish passages 0.067 were comparatively
0.0372 studied through experimental
investigation. The comparison schemes are shown in Table 2. Among them, case I was the arrangement
2.2. Structural Design of the Pool in the Fishway
of the water-impermeable partition wall, case II was the arrangement of the permeable partition wall,
and case IIIOne andofcase
the main features of the nature-like fishway is the use of natural stones to construct the
IV were the arrangements of the semi-permeable partition wall. The water
inner partition wall of the fishway. The wall can be constructed to be either permeable or
permeability of theInfully
impermeable. water-permeable
this regard, rounded cobblespartition
were used wall was the
to simulate 12%. The schematic
permeable rubble wall. diagram
The of the
layout ofdiameter
each caseof theis cobbles
shownwas in Figure
10–15 cm. 5.AFrom Table
brick wall was2,used
it is to
seen that the
simulate theimpermeable
thickness of the partition wall
masonry
wall. The
was different, butspecific layout was
the height wasdetermined
the same.byThis comparing the twothe
is because kinds of walls and
thickness their combined
depended on the structural
types. According to the research results on the living habits of the target fish, the migration
stability, and the height was due to the water level. If the height was different, it would affect the
characteristics of the four major Chinese carps are different. Therefore, this study added a design
discharge and flow
scheme using velocity.
multiple fish However,
passages to thecomplicate
influence theofflow
thepattern
thickness could be
and improve theignored because
selectivity of the key
upstream migration paths for fish. In this regard, in addition to the water permeability of the
partition wall, different widths of the fish channel and different numbers of fish passages were
comparatively studied through experimental investigation. The comparison schemes are shown in
Table 2. Among them, case I was the arrangement of the water-impermeable partition wall, case II
was the arrangement of the permeable partition wall, and case III and case IV were the
arrangements of the semi-permeable partition wall. The water permeability of the fully
water-permeable partition wall was 12%. The schematic diagram of the layout of each case is shown
Water 2020, 12, 955                                                                                                              6 of 15

factor of the effect on hydraulics in the pool was the uniformity of the pool length, which had a value
of 1 m in the present study.

(1)   Case I: The partition wall was constructed by impermeable brick. The layout of the wall was
      referenced to the layout of the vertical slot fishway. The fish passage was located on the left side
      of the river channel. The direction of the fish passage was 45◦ with the main channel, and the
      opening width was b = 0.20 m. The spacing of the brick walls at each level was s = 1.0 m, the
      height was h = 0.30 m and the thickness was d = 0.24 m.
(2)   Case II: The partition wall was fully permeable and piled by cobbles, and the fish passage was
      located on the left side of the river channel. The direction was 45◦ with the main channel, and the
      width was b = 0.20 m, the spacing of the cobble walls at each level was s = 1.00 m, the height was
      h = 0.30 m and the thickness was d = 0.30 m.
(3)   Case III: The partition wall was semi-permeable. The height of the bottom impermeable layer
      was h1 = 0.15 m, the height of the upper permeable layer was h2 = 0.15 m, the fish passage was
      located on one side of the bottom and the width of the fish passage was b = 0.20 m. The spacing
      of the rubble walls at each level was s = 1.0 m, and the thickness was d = 0.12 m.
(4)   Case IV: the height and width of the piled wall were the same as those in case III. However,
      the number of fish passages was increased to two, with a new fish passage arranged beside the
      original one. Even so, the total cross-sectional area of the fish passages remained the same. The
      width of the middle fish passage was b1 = 0.10 m, and the side fish passage width b2 was about
      0.20 m. In order to reduce the discharge for the fishway, the fish passages adopted an upstream
      and downstream staggered arrangement.
            Water 2020, 12, x FOR PEER REVIEW                                                                          6 of 15

                                                                        s

                                                                                                   side
                                                                                                  slope

                                                                              fish passage
                                                     b

                                                 d
                                                            (a) Cases I–III
                                                                                  s
                                 side-fish passage

                                                                                               side
                                                            b2                                slope

                                                           b1

                                                                middle-fish passage
                                                             (b) Case IV
                  Figure 5. Schematic diagram of the layout of every scheme from a top view. (a) Nature-like fishway
      Figure 5. Schematic         diagram of the layout of every scheme from a top view. (a) Nature-like fishway
                  with one fish passage; (b) nature-like fishway with two fish passages. b = width of fish passage for
      with one fish    passage; (b) nature-like fishway with two fish passages. b = width of fish passage for
                  case I-III; b1 = width of middle-fish passage for case IV; b2 = width of side-fish passage for case IV; s =
                  b1 = width
      case I-III; length  of a pool;ofdmiddle-fish     passage
                                       = thickness of the partitionfor case IV; b2 = width of side-fish passage for case IV;
                                                                    wall.
      s = length of a pool; d = thickness of the partition wall.
                 Table 2. Layout parameters of every comparison scheme. “Impermeable” water permeability means
                 the partition walls are constructed by brick only. “Fully permeable” means the partition walls are
                 constructed by cobbles only. “Semi-permeable” means the partition walls are constructed by brick
                 and cobbles. Substrates dimensions: brick = 24 cm long × 11.5 cm wide × 53 cm high; cobbles = 10 to 15
                 cm.

                                      Partition Wall                        Length                   Fish Passage
           Layout
                           Water           Thickness       Height           of Pool                   Width
           Scheme                                                                      Quantity                     Location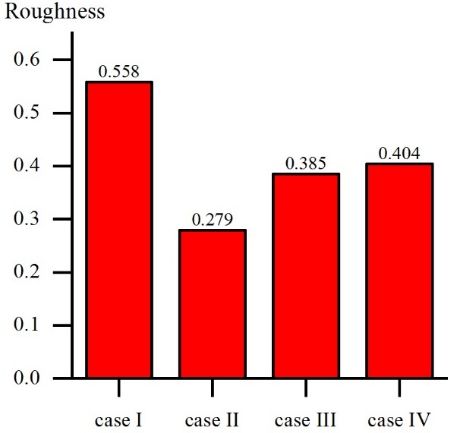
Water 2020, 12, x FOR PEER REVIEW 7 of 15
opening width was b = 0.20 m. The spacing of the brick walls at each level was s = 1.0 m, the
height was h = 0.30 m and the thickness was d = 0.24 m.
(2) Case II: The partition wall was fully permeable and piled by cobbles, and the fish passage was
Water 2020, 12, 955 7 of 15
located on the left side of the river channel. The direction was 45° with the main channel, and
the width was b = 0.20 m, the spacing of the cobble walls at each level was s = 1.00 m, the height
was h2.= Layout
Table 0.30 mparameters
and the thickness was d = 0.30scheme.
of every comparison m. “Impermeable” water permeability means
(3) the
Case III: Thewalls
partition partition wall was by
are constructed semi-permeable.
brick only. “Fully The height ofmeans
permeable” the bottom impermeable
the partition walls arelayer
constructed
was h1 = 0.15 by cobbles
m, the only.
height “Semi-permeable” means the partition
of the upper permeable layer was walls
h2 =are constructed
0.15 m, the fish by brick
passageand was
cobbles. = long × 11.5 cm wide ×
located on one side of the bottom and the width of the fish passage was b = 0.20 m. The cm.
Substrates dimensions: brick 24 cm 53 cm high; cobbles = 10 to 15 spacing
of the rubble wallsPartitionat eachWalllevel was s = 1.0 m, and the thickness was d = 0.12 m.
Fish Passage
Layout Length of Pool
(4)Scheme
Case IV:Waterthe height and
Permeability width
Thickness (m) of the (m)
Height piled wall(m)were theQuantity
same asWidththose (m)in case III.Location
However, the
number of fish passages was increased to two, with a new fish passage arrangedmain
Case I Impermeable 0.24 0.30 1.00 1 0.20 Stand by the beside
channel the
Case II Fully permeable 0.30 0.30 1.00 1 0.20 Stand by the main channel
original one. Even so, the total cross-sectional area of the fish passages remained the same. The
Case III Semi-permeable 0.12 0.15 + 0.15 1.00 1 0.20 Stand by the main channel
width of
Case IV
the middle fish0.12passage0.15was
Semi-permeable
b1 = 0.101.00
+ 0.15
m, and the side 2
fish passage width
0.10–0.20
b2 was about
Staggered arrangement
0.20 m. In order to reduce the discharge for the fishway, the fish passages adopted an upstream
and downstream staggered arrangement.
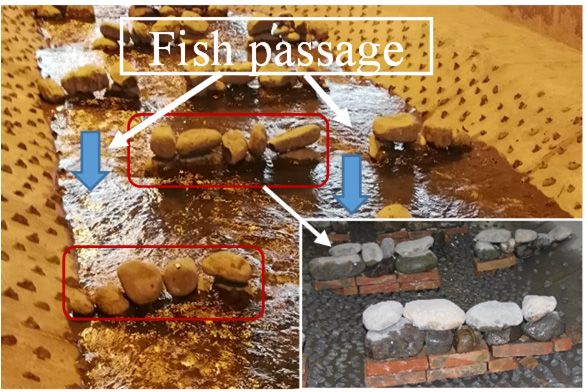
The schematic diagram of the layout of the rubble walls of each scheme is shown in Figure 6.
The schematic diagram of the layout of the rubble walls of each scheme is shown in Figure 6.
fish passage fish passage
brick wall cobble wall
h h
Case I Case II
fish passage
side-fish passage middle-fish passage
brick wall cobble wall brick wall b1
b2 cobble wall
h2 h2
h1 h1
Case III Case IV
(a)
Impermeable fishway Fully permeable fishway Semi-permeable fishway
(b)
Figure 6.6. Layout
Layoutplanplanof of rubble
rubble wallwall
withwith different
different materials:
materials: (a) schematic
(a) schematic diagram;diagram; (b)pictures
(b) layout layout
pictures
in in thetest.
the model h = test.
model heighth =ofheight of the partition
the partition wall for wall
case for
I andcase I and
case 1 =
II. hcase II. h
height1 = height
of the of the
bottom
bottom impermeable layer for case III and case
impermeable layer for case III and case IV; h =
2 IV; h2 = height of the upper permeable layer for case
height of the upper permeable layer for case III and
case IV.case IV.
III and
2.3. Method
During the test, the water level profile in each pool was tested with a steel ruler manufactured by
Hynix. The test position was located downstream of the partition wall and contained three measuring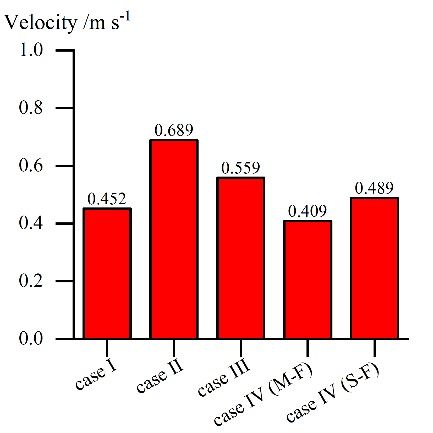
Water 2020, 12, 955                                                                                                8 of 15

points at the left, middle and right of the cross-sections. The test accuracy of the steel ruler was 0.5 mm.
The discharge of the experimental flume was recorded by an electromagnetic flow meter produced by
Shanghai Guanghua Aihe Meite Instrument Co., Ltd., and its accuracy was ±0.02%. The velocity field
in the pool was measured with a two-dimensional (2D) electric magnetic velocity meter (ACM2-RS)
produced by JFE Advantech in Japan. The measurement accuracy was ±2%. To ensure the statistical
significance of the velocity record, velocity measurements were recorded at a frequency of 60 Hz for
a sampling period of 120 s for each point. Preliminary tests were conducted to define the sampling
period needed for an accurate determination of the mean velocity. The tested sampling periods ranged
from 20 to 180 s. It was found that velocity became almost constant for sampling periods greater than
60 s; therefore, a sampling time of 120 s was considered to be adequate for the determination of mean
velocities. Flow velocities were measured at the water surface, where z/h = 0.17, for a total of about 120
points located 0.10–0.20 m apart at the longitudinal and lateral direction separately.

3. Results
     From a hydraulics point of view, the nature-like fishway can be regarded as a section of open
channel, and its main hydraulic parameters are still water level, flow velocity and discharge [32].
Therefore, in the present study, the velocity, discharge and flow pattern were the main analysis indexes
for a uniform water level (0.30 m) in the fishway.

3.1. Roughness
      Channel roughness evaluation is very important in fishway hydraulics, especially for nature-like
fishways [33]. Velocity and discharge relationships are influenced by channel roughness [34]. For a
given slope, velocity increased as discharge increased and roughness decreased. The roughness values
for the fishways of the four schemes in this paper are illustrated in Figure 7. As shown in the figure,
the roughness value of case I is much larger than those of the other cases and is nearly double that of
case II. This is because the partition wall for case I was constructed by brick, which is an impermeable
material. When the partition wall was constructed by cobbles for case II, which is a fully permeable
material, the flow resistance was be decreased and the porosity increased. For cases III and IV, the
partition wall was constructed by a semi-permeable material, so the roughness was between the two
extremes (increasing by about 40% compared with that of case II and decreasing 30% compared with
that of case I). It should also be pointed out that the roughness values of case III and case IV were
nearly the same in spite of their different numbers of fish passages. This is because the porosity of the
partition
Water 2020, walls  was
            12, x FOR   theREVIEW
                      PEER  same for the two cases, and the flow areas were also uniform.          9 of 15

      Figure 7.
      Figure        Comparison
               7. Comparison    of of
                                    thethe   roughness
                                         roughness       for each
                                                     for each      configuration
                                                               configuration      tested,
                                                                             tested,      calculating
                                                                                     calculating       by discharge
                                                                                                 by discharge (0.027
      (0.027  m 3 /s−1 , 0.053 m3 /s−1 , 0.039 m3 /s−1 and 0.037 m3 /s−1 for cases I–IV, respectively), water depth
      m /s , 0.053 m /s , 0.039 m /s and 0.037 m /s for cases I–IV, respectively), water depth (0.3m) and
        3  −1            3  −1         3  −1              3 −1

      (0.3 m) and longitudinal
      longitudinal    slope (1%). slope (1%).

3.2. Discharge
     Discharge is one of the important indicators that need to be considered when a fishway project
is selected and implemented [35]. A larger discharge means that more abandoned water will be
generated from the gated dam, which will affect the operational benefits of the project. Figure 8
compares the results of the discharge under different fishway schemes. The results show that the
discharge of the fishway of each case was quite different. The discharge of the fishway constructed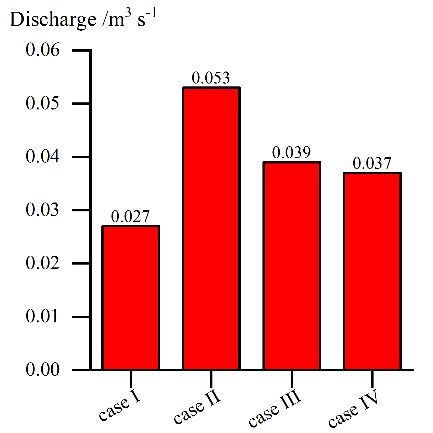
Figure 7. Comparison of the roughness for each configuration tested, calculating by discharge (0.027
Water 2020, 12, 955                                                                                           9 of 15
      m3/s−1, 0.053 m3/s−1, 0.039 m3/s−1 and 0.037 m3/s−1 for cases I–IV, respectively), water depth (0.3m) and
      longitudinal slope (1%).
3.2. Discharge
 3.2. Discharge
       Discharge is one of the important indicators that need to be considered when a fishway project
        Discharge
is selected     and is     one of the important
                        implemented                   indicators
                                          [35]. A larger             that need
                                                               discharge     means to be  considered
                                                                                        that             when a fishway
                                                                                             more abandoned                project
                                                                                                                    water will   be
generated from the gated dam, which will affect the operational benefits of the project. Figurebe
 is selected    and      implemented       [35].  A  larger    discharge     means      that more    abandoned      water  will   8
 generated the
compares       from       the gated
                     results   of thedam,     whichunder
                                        discharge      will affect     the fishway
                                                               different    operational      benefits
                                                                                        schemes.    The  ofresults
                                                                                                            the project.
                                                                                                                   show Figure
                                                                                                                          that the8
 comparesof
discharge      the
                 theresults
                        fishway of of
                                   theeach
                                        discharge
                                             case was under
                                                         quitedifferent
                                                                 different.fishway       schemes.
                                                                             The discharge          Thefishway
                                                                                                of the     resultsconstructed
                                                                                                                    show that theby
 discharge     of  the    fishway   of  each   case was    quite    different.   The   discharge   of
the impermeable partition wall was only 0.027 m /s (case I). The discharge of the fishway constructed
                                                                   3                                    the  fishway   constructed
 by athe
by          impermeable
       permeable                partition
                        partition   wall was wall   wasmonly
                                                 0.053             0.027
                                                           3 /s (case  II),m
                                                                              3/s (case I). The discharge of the fishway
                                                                           which      is twice the discharge of case I. When
 constructed
the  rubble wall  by awas  permeable
                               made ofpartition      wall was
                                         a combination             0.053 m /s cobbles
                                                              of permeable
                                                                             3    (case II),and
                                                                                              which    is twice the
                                                                                                 impermeable          discharge
                                                                                                                   material  (caseof
 case   I. When      the    rubble  wall   was   made     of  a  combination       of  permeable
III), the wetted cross-sectional area of the fishway channel was increased compared with that of thecobbles     and  impermeable
 material
case   I and(case     III), the wetted
              was reduced         compared cross-sectional
                                                with that of area      of so
                                                                case II,  thethefishway    channel
                                                                                   discharge   of thewas     increased
                                                                                                        fishway         compared
                                                                                                                  for case III was
 with    that  of   the    case  I and   was    reduced     compared       with     that  of
0.039 m /s. Compared with case III, the number of fishway channels was double in case IV, but
           3                                                                                 case  II,  so  the  discharge  of the
                                                                                                                                the
 fishway     for  case     III was  0.039   m 3/s. Compared with case III, the number of fishway channels was
total cross-sectional area of the fishway channels was unchanged. Under this condition, the discharge
 double
of         in casewas
    the fishway        IV, but   the total
                             reduced         cross-sectional
                                       to 0.037   m3 /s.          area of the fishway channels was unchanged. Under
 this condition, the discharge of the fishway was reduced to 0.037 m3/s.

                                                           3 −1
      Figure 8.8. Comparison
      Figure      Comparison of
                             of the
                                 the discharge
                                      dischargemagnitude
                                               magnitude(m
                                                         (m3 ss−1)) for
                                                                    for each
                                                                        each configuration
                                                                             configuration tested,
                                                                                           tested, using
                                                                                                   using an
                                                                                                         an
      electromagnetic flowmeter.
      electromagnetic flowmeter.

3.3. Flow Velocity
 3.3. Flow Velocity
      According to the basic principles for fishway design, the maximum flow velocity in the fishway
       According to the basic principles for fishway design, the maximum flow velocity in the
pond generally appears near the inlet of the fishway. Its size determines whether the fish can
 fishway pond generally appears near the inlet of the fishway. Its size determines whether the fish
successfully pass through the pool. The flow velocity in the fish passage is the main fishway design
 can successfully pass through the pool. The flow velocity in the fish passage is the main fishway
indicator, the value of which should not exceed the burst swimming speeds of the fish [36]. Figure 9
 design indicator, the value of which should not exceed the burst swimming speeds of the fish [36].
shows the comparison of the average flow velocity at the cross-section of the fish passage. In the figure,
 Figure 9 shows the comparison of the average flow velocity at the cross-section of the fish passage.
the velocities of flows M-F and S-F in case IV represent the average of the cross-sectional flow velocity
 In the figure, the velocities of flows M-F and S-F in case IV represent the average of the
in the middle fish passage and side fish passage (as shown in Figure 6), respectively. It can be seen
 cross-sectional flow velocity in the middle fish passage and side fish passage (as shown in Figure 6),
from the figure that the maximum flow velocity of the fishway occurred in case II, in which the flow
velocity reached 0.69 m/s. Under the other three schemes, the average flow velocity in the fish passage
was only 0.45–0.55 m/s.

3.4. Flow Pattern
     The flow pattern in a fishway is one of the key indicators affecting the migration rate [35–37]. The
distribution of the mainstream area in the pool should not be too concentrated, and it is not appropriate
to form a wide range of recirculation areas on both sides of the mainstream, so the fish in the rest
area can quickly find the mainstream and continue on their way. There should be more diverse flow
conditions in the rest area of a pool in order to mimic the natural environment, and it can provide a
place for fish to rest, forage and migrate. Figure 10 is the measured velocity vectors in the central pool
at the surface for the different cases. The magnitude and direction of the flow velocity in the pool were
measured at 2 cm below the water surface with a velocity meter (ACM2-RS). The magnitude of the flow
Water 2020, 12, 955 10 of 15
Water 2020, 12, x FOR PEER REVIEW 10 of 15
respectively. It can be seenbyfrom √
velocity, U, was calculated U =the figure
u2 + vthat themeasurement
2 at all maximum flow velocity
points in theofdetailed
the fishway occurred
measurement
area. Herein, u and v are the time-averaged streamwise and lateral velocities, respectively. average
in case II, in which the flow velocity reached 0.69 m/s. Under the other three schemes, the
flow velocity in the fish passage was only 0.45–0.55 m/s.
p
= = √uu2 + 2 −1
Figure 9.9. Comparison
Figure Comparisonofofthe themean
meanwater
watervelocity magnitude
velocity magnitude(U (U + vv ),, m
m ss−1)) for
for each
each
configuration
configuration tested
tested at
at the
the cross-section
cross-section of
of the
thefish
fishpassage,
passage,using
usingaatwo-dimensional
two-dimensional (2D)(2D)electric
electric
magnetic
magneticvelocity
velocitymeter.
meter. U =Umean waterwater
= mean velocity magnitude;
velocity u = time-averaged
magnitude; streamwise
u = time-averaged velocity;
streamwise
Water 2020, 12, x FOR PEER REVIEW 11 of 15
= time-averaged
vvelocity; lateral velocity.
v = time-averaged lateral velocity.
(a) Boundary 1.0 m/s
3.4. Flow Pattern
0.05
0.07
The flow pattern in a fishway is one of the key indicators affecting Recirculation
the migration rate [35–37].
High zone
The distribution of the mainstreamVelocity area in 0.40the pool
0.35 should 0.45 not be too concentrated, and it is not
appropriate to form a wide range of recirculation 0.15 areas on both sides of the mainstream, so the fish
in the rest area can quickly Impermeable
find the mainstream and continue on their way. There should be more
0.09
wall
diverse flow conditions in the rest area of a pool in0.10order to mimic the natural environment, and it
can provide a place for fish to rest, forage and migrate. Figure 10 is the measured velocity vectors in
Boundary
the central pool at the surface for the different cases. The magnitude and direction of the flow
(b) Boundary 1.0 m/s
velocity in the pool were measured at 2 cm below the water surface with a velocity meter
Recirculation
(ACM2-RS). The magnitude of the flow velocity, 0.05
0.05
U, was calculated zone by U = √u + v at all
measurement points inHigh the detailed measurement area. Herein, u and v are the time-averaged
0.67
streamwise and lateral Velocity
velocities, respectively. 0.51 0.65
Under the impermeable condition (case I), the flow pattern distribution was basically the same
0.04 Low Velocity
as that of the technicalPermeablefishway [38]. The 0.04 flow velocity distribution was relatively simple, the
mainstream area was concentrated, wall and two recirculation zones were formed in the rest zone, as
Boundary
shown in Figure 10a. The flow velocity in the zone between the mainstream and backflow was close
to zero. In contrast to the flow pattern of (c) case I,Boundary when the partition 1.0 m/s
wall was constructed by fully- or
Mainstream2
semi-water-permeable material, such as in 0.48 cases 0.43 II and III, High more Velocity
diverse flow conditions were
formed at the surface of the pool.
Low Velocity Figure 10b shows
0.21 that the mainstream was no longer concentrated,
and the two recirculation zones on both sides of the mainstream diminished or disappeared. 0.42
However, there was stillMainstream1
a relatively high 0.43 flow velocity 0.14
zone Semi-permeable
at the fish passage, which would
exceed the critical swimming speed of most migratory wall
0.15 fish for a project in China. On the basis of the
hydraulic theory, if the discharge
High Velocityis uniform, 0.35 then the larger the flow area, the smaller the flow
velocity. Hence, in the present study, an increase Boundary in the number of fish passages was put forward to
increase the flow area. In order to control the discharge and flow velocity, two fish passages were
Figure 10. Measured velocity vectors in the central pool at the surface for (a) case I; (b) case II/III; (c)
Figure left
staggered 10. Measured velocity vectors in the central poolfoundat the surface for (a) case I; (b) case II/III; (c)
case IV. Theand
unitsright,
of theas shown
values in Figure
in small 6. It was
black rectangles are m/s that all. two mainstreams were formed in
case IV. The units of the values in small black rectangles are m/s all.
the fishway for the case with two fish passages, as shown in Figure 10c. Three flow regions were
formed
Underin the
the pool by the two
impermeable mainstreams,
condition (case I),with the flow two pattern
high flow velocity regions
distribution and one
was basically thelow
same flow
as
4. Discussion
velocity
that of theregion. The
technical flow velocity
fishway [38]. Theinflowthe velocity
low flowdistribution velocity region was about
was relatively 0.02–0.30
simple, m/s, and a
the mainstream
weak
area Discharge,
was flow zone
recirculation
concentrated, velocity
wasand
and two flow pattern
formed
recirculation inside zones are
the were key
region, indicators
formed in thefor
which restfishway
could asdesigns
serve
zone, as a rest
shown [39].
in On 10a.
zone
Figure the
for
basis
The of physical
migratory
flow velocity inexperiments,
fish. The average
the flow
zone betweenthevelocity
present inpaper
the mainstream the high analyzes
andvelocity theregions
backflow differences in
was about
was close key0.50
to zero. indicators
In m/s, for
which
contrast to
nature-like fishways under
meets the swimming speed four
of mostkinds of partition
migratory fish in walls
China. with different water permeabilities. From
the analysis of the discharge, although the total cross-sectional area of the fish passage was the
same, it was found that the discharge of the nature-like fishway with the permeable partition wall
was much larger than that of the fishway with the impermeable partition wall. This was because the
gaps inside the permeable partition walls piled with cobbles increased the wetted cross-sectionalWater 2020, 12, 955 11 of 15
the flow pattern of case I, when the partition wall was constructed by fully- or semi-water-permeable
material, such as in cases II and III, more diverse flow conditions were formed at the surface of the
pool. Figure 10b shows that the mainstream was no longer concentrated, and the two recirculation
zones on both sides of the mainstream diminished or disappeared. However, there was still a relatively
high flow velocity zone at the fish passage, which would exceed the critical swimming speed of most
migratory fish for a project in China. On the basis of the hydraulic theory, if the discharge is uniform,
then the larger the flow area, the smaller the flow velocity. Hence, in the present study, an increase in
the number of fish passages was put forward to increase the flow area. In order to control the discharge
and flow velocity, two fish passages were staggered left and right, as shown in Figure 6. It was found
that two mainstreams were formed in the fishway for the case with two fish passages, as shown in
Figure 10c. Three flow regions were formed in the pool by the two mainstreams, with two high flow
velocity regions and one low flow velocity region. The flow velocity in the low flow velocity region
was about 0.02–0.30 m/s, and a weak recirculation zone was formed inside the region, which could
serve as a rest zone for migratory fish. The average flow velocity in the high velocity regions was about
0.50 m/s, which meets the swimming speed of most migratory fish in China.
4. Discussion
Discharge, flow velocity and flow pattern are key indicators for fishway designs [39]. On the basis
of physical experiments, the present paper analyzes the differences in key indicators for nature-like
fishways under four kinds of partition walls with different water permeabilities. From the analysis of
the discharge, although the total cross-sectional area of the fish passage was the same, it was found that
the discharge of the nature-like fishway with the permeable partition wall was much larger than that
of the fishway with the impermeable partition wall. This was because the gaps inside the permeable
partition walls piled with cobbles increased the wetted cross-sectional area of the fishway. Under
the same running water depth, nature-like fishways with a permeable wall needed to consume more
water than that consumed with a watertight partition wall. In addition, the local water head loss of the
permeable partition wall was reduced by more than that of the impermeable partition wall, thereby
further increasing the discharge of the fishway, which in turn led to an increase in the flow velocity in
the fishway as shown in Figure 10. When the water permeability was 12%, calculations of the flow
area of the permeable partition wall showed that the discharge was 0.053 m3 /s, the mean flow velocity
at the fish passage was 0.689 m/s and the mean velocity in the gaps between the cobbles was about
0.3 m/s, which is consistent with the simulation results in the literature [40]. When the partition wall
was semi-permeable, the discharge of the nature-like fishways was reduced compared with that of
nature-like fishways with a fully permeable partition wall, but it was larger than that of fishways with
an impermeable partition wall. For the condition in which the nature-like fishway contained two fish
passages arranged in an interlaced manner, the discharge did not increase much compared with the
single fish passage condition, but the mainstream velocity was significantly reduced.
Discharge of the fishway affects the operational efficiency of a dam project. Moreover, the flow
velocity in the fish passage will determine whether the fish can migrate back, and the flow pattern is
the key factor in determining the duration of fish migration [41]. The experimental results showed that
when the partition wall was impermeable, the flow pattern in the pool was single, which is similar
to that of the technical fishway [39]. However, the motivation for the construction of nature-like
fishways is to enrich the flow pattern in the fishway so that it mimics the flow pattern in a natural
river [13,16,37]. In other words, nature-like fishways that use impermeable partition walls will not
produce hydrodynamic and morphological properties that are similar to those of natural rivers, which
are best-suited to the original purpose of fishways. From the perspective of discharge and flow
velocity control, this paper proposes a new kind of fish passage arrangement with semi-permeable
partition walls. The related hydraulic indicators for a fishway with a single fish passage and two
fish passages were compared and analyzed. The study found that when using two fish passages,
the discharge and cross-sectional flow velocity of the fishway were reduced, and two mainstreamsWater 2020, 12, 955 12 of 15
were formed in the fishway pool. Some studies have found that fish generally tend to avoid flows
with unpredictable high-velocity fluctuations or recirculation flow that interferes with swimming
trajectories [2,42,43]. From the prior analyses, it was found that obvious recirculation flow was formed
for the nature-like fishway of types I, II and III, which is disadvantageous for fish migration. In
contrast, the two fish passages in the type IV nature-like fishway were in an interlaced arrangement,
the flow information in the pool became more complex (including some small vertical eddies and
back-flow swirls), and no obvious recirculation zones were formed, which is conducive to the migration
of fish. Furthermore, water flows past the cobbles and velocity gradients are created, which form
small vortices that interact with each other and decay over different time courses. Many studies have
shown that small vortical flows provide an energy-rich environment that can be exploited to enhance
swimming performance [41,44,45]. It could be concluded that, compared with the other three types of
nature-like fishways explored in the present study, type IV is much more suitable for fish migration.
In addition, the two fish passages had different bottom elevations and widths, which can provide
favorable conditions for the upstream migration of fish with different sizes and body types. In the
migration season, different species of fish of various sizes and habits need to run upstream in rivers.
Some fish like swimming on the water surface, and some like swimming on the bottom. Because of the
larger width and high bottom elevation, the side passage of type IV is advantageous for fish swimming
on the water surface to successfully negotiate the fish passage, especially bigger fish. In contrast, the
middle passage is only suitable for little fish because of the small width, but this applies to all fish,
regardless of whether they swim on the surface or the bottom.
Under the premise that the plane dimensions and the slope of the fishway are given, the
relationship among discharge, flow velocity and water depth is reflected by the roughness factor
(n). If the roughness is low, the flow velocity in the fishway will be high, and the presence of large
high velocity regions could make it difficult for protected fish to complete upstream migration. At
the same time, if the flow velocity is higher under the same flow discharge, the water depth will be
shallower, but it is necessary to keep sufficient water depth in the fishway by using a larger flow
discharge. However, if the roughness is too high, the water surface elevation will be higher than that
with low roughness, which may induce a lower flow velocity. In terms of the swimming habits of fish,
lower velocity flow would be less attractive for migration, which will result in low efficiency of the
nature-like fishway [46,47]. It can be seen that for nature-like fishways, the first necessity is to find
an appropriate range of roughness values to form a generally uniform flow structure throughout the
water depth. The calculation results of the overall roughness for the fishways of the four schemes in
this paper are shown in Figure 7. Combined with the previous analysis, it is well recognized that all
four flow schemes can form a suitable flow pattern in the fishway. Different roughness coefficients
correspond to different discharges and flow velocities for the fishway.
5. Conclusions
This paper proposes four nature-like fishway types arranged with impermeable, fully permeable
and semi-permeable partition walls, and it compares the hydraulic characteristics of the various
fishways through physical experiments. The comparative study found that if the partition wall in
the fishway is constructed by permeable materials, then more discharge will be needed, and the flow
velocity in the fish passage will be larger than that of a fishway constructed by permeable materials.
However, the flow pattern information is more complex, with some small vortical flows, especially for
the fishway with two fish passages. In order to decrease the discharge and flow velocity, the nature-like
fishway could be constructed by semi-permeable materials. The present study focused primarily
on flow characteristics in a nature-like fishway, such as the roughness, flow velocity and discharge.
In recent years, researchers have identified some important turbulence parameters in relation to fish
passage, e.g., turbulence intensity, turbulent kinetic energy, Reynolds shear stress, vorticity and eddy
sizes [26,48]. Therefore, the turbulence characteristics in the nature-like fishways described in theWater 2020, 12, 955 13 of 15
present paper should be studied next. In addition, experiments with specific fish to evaluate the
efficiency of nature-like fishways should also be performed.
Author Contributions: T.Z. performed the laboratory work, did the analysis and prepared the manuscript; Z.N.
did the analysis, contributed to manuscript preparation and English version writing; J.S. and S.S. performed the
laboratory work and provided the funding; H.L. and G.L. contributed to the laboratory and the analysis work. All
authors have read and approved the final manuscript.
Funding: The research in this paper is funded by the National Key Research and Development Program of
China (no. 2016YFC0401708 and 2018YFC1505004), the National Key Laboratory Team Key Project of China (no.
SKL2018ZY08), the Fundamental Research Funds for IWHR (no. HY0145B162019), the Fundamental Research
Funds for the Central Universities (no. YJ201832), the National Natural Science Foundation of China (no. 51679261,
51709278), and the Sichuan application basic research project (no. 20YYJC4057).
Conflicts of Interest: The authors declare no conflict of interest.
References
1. Clay, C.H. Design of Fishways and Other Fish Facilities, 2nd ed.; CRC Press: Boca Raton, FL, USA, 1994.
2. FAO; DVWK. Fish Passes–Design, Dimensions and Monitoring (English version of DVWK); FAO: Roma, Italy, 2002.
3. Chen, K.Q.; Chang, Z.N.; Cao, X.H.; Ge, H.F. Status and prospection of fish pass construction in China.
J. Hydraul. Eng. 2012, 43, 182–188.
4. Zheng, T.G.; Sun, S.K.; Liu, H.T.; Jiang, H.; Li, G.N. Location choice of fishway entrance in hydropower
project based on fish behavioristics and hydraulics. Trans. Chin. Soc. Agric. Eng. (Trans. CSAE) 2016, 32,
164–170.
5. Katopodis, C.; Williams, J.G. The development of fish passage research in a historical context. Ecol. Eng.
2011, 48, 8–18. [CrossRef]
6. Sun, S.K.; Zhang, G.Q. Environment-friendly fishway in close-to-nature types. J. China Inst. Water Resour.
Hydropower Res. 2012, 10, 41–47.
7. Bunt, C.M.; Castro-Santos, T.; Haro, A. Performance of fish passage structures at upstream barriers to
migration. River Res. Appl. 2012, 28, 457–478. [CrossRef]
8. Katopodis, C.; Kells, J.A.; Acharya, M. Nature like and conventional fishways: Alternative concepts?
Can. Water Resour. J. 2001, 26, 211–232. [CrossRef]
9. Stephan, U.; Schotzko, N.; Haunschmid, N.; Petz-Glechner, R.; Ullmann, M. Development of a fish migration
ramp-Field and laboratory experiments. In Proceedings of the 6th International Symposium on Ecohydraulics,
Christchurch, New Zealand, 19–23 February 2007.
10. Link, O.; Sanhueza, C.; Arriagada, P.; Brevis, W.; Laborde, A.; González, A.; Wilkes, M.; Habit, E. The fish
Strouhal number as a criterion for hydraulic fishway design. Ecol. Eng. 2017, 103, 118–126. [CrossRef]
11. Baek, K.O.; Ku, Y.H.; Kim, Y.D. Attraction efficiency in natural-like fishways according to weir operation and
bed change in Nakdong River, Korea. Ecol. Eng. 2015, 84, 569–578. [CrossRef]
12. Jungwirth, M. Bypass channels at weirs as appropriate aids for fish migration in rhithral rivers. Regul. Rivers
Res. Manag. 1996, 12, 483–492. [CrossRef]
13. Bretón, F.; Baki, A.B.M.; Link, O.; Zhu, D.Z.; Rajaratnam, N. Flow in nature-like fishway and its relation to
fish behaviour. Can. J. Civ. Eng. 2013, 40, 567–573. [CrossRef]
14. Aarestrup, K.; Lucas, M.C.; Hansen, J.A. Efficiency of a nature-like bypass channel for sea trout (Salmo trutta)
ascending a small Danish stream studied by PIT telemetry. Ecol. Freshw. Fish 2010, 12, 160–168. [CrossRef]
15. Kim, J.H.; Yoon, J.D.; Baek, S.H.; Park, S.H.; Lee, J.W.; Lee, J.A.; Jang, M.H. An efficiency analysis of a
nature-like fishway for freshwater fish ascending a large Korean river. Water 2016, 8, 3. [CrossRef]
16. Wang, R.W.; Hartlieb, A. Experimental and field approach to the hydraulics of nature-like pool-type fish
migration facilities. Knowl. Manag. Aquat. Ecosyst. 2011, 400, 5. [CrossRef]
17. Larinier, M.; Travade, F.; Porcher, J.P. Fishways: Biological basis, design criteria, and monitoring. Bulletin
Français de la Pêche et de la Pisciculture 2002, 364, 1–208.
18. Haro, A.; Franklin, A.; Castro-santos, T.; Noreika, J. Design and Evaluation of Nature-Like Fishways for
Passage of Northeastern Diadromous Fishes. S. O. Conte Anadromous Fish Research laboratory (CAFRL),
U.S. Geological Survey, Biological Resource Division. NOAA Final Report; 2008; pp. 1–35. Available online:
https://repository.library.noaa.gov/view/noaa/4015/noaa_4015_DS1.pdf (accessed on 27 March 2020).You can also read