US Roadshow Presentation November 2017 - Pennon Group
←
→
Page content transcription
If your browser does not render page correctly, please read the page content below
US Roadshow Presentation
November 2017

                           © Pennon Group plc 2017
Disclaimer
For the purposes of the following disclaimers, references to this “document”            risks, maintaining finance and funding to meet ongoing commitments, tax
shall mean this presentation pack and shall be deemed to include references             compliance and contributions and difficulty in recruitment, retention and
to the related speeches made by or to be made by the presenters, any                    development of appropriate skills which are required to deliver the Group’s
questions and answers in relation thereto and any other related verbal or               strategy.
written communications.
                                                                                        Forward looking statements should therefore be construed in light of such risks,
This document contains certain “forward-looking statements” with respect to             uncertainties and other factors and undue reliance should not be placed on
Pennon Group’s financial condition, results of operations and business and              them. Nothing in this document should be construed as a profit forecast.
certain of Pennon Group's plans and objectives with respect to these matters
                                                                                        All written or verbal forward-looking statements, made in this document or made
which may constitute “forward-looking statements” within the meaning of the
                                                                                        subsequently, which are attributable to Pennon Group or any other member of
U.S. Private Securities Litigation Reform Act of 1995 (the “PSLRA”).
                                                                                        the Pennon Group or persons acting on their behalf are expressly qualified in
Forward-looking statements are sometimes, but not always, identified by their           their entirety by the factors referred to above. Pennon Group may or may not
use of a date in the future or such words as “anticipate”, “aim”, “believe”,            update these forward-looking statements.
“continue”, “could”, “due”, "estimate“, “expect”, “forecast”, “goal”, “intend”,
                                                                                        This document is not an offer to sell, exchange or transfer any securities of
"may", “plan", “project”, “seek”, “should”, “target”, “will” and related and similar
                                                                                        Pennon Group or any of its subsidiaries and is not soliciting an offer to purchase,
expressions, as well as statements in the future tense.
                                                                                        exchange or transfer such securities in any jurisdiction.
By their very nature forward-looking statements are inherently unpredictable,
                                                                                        Without prejudice to the above, whilst Pennon Group accepts liability to the
speculative and involve risk and uncertainty because they relate to events and
                                                                                        extent required by the Listing Rules, the Disclosure Rules and the Transparency
depend on circumstances that will or will not occur in the future. Various known
                                                                                        Rules of the UK Listing Authority for any information contained within this
and unknown risks, uncertainties and other factors could lead to substantial
                                                                                        document which the Company makes publicly available as required by such
differences between the actual future results, financial situation development or
                                                                                        Rules:
performance of the Group and the estimates and historical results given herein.
Undue reliance should not be placed on forward-looking statements which are             a) neither Pennon Group nor any other member of Pennon Group or persons
made only as of the date of this document. Important risks, uncertainties and              acting on their behalf shall otherwise have any liability whatsoever for loss
other factors that could cause actual results, performance or achievements of              howsoever arising, directly or indirectly, from use of the information
Pennon Group to differ materially from any outcomes or results expressed or                contained within this document;
implied by such forward-looking statements are changes in law, regulation or
decisions by governmental bodies or regulators, non-recovery of customer debt,          b) neither Pennon Group nor any other member of Pennon Group or persons
poor operating performance due to extreme weather and climate change, poor                 acting on their behalf makes any representation or warranty, express or
service provided to customers or increased competition leading to loss of                  implied, as to the accuracy or completeness of the information contained
customer base, global economic downturn pressuring volumes and margins,                    within this document; and
downward pressure on UK wholesale power prices, business interruption or                c) no reliance may be placed upon the information contained within this
significant operational failures/ incidents, non-compliance or occurrence of               document to the extent that such information is subsequently updated by or
avoidable health and safety incidents, failure or increased cost of capital                on behalf of Pennon Group.
projects, exposure to contractor failure to deliver construction progress, failure of
information technology systems management and protection including higher               Past performance of securities of Pennon Group cannot be relied upon as a
                                                                                        guide to the future performance of any securities of Pennon Group.

2   Pennon Half Year Results 2017/18                                                                                                                      © Pennon Group plc 2017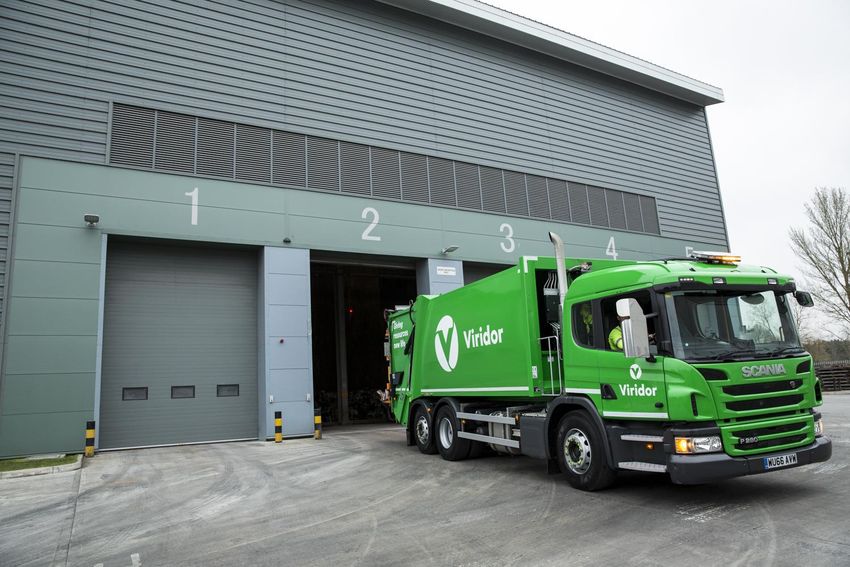
The Pennon Team

                                       Chris Loughlin     Sarah Heald
                                       Chief Executive     Director of
                                           Officer       Corporate Affairs
                                                            & Investor
                                                            Relations

3   Pennon Half Year Results 2017/18                                         © Pennon Group plc 2017
About Pennon

               © Pennon Group plc 2017
About Pennon
Unique combination of environmental infrastructure assets
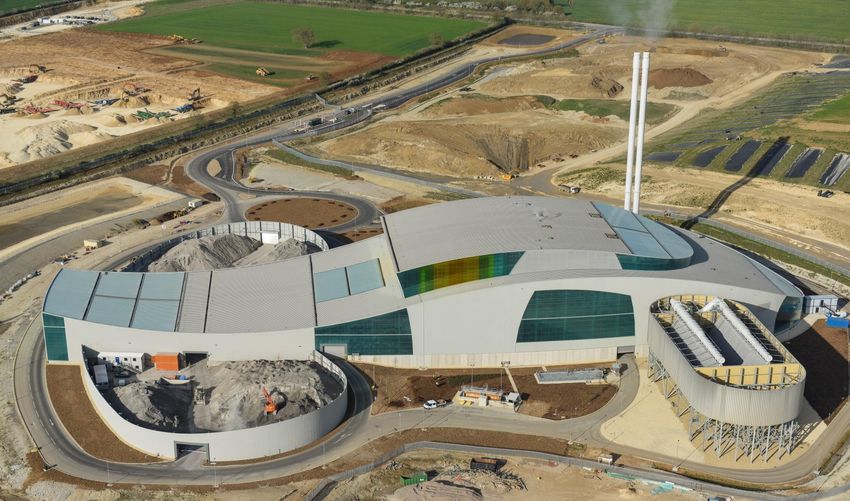
Water & Wastewater Waste Management
Regulatory ring-fence
Water and wastewater services to B2B water retailer A leading UK energy recovery,
a population of c.2.2 m recycling and waste
management company
• Serves more than 150 local
• Serves Cornwall, Devon, parts of • PWS is our growing B2B water authorities and major corporate
Dorset, Somerset, Hampshire and retailer currently serving >160,000 clients as well as over 32,000
Wiltshire customers nationwide customers across the UK
• Awarded enhanced status for its • C.5,100 new accounts won since • Network of 300+ recycling, energy
2015-2020 Business Plan, and has market opening recovery and waste management
highest potential returns in the
facilities, including 12 Energy
sector
Recovery Facilities (ERFs) (8 in
operation, 3 in commissioning & 1
in construction)
5 Pennon Half Year Results 2017/18 © Pennon Group plc 2017
Investment Case
A unique proposition in an attractive sector

              ‘SECTOR-LEADING WATER BUSINESS, GROWING RECYCLING, ENERGY RECOVERY AND
                                       WASTE MANAGEMENT GROUP’

         PREDICTABLE                                                WELL-POSITIONED TO
                                         EFFICIENT/EFFECTIVE        TAKE OPPORTUNITIES
        INDEX-LINKED                     BALANCE SHEET AND
        EARNINGS AND                                                   IN A CHANGING
                                           SECTOR-LEADING               REGULATORY
      CASHFLOW GROWTH                       FINANCE COSTS               ENVIRONMENT

                                            INVESTING FOR             SECTOR-LEADING
    STRONG OPERATIONAL                  FURTHER INDEX-LINKED          DIVIDEND OF +4%
       PERFORMANCE,                        GROWTH, TRACK             ABOVE RETAIL PRICE
    DELIVERING FINANCIAL                      RECORD OF             INDEX (RPI) INFLATION
          BENEFITS                        DELIVERING VALUE                 TO 2020
                                              FROM M&A

6   Pennon Half Year Results 2017/18                                               © Pennon Group plc 2017
Strategy
Strong platform, evolving for future

                                         Leading UK-listed environmental infrastructure group

                                                         Strategic priorities

                                       Focused on moving towards a more consistent risk profile

         DELIVER FOR                                                     CAPITALISE ON
         CUSTOMERS,                             LEADERSHIP IN             GROUP-WIDE
        COMMUNITIES,                            EFFICIENT COST          STRENGTHS, BEST         INVESTING FOR
        ENVIRONMENT,                              BASE AND                 PRACTICE,               GROWTH
       SHAREHOLDERS                               FINANCING                SYNERGIES

                                                         Strategic objective

                       LONG-TERM, PREDICTABLE, ASSET-BACKED, INDEX-LINKED RETURNS

7   Pennon Half Year Results 2017/18                                                                    © Pennon Group plc 2017
Total Shareholder Return
Consistently outperforming the market since privatisation

                         1,500
                                                               Pennon         Severn Trent          United Utilities         FTSE 100         FTSE 250

                         1,250
    TSR Indexed to 100

                         1,000

                          750

                          500

                          250

                            0
                                 1989 1990 1991 1992 1993 1994 1995 1996 1997 1998 1999 2000 2001 2002 2003 2004 2005 2006 2007 2008 2009 2010 2011 2012 2013 2014 2015 2016 2017

          Note: Share price as at 24 November 2017
8        Pennon Half Year Results 2017/18                                                                                                                        © Pennon Group plc 2017
Half Year Results 2017/18

                            © Pennon Group plc 2017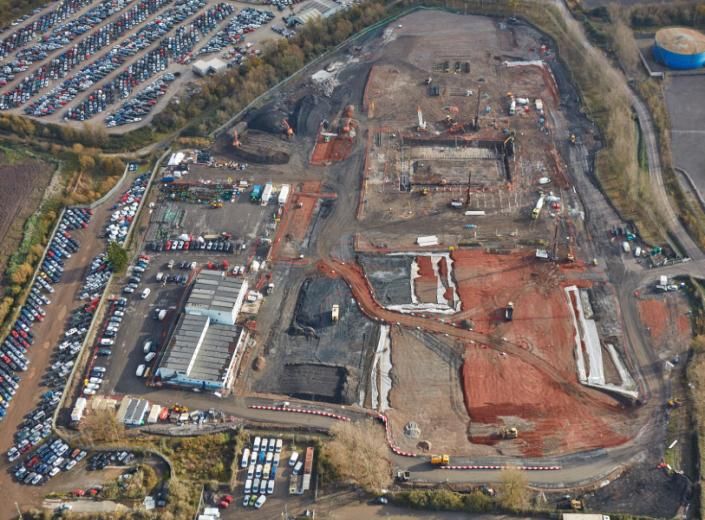
Delivering for customers,
communities and investors
      Delivering for customers and communities
      -       On track to deliver against business plan commitments including all ODI(1) commitments by 2020
      -       Sharing financial benefits with customers through WaterShare
      -       Customer bills lower than they were 8 years ago
      -       Long-term partnership working with customers and communities across the Group
      -       Viridor’s Greater Manchester contract – mutually satisfactory outcome

      Robust operational & financial performance
      -       Sector-leading in water, RORE(1) consistently over 11%
      -       Bournemouth acquisition – sustainable way to deliver greater efficiency and lower bills
      -       ERF(1) portfolio performing well
      -       Group efficiency initiatives on track, £11m p.a. delivered to date

      Preparing for the next growth phase, Viridor earnings step-up from 2020
      - Strong fundamentals in UK waste market, Viridor’s investment in ERF’s servicing demand
      - South West Water innovating for PR19, long-term vision for water to 2050 published
      - Well established long-term dividend policy of RPI + 4% to 2020

(1)       ODI – Outcome Delivery Incentive, RORE – Return on Regulated Equity, ERF – Energy Recovery Facility
10 Pennon Half Year Results 2017/18                                                                             © Pennon Group plc 2017
Financial Performance
© Pennon Group plc 2017Financial Highlights
Robust Group financial performance
H1 2017/18 H1 2016/17 A Adjusted EBITDA in line
Underlying(1) £m £m Change with expectations
Revenue 723.9 685.5 +5.6% - Higher SWW revenue and continued
efficiency
EBITDA 253.5 245.4 +3.3% - Strong ERF performance
Adjusted EBITDA(2) A 285.8 277.2 +3.1%
Depreciation and amortisation (91.1) (91.5) +0.4%
Operating Profit 162.4 153.9 +5.5%
B Growth in Profit Before Tax
Net Interest (36.6) (28.6) (28.0%)
- SWW in line with expectations
Share of JV Profit After Tax 5.3 2.8 +89.3% - Strong Viridor contribution
Profit Before Tax B 131.1 128.1 +2.3% - Efficient finance costs – effective rate 3.7%
Non-underlying Items Before Tax C (1.3) (25.7) -
C Non-underlying Items
Statutory Profit Before Tax 129.8 102.4 +26.8%
- Greater Manchester contract reset
Tax (17.5) (13.3) (31.6%) - Derivatives associated with SWW 2040 bond
Statutory Profit After Tax 112.3 89.1 +26.0%
Earnings per share(3) (p) D 25.3 23.6 +7.2% D EPS ahead of H1 2016/17
Statutory Earnings per share (p) D 21.8 17.7 +23.2% - On both an adjusted and
statutory basis
Dividend per share(4) (p) 11.97 11.09 +7.9%
(1) Before non-underlying items, see slide 35
(2) Underlying EBITDA plus share of Joint Venture EBITDA and IFRIC 12 interest receivable
(3) Adjusted EPS: before deferred tax and non-underlying items and proportionately adjusted for the first return due on the 2017 perpetual capital securities in H1 2017/18 and the periodic return due March 2017 in the prior period
(4) The RPI rate used is 3.9% as of September 2017
12 Pennon Half Year Results 2017/18 © Pennon Group plc 2017Capital Investment
Investing for growth
What we have been investing in...
Group
Capital - Energy Recovery Facilities - Further improvements to South West
Bathing and Shellfish waters
Investment - New landfill cells driven by demand
- Further innovation to improve drinking
profile - Cutting edge Mayflower Water
water quality
Treatment Works
£500m H1 H1
Group £m 2017/18 2016/17
£400m Capex Total Water 98 80
Total Waste(1) 147 104
£300m
Total 245 184
£ 200m
Total ERF portfolio expenditure c. £1.5bn(2)
£100m
- £1,261m expenditure to H1 2017/18, including
Avonmouth
£0m
2015/16 2016/17 H1 H2 2018/19 2019/20 - £268m remaining spend to completion
2017/18 2017/18
SWW Viridor
(1) Including construction spend related to service concession arrangements, capitalised interest (£6.7m in H1 2017/18) and ERF maintenance capital expenditure
(2) Excluding capitalised interest, net of amounts subject to legal contractual process - £45m to H1 2017/18, estimated £77m at completion
13 Pennon Half Year Results 2017/18 © Pennon Group plc 2017Net Debt Movements
Strong cash inflow from operations, continuing investment
Strong cash Re-financing Peak years
inflow from of perpetual of capital
operations capital investment in (2,790.9)
securities 2016/17 and
£m
2017/18
(2,664.9)
(235.3)
(82.1)
(48.6)
(31.3)
308.9 (10.4) (25.7)
(6.3) (7.0) (8.1)
23.5 1.2 (4.8)
(1) (2) (3)
Net Debt Cash inflow VLGM loan Lakeside dividends Pension Other movements Acquisition of South Capital securities Corporation tax Interim dividend Net interest paid Other taxes Final dividend Capital (4) Net Debt
1-Apr-17 from operations repayment and loan contributions Staffs Non- issuance 2016/17 2016/17 payments 30-Sep-17
repayments household retail
customer book
(1) Includes £2.6m non-cash movement in Euro loan due to exchange rates
(2) Includes hybrid periodic return payment of £19.0m offset by net hybrid receipt on refinancing of £10.9m (remaining £14.2m of 2013 hybrid purchased in October 2017)
(3) Other taxes include business rates, employers national insurance, fuel excise duty, carbon reduction commitment, environmental payments, climate change levy and external landfill tax
(4) Including construction spend on service concession arrangements net of proceeds from sale of property, plant and equipment
14 Pennon Half Year Results 2017/18 © Pennon Group plc 2017Balance Sheet
Strong funding position underpinning investment
Group at 30 September 2017 £1,246m cash & committed facilities
Net Debt £2,790.9m (31 March 2017 £1,383m)
Profile
Index-
Linked
£552m
20% Development of portfolio
Fixed
£1,812m Floating - £450m of new or renewed - Following EIB/Government
65% £427m funding signed since discussions – previous EIB
15%
March 2017. Including approved transaction being
£300m Pennon hybrid progressed alongside
- Diversified funding mix, underpinned by refinanced: other options to support
finance leases with long maturities final year of K6 and K7
- Rate of 2.875% lowest
- Average maturity of debt 20 years – ever for sterling issue pre-funding
matching asset base - Order book 4 times
South West Water funding oversubscribed
- 25% index-linked, below Ofwat ‘notional’
of 33%, headroom for RPI/CPI transition
15 Pennon Half Year Results 2017/18 © Pennon Group plc 2017Balance Sheet
Stable gearing – increased headroom for investment
64.8% Group Net Gearing(1)
65.2% at 30 September 2016
62.1% Water business Net Debt / RCV(2)
62.2% at 30 September 2016
Stable gearing - Reflects refinancing of perpetual capital securities (hybrid) in the Group’s capital
structure, net of continuing investment
- Gearing at plc is expected to reduce by year end, following the same profile as
2016/17
- SWW – aligned with Ofwat ‘notional’ efficient level
Increased - Hybrid supports increase in investible capacity – c. £800m
headroom for - Strength of balance sheet
investment
(1) Net borrowings/(equity + net borrowings)
(2) Based on Regulatory Capital Value (RCV) at March 2017
16 Pennon Half Year Results 2017/18 © Pennon Group plc 2017Group Financing
Sector-leading effective interest rate
K4 K5 K6
3.7% Group average 7.0%
(2005-10) (2010-15) (2015-20)
interest rate 6.5%
3.3% 6.0%
H1 2016/17 5.5%
5.0%
4.5%
Pennon
3.5% SWW average 4.0%
SWW
3.5%
interest rate Water Sector
3.0%
3.2%
H1 2016/17
Sector leading effective interest rates
£36.6m Group net
finance costs(1) • Consistently low effective rate, feature of financing mix
£28.6m
• Group net finance costs impacted by unwind of PMB derivative
H1 2016/17
in February 2017
(1) Before non-underlying items
(2) As at 30 September 2017
17 Pennon Half Year Results 2017/18 © Pennon Group plc 2017Dividend Growth
Established 10 year sector leading policy
Policy of 4%+RPI leading to an expected doubling of dividend over 10 years (2010 to 2020)(1)
- Interim dividend of 11.97p, up 7.9%(2)
- SCRIP dividend alternative ceased
- Dividend reinvestment plan (DRIP) offered for 2017/18
+7.1%
+5.6%
+4.9% 35.96
+6.5%
+7.3% 33.58
+7.6% 31.80
30.31
+9.3% 28.46
26.52
24.65
22.55
+7.9%
H1
11.97
2009/10 2010/11 2011/12 2012/13 2013/14 2014/15 2015/16 2016/17 2017/18 2018/19 2019/20
Note: Full Year and Interim dividend in pence per share
(1) Future dividends growth based on policy of 4% + RPI forecast to 2020
(2) 2017/18 Interim dividend based on September 2017 RPI of 3.9%
18 Pennon Half Year Results 2017/18 © Pennon Group plc 2017Operational Performance
© Pennon Group plc 2017Water: Delivering for customers and communities
On track to deliver against all water business plan commitments by 2020
Customers at the heart of our delivery
- £7bn investment to improve services to customers since privatisation
- Best ever customer service score (SIM)
- Written complaints reduced by c.30% - halved since 2011
- Customer bills lower than they were 8 years ago
SWW strong focus on affordability
- Tailored support for customers in vulnerable circumstances using a range of
approaches- c.51,000 customers supported through our existing schemes
Delivering 33 of 36 financial ODIs (1)
- 21st consecutive year without water restrictions
- Outperforming leakage target – halved since privatisation
- Maintaining high water quality standards
Bathing water quality
- Continued good performance – 98% achieving sufficient quality
- Further investments in bathing and shellfish waters underway
Wastewater compliance
- Best ever compliance performance – 98.4%
- Significant(2) pollutions reduced
(1) SWW 26 ODIs and BW 10 ODIs including SIM. 33 meeting target or within appropriate tolerances
(2) Category 1 and 2 pollution incidents
20 Pennon Half Year Results 2017/18 © Pennon Group plc 2017Water: Delivering for customers and communities
On track to deliver against all water business plan commitments by 2020
Strong focus on sharing financial benefits with customers acting responsibly
- Unique mechanism to share transparently outperformance in period
- Significant value shared with customers to date
- Reinvestment in services and future lower bills
- Customer challenge panel guiding priority area investments
(1)
Customer Shareholder
Cumulative to Cumulative to
H1 2017/18 H1 2017/18
£m £m
50 Net Totex Savings(2) 67
7 ODIs 7
11 Other items(3) -
68 Total Value Benefit 74
(1) WaterShare relates to performance within the South West Water region
(2) Gross Totex savings (inclusive of retail), net of tax for sharing and performance purposes
(3) Other items including market movements on new financing returned to customers and the impact of new legislation
21 Pennon Half Year Results 2017/18 © Pennon Group plc 2017Water: Strong operational and financial performance
Consistent sector-leading RORE
WaterShare RORE (1) performance Cumulative K6 TOTEX outperformance - £159m
- Delivering continued efficiency performance
Cumulative
11.8%(1)
FY 15/16 FY 16/17 H1 17/18 Operational performance ahead of
11.7% 12.6% 11.1%
our commitments to customers
- Cumulative net reward of £7.0m
- End of period rewards of £9.1m
- In period net penalties of £2.1m
- Targeting further improvements on wastewater pollutions
6.0%
Continued delivery of financing outperformance
- £83m cumulative financing outperformance
- Sharing the benefits of reduction in interest
rates with customers
Financing Totex
ODIs Base returns
(1) RORE outperformance: Totex outperformance calculated after sharing rate and the impact of tax, impact of net ODI rewards in 2016/17
and financing outperformance calculated using long term forecast K6 inflation of 2.8% (see slide 47-48 for further detail)
22 Pennon Half Year Results 2017/18 © Pennon Group plc 2017Water: Strong operational and financial performance
ODI performance levels – cumulative net reward position
GOOD Water quality standard Odour contacts
PERFORMANCE(1) Taste, smell and colour contacts Bathing water quality
Operational contacts resolved 1st time Water & waste asset reliability
Water restrictions Sustainable abstractions
Supplies interrupted due to flooding Leakage level
Supply interruptions Descriptive compliance
IMPROVING
Customers paying a metered bill
PERFORMANCE Internal and External sewer flooding
Wastewater numeric compliance(2)
Service Incentive Mechanism (SIM)(2)
AREAS
OF FOCUS
Pollution incidents
Cumulative ODI Outperformance net reward: £7.0m(3)
(1) Good performance in line with committed performance (or within appropriate tolerances)
(2) End of AMP measure only, on track to deliver with no penalty assumed
(3) ODI performance in H1 2017/18 of £1.5m is split £1.6m net reward which will be recognised at the end of the regulatory period and £0.1m net penalty which may be reflected during the regulatory period. Of the
cumulative net reward of £7.0m £9.1m will be recognised at the end of the regulatory period and £2.1m net penalty which may be reflected during the regulatory period.
23 Pennon Half Year Results 2017/18 © Pennon Group plc 2017Water: Preparing for next growth phase Investment anticipated at least comparable to historic levels £6bn - £9bn investment anticipated to 2050 - Informed by Defra’s guidance to Ofwat - Direct engagement with Ofwat - Customer / stakeholder research and engagement Key investment drivers continue to be - Resilience - Environmental protection and enhancement - Security of supply - Flood protection - Transformational improvement to customer service Choices over phases of spend - Tested with customers, stakeholders and regulators - Engagement will inform 5 year plan 24 Pennon Half Year Results 2017/18 © Pennon Group plc 2017
Viridor: Robust operational and financial performance
ERFs performing well

               Focus on optimising performance
               - Delivered £52m of EBITDA in H1 2017/18 – expect H2 weighting
 Operational

               - High availability across fleet – Average >90%(1)
               - Maintenance regimes working well. Current run rate of 2.0% p.a. of
                capital cost, with 3.5% p.a. long term average cost
               - Investments delivering in excess of base case expectations
               - 80% long-term contracted volumes (and associated price) across the
                portfolio(2)

                 H1 Adjusted EBITDA 2017/18                                                                      ERF Availability H1 2017/18(1)
                 Outperformance                                             Fleet outperformance
                                                                                                   100%
                                                                            P'borough              90%

                                                                            Runcorn II             80%
                                                                                                   70%
                                                                            Runcorn I
                                                                                                   60%
                          Pennon                                            Cardiff                50%
                       base case                                                                   40%
                     performance                                            Ardley
                                                                                                   30%
                                                                            Exeter                 20%
                                                                                                   10%
                                                                            Lakeside
                                                                                                    0%
                                                                                                          Runcorn II   Cardiff   Ardley   P'borough   Exeter   Lakeside   Runcorn I
(1) Includes 100% of joint venture availability, excludes Bolton ERF due to fire
(2) Excluding Avonmouth
25 Pennon Half Year Results 2017/18                                                                                                                               © Pennon Group plc 2017
Viridor: Robust operational and financial performance
Recycling EBITDA margin consistent
VOLUMES
120kT Self-help measures underpinning performance –
H1 2017/18: 740kT further opportunities available
(H1 2016/17: 860kT)
REVENUES - Reduced volumes - optimisation of contracts and asset base
£10/T - Better pricing reflected in revenues
H1 2017/18: £97/T
(H1 2016/17: £87/T) - Pressure on costs – higher quality output requirements in China
OPERATIONAL COST - Higher shipping costs due to under-capacity
£6/T - EBITDA steady thanks to self-help and contract pass-through
H1 2017/18: £78/T
(H1 2016/17: £72/T) - Developing new Asian markets to offset Chinese impacts
SHIPPING COST
£3/T
H1 2017/18: £5/T
(H1 2016/17: £2/T)
EBITDA MARGIN
£1/T
H1 2017/18: £14/T
(H1 2017/18: £13/T)
26 Pennon Half Year Results 2017/18 © Pennon Group plc 2017Viridor: Delivering for customers and communities
Greater Manchester contract ‘reset’
Long-term partnership continues – mutually satisfactory outcome
- Energy Recovery Facility – Runcorn I
- Long-term contract remains
- Residual waste will continue to be treated, no significant operational changes
- Recycling and reprocessing
- Contract on ‘run-off’ basis for a minimum of 18 months
- Subsequent contracts, subject to re-procurement process
- Viridor will be eligible to bid for the new contracts with new contractual terms
27 Pennon Half Year Results 2017/18 © Pennon Group plc 2017Viridor: Preparing for the next growth phase
Significant growth to come from residual waste
Confidence in the waste sector
- Strong fundamentals in UK waste market
- Investment in further UK waste treatment capacity as essential to service longer term demand
Source: Defra, SEPA, NRW and Viridor analysis
28 Pennon Half Year Results 2017/18 © Pennon Group plc 2017Viridor: Preparing for the next growth phase
ERF assets will deliver earnings step up
Avonmouth
Glasgow South
Dunbar
In construction or stage of commissioning
London
Glasgow
- First generated electricity – February 2017 IFRIC 12
(IFRIC 12)
Interest
- MRF(1) and AD(2) plants operating Receivable
Share of Adjusted
- ERF in final commissioning JV EBITDA
EBITDA
EBITDA £107m
Beddington (South London)
2016/17 2020/21
- In final commissioning
Dunbar
- Early stage of commissioning
Avonmouth
- Construction underway and progressing well
- Project is proceeding to plan with piling activities on-going
(1) Materials Recycling Facility
(2) Anaerobic Digestion
29 Pennon Half Year Results 2017/18 © Pennon Group plc 2017Pennon: Robust operational and financial performance
Underpinned by efficiency across the Group
Sector leading water Totex outperformance
SWW Totex
£159m savings
• £159m cumulative Totex efficiencies
K6 to date
Bournemouth Water synergies on track
SWW/BW • Final integration phase complete
c. £27m Synergies • £12m delivered since merger with SWW
K6 in total
Group wide efficiencies
Group • c. £11m p.a. secured to date
c. £17m efficiencies • Group wide IS platform integration on track
p.a. From 2019
30 Pennon Half Year Results 2017/18 © Pennon Group plc 2017Delivering for customers,
communities and investors
Delivering for customers and communities
- On track to deliver against business plan commitments including all ODI(1) commitments by 2020
- Sharing financial benefits with customers through WaterShare
- Customer bills lower than they were 8 years ago
- Long-term partnership working with customers and communities across the Group
- Viridor’s Greater Manchester contract – mutually satisfactory outcome
Robust operational & financial performance
- Sector-leading in water, RORE(1) consistently over 11%
- Bournemouth acquisition – sustainable way to deliver greater efficiency and lower bills
- ERF(1) portfolio performing well
- Group efficiency initiatives on track, £11m p.a. delivered to date
Preparing for the next growth phase, Viridor earnings step-up from 2020
- Strong fundamentals in UK waste market, Viridor’s investment in ERF’s servicing demand
- South West Water innovating for PR19, long-term vision for water to 2050 published
- Well established long-term dividend policy of RPI + 4% to 2020
(1) ODI – Outcome Delivery Incentive, RORE – Return on Regulated Equity, ERF – Energy Recovery Facility
31 Pennon Half Year Results 2017/18 © Pennon Group plc 2017UK Regulation
© Pennon Group plc 2017UK WATER
Industry regulation
Ofwat
Natural
Environment
England Agency
Drinking Consumer
Council for
Water Water
Inspectorate
33 Pennon Half Year Results 2017/18 © Pennon Group plc 2017
3Economic regulation
OFWAT
LEGAL OBLIGATIONS
• Ensure companies properly carry out their functions
• Ensure companies can finance their functions
• Protect the interests of consumers, wherever appropriate, by promoting effective competition
• Secure the long-term resilience of water and sewerage systems
• Promoting economy and efficiency
• Contributing to the achievement of sustainable development
• Ensure Ofwat gives no undue preference
WATER AND SLUDGE RESOURCES
Market capitalisation
(shortly after flotation)
Pre 2015: Capital Investment
2015-20: RCV additions (from Totex)
Pre 2015: Capital charges
2015-20: RCV run-off
+/- Inflation adjustment
34 Pennon Half Year Results 2017/18
= Regulatory capital value (RCV)
© Pennon Group plc 2017
3South West Water
Final Determination 2015-20, enhanced status awarded
OFWAT’S FINAL DETERMINATION – KEY HIGHLIGHTS
WHOLESALE TOTEX K6(2)
• Highest potential RORE in the sector SWW Final Determination allowed Totex £1,584m
• Relative benefits of enhanced assessment increased by a further c. BW Final Determination allowed Totex £154m
£14m
‒ enhanced cost of capital allowance and no restrictions in ODI EFFICIENCY (TOTEX AND ACTS) K5 K6
benefits
SWW Operating costs 2.8% 2.5%
‒ uncapped Totex menu: extra 5% sharing rate
‒ financial award: £11m additional to RCV, up to 50% BW Operating costs N/A 0.8%
reinvested SWW Capital Expenditure 5.0% 5.5%
• Average household bills below inflation to 2020, 13% real reduction BW Capital Expenditure N/A 0.6%
from 2013 /14 (7% from 2014 /15)
• Innovative WaterShare mechanism implemented K6
SWW FINANCIAL HIGHLIGHTS K5 Enhanced Non-enhanced
average
South West Water: lowest index-linked debt in the industry Wholesale vanilla cost of capital 5.1% 3.7% 3.6%
0.5%
0.5% Retail margins (RCV returns equivalence) - 0.20% 0.19%
2.3%
Equity return(3) 7.1% 6.0% 5.8%
1.9%
Cost of debt(3)(4) 3.60% 2.59% 2.59%
0.2% 0.2%
Notional gearing 57.5% 62.5% 62.5%
1.4% 1.5%
5.9% 6.0%(1) Return on Regulated Equity (RoRE) - 2.1-10.5% 1.2-10.5%
1.8%
1.7%
0.3% 0.3%
1.5% 1.5%
0.3% 0.3%
Ofwat Final Determination Reflecting ‘enhanced’ status
(1) Includes non-household retail margin
35 Pennon Half Year Results 2017/18 (2) 2012 /13 price base © Pennon Group plc 2017
(3) Implied equity return and debt allowance with an unchanged cost of capital
(4) Cost of new debt at 2.1% (25%) and existing debt at 2.75% (75%)Water 2020
Largely as expected
DEBT INDEXATION
• Phased transition from RPI to CPI
• CPI will apply for 100% of revenues
• 50% applied to wholesale RCV in 2020-25; further transition at PR24 and beyond
• South West Water: lowest index-linked debt in the industry
WATER AND SLUDGE RESOURCES
• Separate total revenue control to incentivise competition in water trading
• Separate average revenue control in sludge (‘Bio-resources’) and no explicit RCV protection mechanism,
though alternative implied RCV protections
• South West Water: lowest exposure in the industry at 4% for water resources and 2% sludge
DIRECT PROCUREMENT
• Encouraged for discrete projects with a while life totex >£100m
• South West Water: well-positioned to take market share
LICENCE CHANGES
• Ofwat engaging with companies ahead of a formal process
• South West Water: declared supportive of Ofwat’s proposals
36 Pennon Half Year Results 2017/18 © Pennon Group plc 2017Cost of debt consultation
As expected
COST OF DEBT
• Proposed to continue to be set on the basis of an efficient notional company
• Indexation will be applied to new cost of debt only
• Ofwat will continue the fixed allowance approach for embedded debt
• End of period adjustment proposed for the inflation element of new debt only
• South West Water: close to notional company structure
COMPANY-SPECIFIC SHARING MECHANISMS
• Ofwat does not propose to mandate risk sharing
• Companies are encouraged to consider pain-gain sharing around the cost of debt where it is in the interests of
customers
• South West Water: leading company adopting pain-gain sharing at PR14
COST OF EQUITY
• Ofwat highlights Australian development of a menu approach to the cost of equity
• Companies would be required to assess the level of risk in the business plan and propose the appropriate level
for cost of equity to be rewarded
• South West Water: higher cost of equity due to ‘Enhanced’ status
37 Pennon Half Year Results 2017/18 © Pennon Group plc 20172019 Price Review Timetable
Well prepared forforBusiness
Well prepared Plan
Business Plan submission
submission in September
in September 2018 2018
2017
September Vision to 2050
September SWW response to PR19 methodology
September Bioresources submission
Mid December Final Ofwat methodology published
December Draft Water Resources Management Plan submitted
2018
January Water resources submission
April Business plan customer consultation
April Customer acceptability
May Updated business plan submission
May Performance commitment submission
September Business plan submission
2019
January Initial assessment of business plans published
March/April Draft determinations (exceptional and fast track plans)
April Companies submit revisions to business plans (significant scrutiny and slow track)
July Draft determinations (Slow track and significant scrutiny)
December: Final determinations published
38 Pennon Half Year Results 2017/18 © Pennon Group plc 2017Appendix
© Pennon Group plc 2017Pennon
© Pennon Group plc 2017Pennon
Adjusted group EBITDA
£m 0.5
1.2
2.1
4.0 (0.4) (0.4)
(2.2) 285.8
7.4
(3.6)
277.2
H1 2016/17 SWW tariff Contracts, Viridor ERFs Share of JV Plc, PWS and Recycling SWW other Landfill and H1 2017/18
increase and collections and overheads EBITDA & IFRIC other revenue and cost landfill gas
(1)
customer other 12 interest impacts
demand receivable
(1) Includes impact of meter switchers and new connections
41 Pennon Half Year Results 2017/18 © Pennon Group plc 2017Pennon Water Services Financial Highlights
Growing in the new competitive market
H1 2017/18(1)
£m >160,000 c.5,100(2)
Revenue A 83.5 Customers New accounts
accounts won since
EBITDA B 0.5
market opening
Depreciation (0.3)
Operating Profit 0.2
Net Interest (0.7) Dedicated PWS
Loss Before Tax (0.5) management team
A Competitive market – PWS growing
- One of only four associated retailers to have achieved net growth
- Focused on value enhancing contracts
B Set-up established
- PWS has regularly achieved industry leading standards showing strong compliance with
required market performance as measured by MOSL, with average performance of c.99%
- Set-up costs reflected in 2017/18
(1) 80:20 venture with South Staffordshire Group
(2) As at 20 November 2017 c.5,100 new accounts, net growth c.1,750
42 Pennon Half Year Results 2017/18 © Pennon Group plc 2017Non-underlying Items
H1 H1 A Greater Manchester Contract ‘Reset’
£m 2017/18 2016/17
- TPSCo contract reset and settlement of outstanding
Greater Manchester A 6.5 - Viridor Waste claims, net of write down of Viridor
B Laing shareholder loans
Derivatives(1) (7.8) (15.0)
Other non-underlying costs(2) - (10.7)
B Derivatives
Profit Before Tax impact (1.3) (25.7)
Deferred tax – change of rate(3) - 20.1 - Movement in fair value of long-dated derivatives
associated with the 2040 bond
Tax credit/(charge) on
4.3 (2.7)
non-underlying items
Net credit/(charge) for the period 3.0 (8.3)
(1) In the first half of 2016/17 net derivatives charge of (£15.0m) includes the fair value of 2040 bond long-dated derivatives and a change in legislation impacting the 2011
PMB derivative, terminated in February 2017
(2) H1 2016/17 reflects charges for restructuring costs of £10.7m
(3) Deferred tax credit of £20.1m in the first half of 2016/17 relating to the enacted reduction in the UK rate of corporation tax from 18% to 17% in 2020
43 Pennon Half Year Results 2017/18 © Pennon Group plc 2017Corporation tax
Effective rate reflects capital allowances for investment
H1 H1 A Current tax
£m 2017/18 2016/17
- Increase in capital allowances reflecting increased
Current Year Viridor capital expenditure
- Current year current tax effective rate of 10.9%
Current Tax A 14.3 23.1
(2016/17 H1 18.1%)
Deferred Tax 10.2 9.5 - H1 2016/17 included charges related to the
Peninsula MB Ltd derivative
24.5 32.6
Prior Year
(4.3) (0.3) B Non-underlying items
Current Tax
Deferred Tax 1.6 (1.6) - Reflects the tax on write down of shareholder loans
and settlement of outstanding claims as well as
(2.7) (1.9) derivative movements
Total Underlying Tax Charge 21.8 30.7
Deferred Tax – change of rate - (20.1)
Non-underlying Items(1) B (4.3) 2.7
17.5 13.3
(1) £1.3m deferred tax credit and £3.0m current tax credit
44 Pennon Half Year Results 2017/18 © Pennon Group plc 2017Balance Sheet
Successful refinancing of £300m perpetual capital securities (hybrid)
- Tender offer at 103% of par value plus accrued periodic returns – together broadly
2013 £300m
6.750% - first equating to the periodic return which would have been due in March 2018
call date - 95% take-up of tender – remaining 5% called at par (£15m), settled October 2017
March 2018 - Associated periodic returns qualify for tax relief
2017 £300m
2.875% - first - Achieved a rate of 2.875%, the lowest ever for a sterling perpetual capital securities
call date - Associated periodic returns do not qualify for tax relief
May 2020
H1 2017/18 financial 2013 2017 - Costs associated with the 2013 hybrid of
Total
impacts on EPS hybrid hybrid
£5.2m have been reclassified from the
£15.7m £5.8m £21.5m perpetual capital reserve to retained earnings
Statutory basis
3.8p 1.4p 5.2p - Costs associated with the 2017 hybrid of
£0.2m £3.3m have been recognised directly in the
£15.7m £15.9m
Underlying basis perpetual capital reserve
3.8p 0.0p 3.8p
45 Pennon Half Year Results 2017/18 © Pennon Group plc 2017Pennon Diversified funding sources As at 30 September 2017 £m Finance Leasing(1) 1,474 Bank Bilaterals – Term Loans 380 European Investment Bank Loans 339 Index-Linked Bond 416 Fixed Rate Bond 134 Private Placements(2) 619 Total Gross Debt 3,362 Less: Cash/liquid investments (571) Net Borrowings 2,791 Finance leasing provides a key role in long-dated funding (1) Includes £134m of index-linked finance leasing (2) Includes other borrowings of £6m related to PWS 46 Pennon Half Year Results 2017/18 © Pennon Group plc 2017
Pennon
Fair value of non-current debt

                                                      As at 30 September 2017           As at 31 March 2017
                                                      Book        Fair                 Book       Fair
£m                                                    Value      Value   Difference    Value     Value   Difference
Finance Leases                                         1,446     1,287          159    1,354     1,218         136

Bank and Other Loans                                    380        383           (3)    329        336          (7)

European Investment Bank Loans                          307        265           42     323        282          41

Index-Linked Bond                                       416        504          (88)    416        496         (80)

Fixed Rate Bond                                         134        195          (61)    133        199         (66)

Private Placements(1)                                   619        656          (37)    562        614         (52)

Total                                                  3,302     3,290           12    3,117     3,145         (28)

(1) Includes other borrowings of £6m related to PWS
47 Pennon Half Year Results 2017/18                                                                                   © Pennon Group plc 2017
Pennon
Net interest analysis(1)
£m H1 2017/18 H1 2016/17
Net interest payable (36.6) (28.6)
Efficient effective interest rate
Add: capitalised interest (7.8) (6.1)
Less: notional interest payable(2) 5.7 5.7
GROUP SOUTH WEST WATER
Add: interest receivable on service
concession contracts
(6.9) (8.8)
3.7% 3.5%
Add: interest receivable on
(5.5) (5.0)
shareholder loans to JVs
Net interest for average rate
(51.1) (42.8)
calculation
Split between:
Interest payable A (44.4) (42.6) A Reflects higher RPI
Capitalised interest payable (7.8) (6.1)
Other finance income B 1.1 5.9 B Impacted by the unwind of
the PMB derivative in
Net interest payable (51.1) (42.8) February 2017
Average rate of interest 3.7% 3.3%
Net interest cover 4.3x 4.9x
(1) Before non-underlying items as set out in slide 35
(2) Includes pensions net interest and discount unwind on provisions
48 Pennon Half Year Results 2017/18 © Pennon Group plc 2017Pennon
Pensions
The aggregate pension schemes’
30 September 31 March
£m
2017 2017
deficit has reduced in the six
months to 30 September 2017 by
Pension schemes’ assets £891m £903m £12m from £68m to £56m
Pension schemes’
£947m £971m This represents a net deficit of
liabilities
c. 1% of Group’s market
£56m £68m capitalisation
= £46m = £56m
net of tax net of tax
Following 2016 actuarial valuation
– contributions remain in line with
2014 Final Determination
- Liabilities have reduced by £24m reflecting higher allowances
corporate bond yields
- Asset values have reduced by £12m, due primarily to
assets matched to liabilities
49 Pennon Half Year Results 2017/18 © Pennon Group plc 2017Pennon
Significant energy generation
Group energy generation
- Total energy generation of c.0.9TWh in H1 2017/18
− 8 ERFs(1) – 661GWh
− Landfill gas – 217GWh
− 25 Hydro turbines – 4.3GWh generation
− 53 solar PV installations – 5.4GWh(2)
− Anaerobic digestion – 0.3GWh
− CHP – 3.2GWh
− 1 wind turbine – 0.1GWh generation
Utilising existing grid connections at landfill sites
- Continuing to identify opportunities to maximise the value from our grid
connections Pennon hedging activity
Portfolio management strategy
- The Portfolio management team continues to actively manage the Group net Pennon hedging
energy generation position in liquid markets Internal and external hedges have
- The natural hedge within the Group is maintained at around a third of generation been traded over the period to
- Forward hedges have been put in place in the liquid market to March 2020 September 2017 maintaining the
- The Group is fully hedged for the remainder of the financial year and c. 66% Group’s net hedged position
hedged for the three years to 2020
(1) Includes 100% capacity on joint ventures at Lakeside and Runcorn and excludes Bolton due to fire.
(2) This includes 3.4GWh of output from two private wire schemes – Polmaugan (Restormel) and Wadebridge Renewable energy network (Nanstallon)
50 Pennon Half Year Results 2017/18 © Pennon Group plc 2017South West Water
© Pennon Group plc 2017South West Water Financial Highlights
Continuing to drive outperformance of regulatory contract
H1 2017/18 H1 2016/17(1) A Revenue
Underlying(2) £m £m Change - Tariff increase 2.5%
Revenue A 292.2 284.9 +2.6% - Higher demand 1.1% on metered
volumes net of impact of meter
Operating Costs (105.1) (103.0) (2.0%) switchers
EBITDA B 187.1 181.9 +2.9%
B EBITDA
Depreciation and amortisation (56.4) (55.8) (1.1%)
- Cost increases below inflation as a
Operating Profit 130.7 126.1 +3.6% result of efficiencies
Net Interest (34.5) (30.2) (14.2%) - Good progress on debt collections
- Bad debt fallen to c. 0.9% of
Profit Before Tax 96.2 95.9 +0.3% revenue
- Cumulative Totex efficiency of £159m
delivered to date
Capital Expenditure 97.6 79.7 +22.5%
Return on Regulated Equity C
WaterShare RORE(3) 11.1% 11.7% (0.6%) C RORE
- Outperforming regulatory contract
OFWAT RORE(4) 12.4% 11.0% +1.4%
- Maintaining momentum, consistently
>11% p.a.
- Cumulative K6 performance of 11.8%
(1) Excludes South West Water’s non-household retail performance now reported in Pennon Water Services (PWS)
(2) Before non-underlying items, see slide 35
(3) Financing outperformance based on average forecast RPI for K6 of 2.8%
(4) Based on Ofwat’s definition of financing outperformance calculated based on average RPI of 1.1% for 2015/16 , 2.1% for 2016/17 and 3.7% forecast for 2017/18
52 Pennon Half Year Results 2017/18 © Pennon Group plc 2017South West Water
Revenue
£m 12.0
0.7 (1.7)
1.9
292.2
(5.6)
284.9
H1 2016/17 Tariff increase WRFIM(1) New connections Increased customer Meter optants H1 2017/18
demand (net of leak
allowances)
(1) Wholesale Revenue Forecast Incentive Mechanism
53 Pennon Half Year Results 2017/18 © Pennon Group plc 2017South West Water
EBITDA
£m 1.4
7.4
187.1
(2.6)
(0.5) (0.5)
181.9
H1 2016/17 Revenue growth Efficiencies and other Cost increases including Pension Capital charges H1 2017/18
cost savings inflation
54 Pennon Half Year Results 2017/18 © Pennon Group plc 2017South West Water
Sector leading RORE outperformance
Highest potential returns in the industry
SWW delivering outperformance across all areas
OFWAT INDUSTRY RORE(1)
CUMULATIVE TO 2016/17
(1) Source: Ofwat’s Monitoring Financial Resilience report published November 2017
55 Pennon Half Year Results 2017/18 © Pennon Group plc 2017Water: Delivering for customers and communities
On track to deliver against all water business plan commitments by 2020
Water sector leakage performance
Sector-leading leakage performance
GOOD
PERFORMANCE
Best ever numeric and descriptive
wastewater compliance
- Wastewater serious and significant pollutions –
upper quartile performance
- Minor pollutions, area of focus
Source: Discover Water
Discharge permit Numeric Pollution Incidents (Cat 1-3)
700
compliance compliance
600
500
400
300
200
100
0
SWW
Wessex Water
Southern Water
South West Water
Severn Trent Water
Anglian Water
Northumbrian Water
Thames Water
Yorkshire Water
United Utilities
Wessex Water
Wessex Water
Northumbrian Water
Northumbrian Water
South West Water
South West Water
Yorkshire Water
Yorkshire Water
Thames Water
Anglian Water
Southern Water
Thames Water
Anglian Water
Southern Water
Severn Trent Water
Severn Trent Water
United Utilities
United Utilities
2016
2016 2013 2014 2015 2016 2013
2013 2016
2016
Source: Environment Agency data Source: Calculated from Environment Agency Environmental Performance Assessment data
56 Pennon Half Year Results 2017/18 © Pennon Group plc 2017Viridor
© Pennon Group plc 2017Viridor Financial Highlights
Strong performance, underpinned by cost base efficiency
H1 2017/18 H1 2016/17
Change
Underlying(1) £m £m A ERFs
Revenue(2) 407.0 397.9 +2.3% - ERF availability >90%(5) for H1 2017/18
- Expect H2 weighting
EBITDA 66.6 63.3 +5.2%
ERFs A 51.7 50.5 +2.4% B Optimising landfill
Landfill B 3.3 3.2 +3.1% - Landfill volumes increased since H2
2016/17 – pricing holding up
Landfill Gas B 9.2 12.9 (28.7%)
- Gas yields impacted by maintenance
Recycling C 10.6 11.0 (3.6%)
Contracts, Collections & Other(3) 20.0 16.0 +25.0% C Recycling
Indirect Costs D (28.2) (30.3) +6.9% - Volumes reduced, optimising contracts
and asset base
Share of JV EBITDA 25.4 23.0 +10.4%
- EBITDA margin/tonne increased
IFRIC 12 Interest Receivable 6.9 8.8 (21.6%)
Adjusted EBITDA 98.9 95.1 +4.0% D Focus on cost base
Depreciation and amortisation (34.2) (35.6) +3.9% - Driving efficiency through shared
services
Profit Before Tax 30.6 23.1 +32.5%
Capital Investment(4) 147.1 103.6 +42.0%
(1) Before non-underlying items, see slide 35
(2) Including landfill tax and construction spend on service concession arrangements
(3) H1 2017/18 benefiting from contract rationalisation
(4) Including construction spend related to service concession arrangements
(5) Includes 100% of joint ventures, excluding Bolton ERF availability due to fire
58 Pennon Half Year Results 2017/18 © Pennon Group plc 2017Viridor
Revenue
1.3
5.1
£m
8.5
(8.0)
12.6
407.0
(10.4)
397.9
H1 2016/17 ERF construction Contracts, ERF operational Recycling Landfill and landfill Landfill tax H1 2017/18
revenue collections and other revenue gas
59 Pennon Half Year Results 2017/18 © Pennon Group plc 2017Viridor
Adjusted EBITDA
£m 1.2
2.1
(0.4)
2.4
(1.9)
4.0 98.9
(3.6)
95.1
H1 2016/17 Contracts, Share of JV EBITDA Indirect costs ERFs Recycling IFRIC 12 interest Landfill and landfill H1 2017/18
collections and receivable gas
other
60 Pennon Half Year Results 2017/18 © Pennon Group plc 2017Viridor: Robust operational and financial performance
Landfill and landfill gas
Delivering cash flow from landfill – optimising capacity
Landfill - Extracting value from sites – maximising opportunities for external grid connections
11 - Landfill volumes increased from H2 2016/17 – pricing holding up
Open sites - Retaining flexibility, keeping sites open for longer and investing in new cells
(2016/17: 11 open sites)
where commercially attractive
- Gas yields for H1 2017/18 impacted by maintenance carried out to improve engine
reliability and availability
Landfill gas
96 MW
Yields typically reducing by
5-7% y-o-y(1)
(1) Volume reduction H1 2017/18 impacted by 17.7% due to engine maintenance and replacement programme
61 Pennon Half Year Results 2017/18 © Pennon Group plc 2017Viridor
Greater Manchester Waste Disposal Authority (GMWDA) Contract ‘reset’
Before
50% Joint 37.5% Joint 100% Viridor
GMWDA venture Residual venture Operating subsidiary
waste (ERF contract for
contract) Runcorn I ERF
VL TPSCo VLGM
Principal
contract
Operating contract for recycling assets
After B
Residual
waste (ERF
contract) 37.5% Joint 100% Viridor
GMWDA venture Operating subsidiary
contract for
A Runcorn I ERF
VL TPSCo VLGM
B
Operating contract for recycling assets
A GMWDA acquires Viridor Laing
B Contracts reset
62 Pennon Half Year Results 2017/18 © Pennon Group plc 2017Viridor
Greater Manchester Waste Disposal Authority (GMWDA) Contract ‘reset’
Financial Impacts H1 2017/18 reset
Share of Shareholder VWGM
JV PAT Loans EBITDA Viridor Laing – reduction in
Disposal of Viridor Laing shareholder loan interest of
Write down of shareholder loans - (£19.2m) - c.£5m p.a.
Residual waste (ERF contract)
‘reset’
Gain on fair value of re-profiled £22.5m - -
Non material ongoing
cash flows impact on TPSCo
Operating contract for
recycling assets Anticipated annual EBITDA
Construction contract settlements - - £3.2m improvement from the 18
Subtotal £22.5m (£19.2m) £3.2m month run off contract.
Total £6.5m Ability to re-tender
63 Pennon Half Year Results 2017/18 © Pennon Group plc 2017Viridor
Joint Venture Performance
Greater Manchester
Viridor
£m TPSCo Laing VWGM(1) Lakeside Total
H1 2017/18
Share of JV PAT 1.0 0.1 - 4.2 5.3
Interest on shareholder loans 2.3 2.6 - 0.6 5.5
EBITDA VWGM(1) - - (0.3) - (0.3)
Shareholder loans 40.1 - - 8.4 48.5
Share of non-recourse net debt/(cash) (20.2) - - 32.1 11.9
Share of adjusted EBITDA 9.1 7.2 - 9.1 25.4
H1 2016/17
Share of JV PAT - 0.1 - 2.7 2.8
Interest on shareholder loans 2.0 2.3 - 0.7 5.0
EBITDA VWGM(1) - - (0.2) - (0.2)
Shareholder loans 35.7 37.7 - 8.7 82.1
Share of non-recourse net debt 72.5 92.2 - 35.7 200.4
Share of adjusted EBITDA 8.3 7.3 - 7.4 23.0
(1) Viridor Waste Greater Manchester is not a Joint Venture arrangement and therefore performance is shown in Contracts, Collections and Other. Excluding overheads
64 Pennon Half Year Results 2017/18 © Pennon Group plc 2017Viridor
ERF accounting
An illustrative, large ERF (c.300kt)
will contribute c.£28m to Viridor
EBITDA
Illustrative ERF(1) IAS 16(2) IFRIC 12(2) JVs
IAS 16 IFRIC 12 JVs • Oxford (Ardley) • Exeter • Lakeside
• Cardiff • Peterborough(3) • Runcorn I
EBITDA £28m £12m -- (Trident Park) • Glasgow
IFRIC 12 Interest Receivable -- £16m -- • Runcorn II
• Bolton
Share of JV EBITDA (50%) -- -- £14m • Dunbar
• South London
Adjusted EBITDA £28m £28m £14m (Beddington)
• Avonmouth
(1) From first full year of operation
(2) ERFs under construction identified in green
(3) Local authority funding, interest income will be negligible
65 Pennon Half Year Results 2017/18 © Pennon Group plc 2017Viridor
ERF CAPEX(1) – Efficient investment
to deliver growth
Cumulative Capital Cumulative Remaining Amounts Total Original
spend at investment spend to spend to subject to project planned
£m 1 April 2017 in H1 2017/18 30 September 2017 completion recovery(3) spend project spend
ERF projects in operation
Exeter 47 - 47 - - 47 47
Oxford (Ardley) 204 - 204 - - 204 210
Cardiff (Trident Park) 207 - 207 - - 207 223
Peterborough 72 - 72 - - 72 72
Runcorn II 216 - 216 - - 216 216
Total 746 - 746 - - 746 768
ERF projects under construction
Glasgow 156(2) 44 200 32 (77) 155 155
Dunbar 91 30 121 56 - 177 177
South London (Beddington) 138 11 149 50 - 199 199
Avonmouth 7 38 45 207 - 252 252
Total 1,136 123 1,261 345 (77) 1,529 1,551
Peterborough financed by local
(72) - (72) - - (72) (72)
authority
Total impact on net debt 1,064 123 1,189 345 (77) 1,457 1,479
- Managing projects under construction closely
- Debt includes £1,189m(1) for Runcorn II / Exeter / Oxford / Cardiff / Glasgow / Dunbar / South London / Avonmouth
(1) Excluding capitalised interest, £6.7m in H1 2017/18 and £80.7m cumulatively
(2) Includes £8m relating to amounts to be recovered from prior year
(3) Spend in excess of the original budget will be subject to a contractual claim process with Interserve
66 Pennon Half Year Results 2017/18 © Pennon Group plc 2017Viridor
ERFs (including Joint Ventures)
Base load
Capital municipal Actual/expected
Progress on ERF pipeline Site Cost (1) Gross capacity Status contract commissioning
Tonnes Electricity
£m
(000) MWe
Lakeside(2) 150 410 38 Fully operational Merchant Commissioned
ERF portfolio build-out Bolton N/A 120 9 Fully operational
Greater
Commissioned
nearing completion Exeter 47 60 3 Fully operational
Manchester
Devon Commissioned
Oxford
204 300 24 Fully operational Oxfordshire Commissioned
(Ardley)
Cardiff Gwyrdd
207 360 28 Fully operational Commissioned
(Trident Park) (SE Wales)
Greater
Runcorn I(2) 236 375 28(3) Fully operational Commissioned
Manchester
Runcorn II 216 375 41 Fully operational Merchant Commissioned
Peterborough 72 80 7 Fully operational Peterborough Commissioned
Glasgow 155 200 15 Commissioning Glasgow 2017
South London
199 275 26 Commissioning S London H2 2017/18
(Beddington)
Early
Dunbar 177 300 23(4) Clyde Valley H2 2017/18
commissioning
Construction in
Avonmouth 252 320 34 Somerset 2020/21
progress
Grand Total 3,175 276
(1) Capital cost excludes capitalised interest and for projects for which the Engineering Procurement Construction
(EPC) contract has not yet been executed, capital cost may vary in accordance with the Euro exchange rate
(2) Joint ventures economic interest (Lakeside 50%; Runcorn I 37.5%)
(3) Plus heat 51MWth
(4) Plus heat 17MWth
67 Pennon Half Year Results 2017/18 © Pennon Group plc 2017An Energy Recovery Facility
© Pennon Group plc 2017Ardley ERF in Oxfordshire, UK
Transforming residual waste into vital baseload energy
Weighbridge
Flue gas
Bunker and treatment Steam
Waste cranes turbine
IBA
Processing Tipping hall
Hall Boiler Hall
hall
Air cooled
condenser
69 Pennon Half Year Results 2017/18 © Pennon Group plc 2017US Roadshow Presentation
November 2017
© Pennon Group plc 2017You can also read