Severe Storms - Severe Weather
←
→
Page content transcription
If your browser does not render page correctly, please read the page content below
Section 5.4.8: Risk Assessment – Severe Storms

              Severe Storms
The following section provides the hazard profile and vulnerability assessment for the severe storm hazard in
Chenango County.

5.4.8.1 Hazard Profile
This section presents information regarding the description, extent, location, previous occurrences and losses,
climate change projections and probability of future occurrences for the severe storm hazard.

Hazard Description
For this HMP the severe storm hazard includes: thunderstorms, lightning, hail, tornadoes, high winds, and
hurricanes/tropical storms, which are defined below.

Thunderstorms
A thunderstorm is a local storm produced by a cumulonimbus
                                                                               Thunderstorms can lead to flooding,
cloud and accompanied by lightning and thunder (NWS 2009a).               landslides, strong winds, and lightning. Roads
A thunderstorm forms from a combination of moisture, rapidly                 could become impassable from flooding,
rising warm air, and a force capable of lifting air, such as a warm         downed trees or power lines, or a landslide.
and cold front, a sea breeze, or a mountain. Thunderstorms form           Downed utility poles can lead to utility losses,
from the equator to as far north as Alaska. Although                        such as electricity, phone, and water (from
                                                                            loss of pumping and filtering capabilities).
thunderstorms generally affect a small area when they occur, they
have the potential to become dangerous due to their ability in
generating tornadoes, hailstorms, strong winds, flash flooding,
and lightning. The NWS considers a thunderstorm severe only if it produces damaging wind gusts of 58 mph or
higher or large hail one-inch (quarter size) in diameter or larger or tornadoes (NWS 2020).

Lightning

   Lightning can damage homes and injure people. In        Lighting is a bright flash of electrical energy produced by
     the United States, an average of 300 people are        a thunderstorm. The resulting clap of thunder is the result
   injured, and 80 people are killed by lightning each      of a shock wave created by the rapid heating and cooling
  year. Typical thunderstorms are 15 miles in diameter      of the air in the lightning channel. All thunderstorms
    and last an average of 30 minutes. An estimated         produce lightning and are very dangerous. Lightning ranks
  100,000 thunderstorms occur each year in the United
                                                            as one of the top weather killers in the United States,
      States, with approximately 10 percent of them
      classified as severe. During the warm season,         killing approximately 50 people and injuring hundreds
 thunderstorms are responsible for most of the rainfall.    each year. Lightning can occur anywhere there is a
                                                           thunderstorm. Lightning can be cloud to cloud, cloud to
                                                           air, and cloud to ground.

Hailstorms
Hail forms inside a thunderstorm where there are strong updrafts of warm air and downdrafts of cold water. If a
water droplet is picked up by the updrafts, it can be carried well above the freezing level. Water droplets freeze
when temperatures reach 32 °F or colder. As the frozen droplet begins to fall, it might thaw as it moves into
warmer air toward the bottom of the thunderstorm, or the droplet might be picked up again by another updraft
and carried back into the cold air to re-freeze. With each trip above and below the freezing level, the frozen
droplet adds another layer of ice. The frozen droplet, with many layers of ice, falls to the ground as hail. Most
hail is small and typically less than two inches in diameter (NWS 2009).

Chenango County, New York Hazard Mitigation Plan                                                                  5.4.8-1
MONTH 2021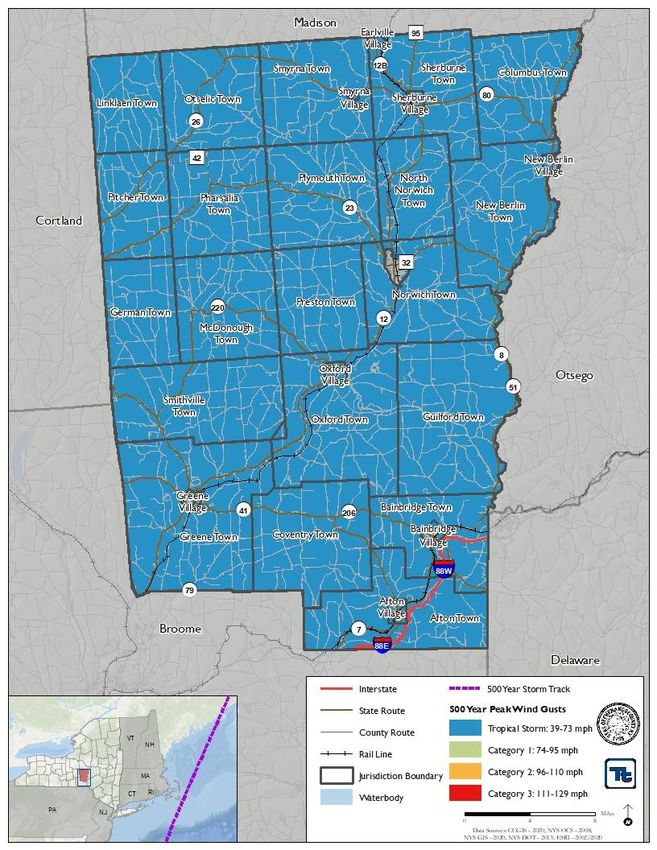
Section 5.4.8: Risk Assessment – Severe Storms

High Winds
Wind begins with differences in air pressures. It is rough horizontal movement of air caused by uneven heating
of the earth’s surface. Wind occurs at all Figure 5.4.8-1. Recorded Event Records
scales, from local breezes lasting a few
minutes to global winds resulting from
solar heating of the earth (Rosenstiel
School of Marine & Atmospheric
Science 2005). High winds are often
associated by other severe weather
events such as thunderstorms, tornadoes,
hurricanes, and tropical storms.

Tornadoes
A tornado appears as a rotating, funnel-shaped cloud that extends from a thunderstorm to the ground with
whirling winds that can reach 250 miles per hour (mph). Damage paths can be greater than 1 mile wide and 50
miles long. Tornadoes typically develop from either a severe thunderstorm or hurricane as cool air rapidly
overrides a layer of warm air. Tornadoes typically move at speeds between 30 and 125 mph and can generate
combined wind speeds (forward motion and speed of the whirling winds) exceeding 300 mph. The lifespan of a
tornado rarely is longer than 30 minutes (FEMA 1997). Tornadoes can occur at any time of the year, with peak
seasons at different times for different states (NSSL 2013).

Hurricanes/Tropical Storms
Tropical cyclones are fueled by a different heat mechanism than other cyclonic windstorms, such as Nor’easters
and polar lows. The characteristic that separates tropical storms from other cyclonic systems is that at any height
in the atmosphere, the center of a tropical storm will be warmer than its surroundings, a phenomenon called
warm core storm systems (NOAA 2013). Tropical cyclones strengthen when water evaporated from the ocean
is released as the saturated air rises, resulting in condensation of water vapor contained in the moist air. Tropical
cyclones begin as disturbed areas of weather, often referred to as tropical waves. As the storm organizes, it is
designated as a tropical depression.

A tropical storm system is characterized by a low-pressure center and numerous thunderstorms that produce
strong winds of 39 to 73 mph and heavy rain. A hurricane is a tropical storm that attains hurricane status when
its wind speed reaches 74 mph or higher. Tropical systems can develop in the Atlantic between the Lesser
Antilles and the African coast or in the warm tropical waters of the Caribbean Sea and Gulf of Mexico. These
storms can move up the Atlantic coast of the United States, impacting the eastern seaboard, or move into the
United States through the states along the Gulf Coast, bringing wind and rain as far north as New England before
moving eastward offshore.

Despite Chenango County being located inland, coastal storms like tropical storms and hurricanes can impact
the county (NYS DHSES 2019). Hurricanes and tropical storms can impact Chenango County during the official
eastern U.S. hurricane season from June to November. However, late July to early October is the most likely
period for hurricanes and tropical storms to impact Chenango County, due to the cooling of the North Atlantic
Ocean waters (NYS DHSES 2014).

Location
The totality of Chenango County is exposed to hail, lightning, windstorms, high wind, thunderstorms, tornadoes,
hurricanes, and tropical storms. Additionally, all of the county is subject to high winds from severe weather

Chenango County, New York Hazard Mitigation Plan                                                             5.4.8-2
MONTH 2021
Section 5.4.8: Risk Assessment – Severe Storms

events. According to the FEMA Winds Zones of the United States map, Chenango County is located in both
Wind Zones II and III, where wind speeds can reach up to 200 mph. Figure 5.4.8-2 illustrates wind zones across
the United States, which indicate the impacts of the strength and frequency of wind activity per region. The
information on the figure is based on 40 years of tornado data and 100 years of hurricane data collected by
FEMA.

Figure 5.4.8-2 Wind Zones in the United States

Note: The black oval indicates the approximate location of Chenango County.

Extent
The extent (severity or magnitude) of a severe storm is largely dependent upon the most damaging aspects of
each type of severe weather. This section describes the extent of thunderstorms, lighting, hail, windstorms,
tornadoes, hurricanes, and tropical storms in Chenango County.

Thunderstorms
Severe thunderstorm watches and warnings are issued by the local NWS office and the Storm Prediction Center
(SPC). The NWS and SPC will update the watches and warnings and notify the public when they are no longer
in effect. Watches and warnings for tornadoes in New York State are as follows:

Chenango County, New York Hazard Mitigation Plan                                                                     5.4.8-3
MONTH 2021
Section 5.4.8: Risk Assessment – Severe Storms
• A severe thunderstorm watch is issued by the National Weather Service when there are conditions
favorable to severe storm development in the watch area which varies per storm. By definition, a severe
thunderstorm is a thunderstorm that produces one inch hail or larger in diameter and/or winds equal or
exceed 58 miles an hour. They are usually issued for a duration of 4 to 8 hours. Watches are normally
issued in advance of the occurrence of severe weather. (NWS 2020).
• Severe Thunderstorm Warnings are issued when a thunderstorm that can produce hail in excess of one
inch and/or winds greater than or equal to 58 mph is indicated by radar. Isolated tornado development
can also occur. (NWS 2020).
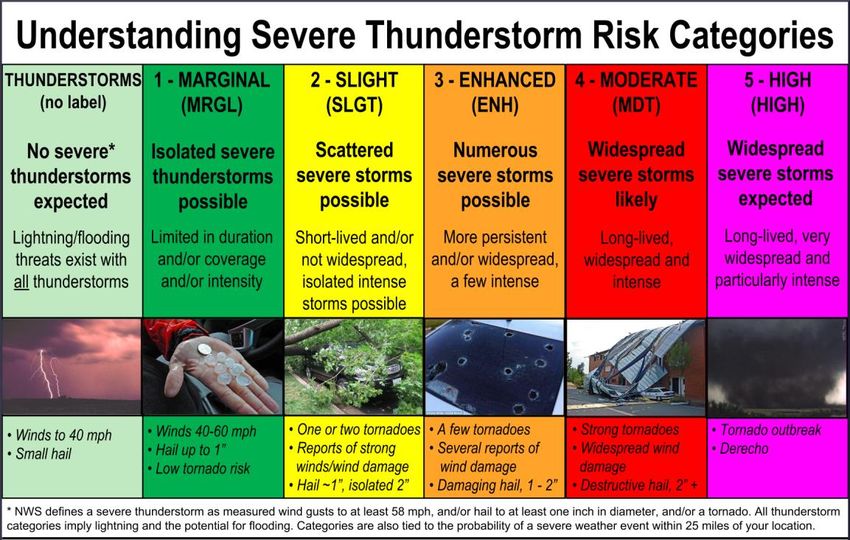
Special Weather Statements for Near Severe Thunderstorms are issued for strong thunderstorms that are below
severe levels but still might have some adverse impacts. Usually, they are issued for the threat of wind gusts of
40 to 58 mph or small hail less than one-inch in diameter (NWS 2009b). Figure 5.4.8-3 presents the severe
thunderstorm risk categories, as provided by the SPC.
Figure 5.4.8-3 Severe Thunderstorm Risk Categories
Source: NOAA SPC 2017
Lightning
Lightning is most often associated with moderate to severe thunderstorms. The severity of lightning refers to the
frequency of lightning strikes during a storm. The New York City Office of Emergency Management notes that
lightning strikes occur with moderate frequency in the State of New York, with 3.8 strikes occurring per square
mile each year. Multiple devices are available to track and monitor the frequency of lightning (NYC Emergency
Management, 2020).
Hailstorms
The severity of hail is measured by hail size, duration, and geographic extent. Most hail stones from hail storms
vary in size. Most hailstorms produce stones that are the size of a marble or smaller and do not present damage
Chenango County, New York Hazard Mitigation Plan 5.4.8-4
MONTH 2021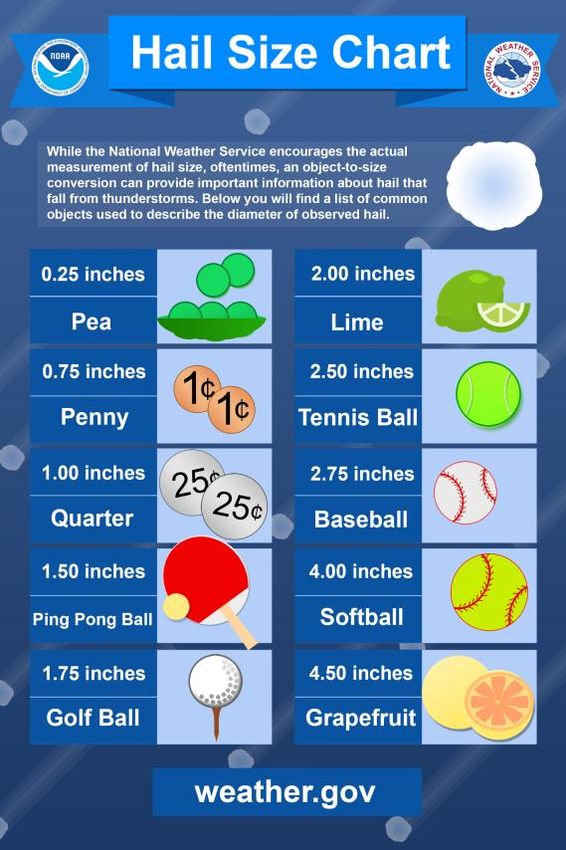
Section 5.4.8: Risk Assessment – Severe Storms

to structures (NYS DHSES 2019). The size of hail is estimated by comparing it to a known object. Figure 5.4.8-4
shows the different sizes of hail and the comparison to real-world objects.

Figure 5.4.8-4 Hail Size

The Tornado and Storm Research Organization (TORRO) has determined ratings typical damage and hail sizes
using the Hailstorm Intensity Scale (H0 to H10).

Table 5.4.8-1. TORRO Hailstorm Intensity Scale

     TORRO                                Typical Hail
   Hailstorm                               Diameter
 Intensity Scale   Intensity Category        (mm)                            Typical Damage Impacts
       H0               Hard Hail              5                                     No damage
       H1          Potentially Damaging       5-15                    Slight general damage to plants, crops
       H2               Significant          10-20                Significant damage to fruit, crops, vegetation
                                                          Severe damage to fruit and crops, damage to glass and plastic
       H3                  Severe            20-30
                                                                         structures, paint and wood scored
       H4                  Severe            25-40            Widespread glass damage, vehicle bodywork damage
                                                         Wholesale destruction of glass, damage to tiled roofs, significant
       H5              Destructive           30-50
                                                                                   risk of injuries
       H6              Destructive           40-60          Bodywork of grounded aircraft dented, brick walls pitted
       H7              Destructive           50-75                 Severe roof damage, risk of serious injuries
       H8              Destructive           60-90                     Severe damage to aircraft bodywork
                                                         Extensive structural damage. Risk of severe or even fatal injuries
       H9            Super Hailstorms       75-100
                                                                            to persons caught in the open
                                                         Extensive structural damage. Risk of severe or even fatal injuries
      H10            Super Hailstorms        >100
                                                                            to persons caught in the open

Chenango County, New York Hazard Mitigation Plan                                                                  5.4.8-5
MONTH 2021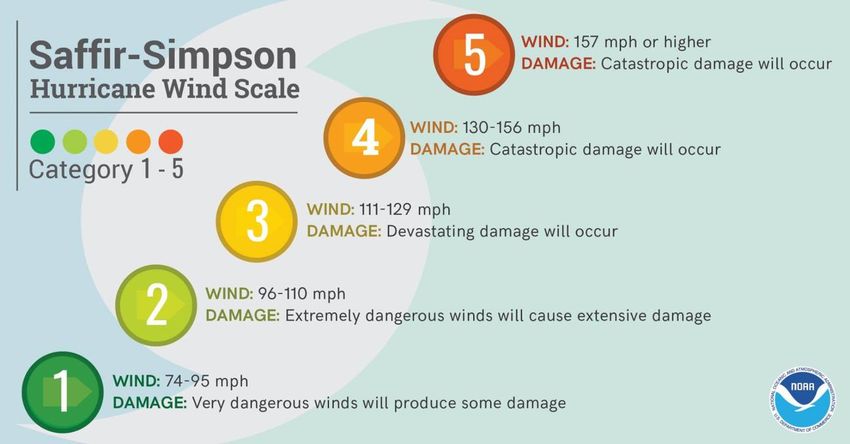
Section 5.4.8: Risk Assessment – Severe Storms
Source: TORRO 2020
High Winds
The following table provides the descriptions of winds and their associated sustained wind speed used by the
NWS during wind-producing events. The Beaufort wind scale, developed in 1805, is also used today to classify
wind conditions (refer to https://www.spc.noaa.gov/faq/tornado/beaufort.html for details).
Table 5.4.8-2. NWS Wind Descriptions
Sustained Wind Speed
Descriptive Term (mph)
Strong, dangerous, or damaging ≥ 40
Very Windy 30-40
Windy 20-30
Breezy, brisk, or blustery 15-25
None 5-10/ 10-15/ 10-20
Light or light and variable wind 0-5
Source: NWS 2010
mph miles per hour
The NWS issues advisories and warnings for winds. Issuance is normally site-specific. High wind advisories,
watches, and warnings are products issued by the NWS when wind speeds can pose a hazard or are life
threatening. The criterion for each of these varies from state to state. According to the NWS (2020), wind
warnings and advisories for New York State are as follows:
• High Wind Warnings are issued when sustained wind speeds of 40 mph or greater lasting for one hour
or longer or for winds of 58 mph or greater for any duration or widespread damage are possible.
• Wind Advisories are issues when sustained winds of 30 to 39 mph are forecast for one hour or longer,
or wind gusts of 46 to 57 mph for any duration.
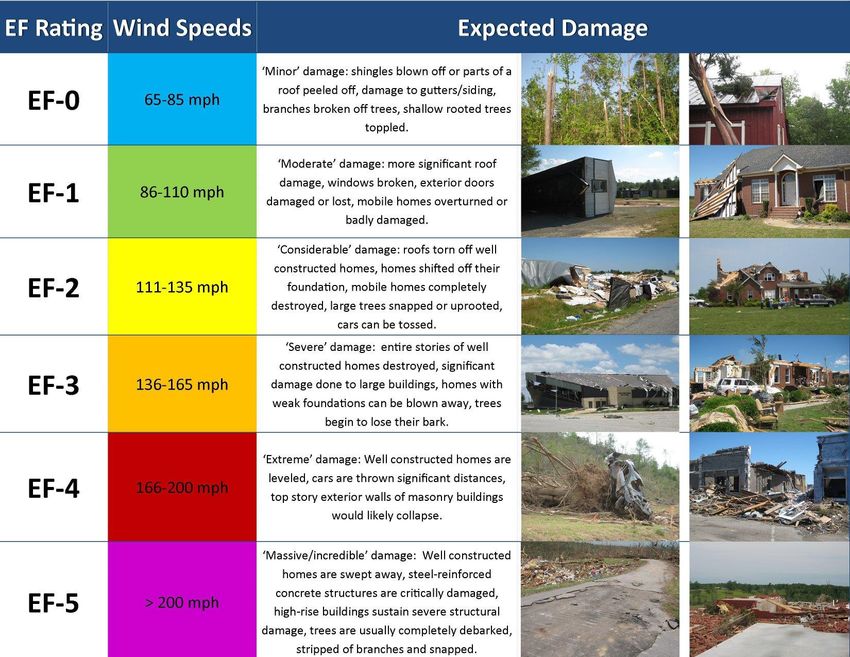
Tornadoes
The magnitude or severity of a tornado is categorized using the Enhanced Fujita Tornado Intensity Scale (EF
Scale). This is the scale now used exclusively for determining tornado ratings by comparing wind speed and
actual damage. Figure 5.4.8-5. illustrates the relationship between EF ratings, wind speed, and expected tornado
damage.
Chenango County, New York Hazard Mitigation Plan 5.4.8-6
MONTH 2021
Section 5.4.8: Risk Assessment – Severe Storms

Figure 5.4.8-5. Explanation of EF-Scale Ratings

Source: Cornell University 2018

Tornado watches and warning are issued by the local NWS office. A tornado watch is released when tornadoes
are possible in an area. A tornado warning means a tornado has been sighted or indicated by weather radar. The
current average lead time for tornado warnings is 13 minutes. Occasionally, tornadoes develop so rapidly, that
little, if any, advance warning is possible (NOAA SPC 2018).

Hurricanes/Tropical Storms
The extent of a hurricane or tropical storm is commonly categorized in accordance with the Saffir-Simpson
Hurricane Wind Scale, which assigns a designation of tropical storm for storms with sustained wind speeds
below 74 mph and a hurricane category rating of 1–5 based on a hurricane’s increasing sustained wind speed.
This scale estimates potential property damage. Hurricanes reaching Category 3 and higher are considered major
hurricanes because of their potential for significant loss of life and damage. Tropical Storms and Category 1 and
2 storms are still dangerous and require preventative measures (NOAA 2013). Figure 5.4.8-6 presents this scale,
which is used to estimate the potential property damage and flooding expected when a hurricane makes landfall.

Chenango County, New York Hazard Mitigation Plan                                                         5.4.8-7
MONTH 2021

Section 5.4.8: Risk Assessment – Severe Storms

Figure 5.4.8-6. The Saffir-Simpson Hurricane Wind Scale

Source: NOAA, 2020

In evaluating the potential for hazard events of a given magnitude, a mean return period (MRP) is often used.
The MRP provides an estimate of the magnitude of an event that might occur within any given year based on
past recorded events. The MRP is the average period, in years, between occurrences of a hazard event, equal to
the inverse of the annual frequency of exceedance (Dinicola 2009).

Peak wind speed projections were generated using HAZUS-MH v4.2. HAZUS-MH v4.2 estimated the maximum
3-second gust wind speeds for Chenango County to be below 39 mph for the 100-year MRP event and not strong
enough to be considered a tropical storm. The maximum 3-second gust wind speeds for Chenango County range
from 51 to 64 mph for the 500-year MRP event (tropical storm). The associated impacts and losses from these
100-year and 500-year MRP hurricane event model runs are reported in the Vulnerability Assessment. Figure
5.4.8-7. shows the estimated maximum 3-second gust wind speeds that can be anticipated in the study area
associated with the 500-year MRP events.

Chenango County, New York Hazard Mitigation Plan                                                       5.4.8-8
MONTH 2021
Section 5.4.8: Risk Assessment – Severe Storms

Figure 5.4.8-7. Wind Speeds for the 500-Year MRP Event

Chenango County, New York Hazard Mitigation Plan                                                5.4.8-9
MONTH 2021
Section 5.4.8: Risk Assessment – Severe Storms

Previous Occurrences and Losses
Many sources have provided historical information regarding previous occurrences and losses associated with
severe storm events in Chenango County. According to NOAA-NCEI Storm Events Database, Chenango
County has been impacted by 254 severe storm events that caused three fatalities, 10 injuries, $5.2 million in
property damage, and $25,000 in crop damage.

Table 5.4.8-3. Severe Storm Events 1950- 2020
                                         Number of                                                                Total
                                    Occurrences Between                                        Total            Property         Total Crop
        Hazard Type*                  1950 and 2020**             Total Fatalities            Injuries         Damage ($)        Damage ($)
         Funnel Cloud                           2                         0                      0                  $0                   $0
               Hail                             46                        0                      0               $15,000           $15,000
          Heavy Rain                            2                         0                      0                $5,000                 $0
          High Wind                             12                        0                      0               $589,760                $0
           Hurricane                            0                         0                      0                  $0                   $0
           Lightning                            5                         0                      1               $10,000                 $0
         Strong Wind                            2                         0                      0               $11,000                 $0
      Thunderstorm Wind                        172                        1                      4            $1.722 million           $2,000
            Tornado                             13                        2                      5             $2.82 million             $0
      Tropical Depression                       0                         0                      0                  $0                   $0
        Tropical Storm                          0                         0                      0                  $0                   $0
           TOTAL                               254                        3                      10           $5.207 million       $25,000
Source:NOAA-NCEI 2020; NHC 2018
* Remnants from tropical systems are included in other hazard totals
**Includes only one occurrence per storm event- excludes multiple listings for the same day

FEMA Disaster Declarations
Between 1954 and 2020, New York State was included in 65 FEMA declared severe storm-related major disaster
declarations (DR) or emergencies (EM) classified as one or a combination of the following hazards: coastal
storm, high tides, heavy rain, flooding, hurricane, ice storm, severe storms, thunderstorms, tornadoes, tropical
storm, straight-line winds, and landslides. Of those declarations, Chenango County was included in 17
declarations (FEMA 2018). Table 5.4.8-4 lists FEMA DR and EM declarations for Chenango County.

Table 5.4.8-4. Severe Storm-Related FEMA Declarations for Chenango County, 1954 to 2020
    Disaster                                           Declaration          Incident
    Number                    Event Date                  Date                Type                                  Title
     DR-4480           January 20, 2020 -- Ongoing       3/20/2020         Biological                        COVID-19 Pandemic
    EM-3434            January 20, 2020 -- Ongoing       3/13/2020         Biological                             COVID-19
                       October 31 -- November 1,                               Severe
     DR-4472                                            12/19/2019                            Severe Storms, Straight-Line Winds, and Flooding
                                 2019                                         Storm(s)
     DR-4397          August 13 -- August 15, 2018       10/1/2018             Flood                      Severe Storms and Flooding
     DR-4322           March 14 -- March 15, 2017        7/12/2017             Snow                   Severe Winter Storm and Snowstorms
     DR-4129             June 26 -- July 10, 2013        7/12/2013             Flood                      Severe Storms and Flooding
                       October 27 -- November 8,
    EM-3351                                             10/28/2012         Hurricane                           Hurricane Sandy
                                 2012
                      September 7 -- September 11,                             Severe
     DR-4031                                             9/13/2011                                      Remnants of Tropical Storm Lee
                                 2011                                         Storm(s)
                      September 7 -- September 11,                             Severe
    EM-3341                                               9/8/2011                                      Remnants of Tropical Storm Lee
                                 2011                                         Storm(s)

Chenango County, New York Hazard Mitigation Plan                                                                                         5.4.8-10
MONTH 2021
Section 5.4.8: Risk Assessment – Severe Storms
Disaster Declaration Incident
Number Event Date Date Type Title
Severe Storms, Flooding, Tornadoes, and Straight-
DR-1993 April 26 -- May 8, 2011 6/10/2011 Flood
Line Winds
Severe
DR-1857 August 8 -- August 10, 2009 9/1/2009 Severe Storms and Flooding
Storm(s)
December 11 -- December 31, Severe
EM-3299 12/18/2008 Severe Winter Storm
2008 Storm(s)
November 16 -- November Severe
DR-1670 12/12/2006 Severe Storms and Flooding
17, 2006 Storm(s)
Severe
DR-1650 June 26 -- July 10, 2006 7/1/2006 Severe Storms and Flooding
Storm(s)
EM-3262 August 29 -- October 1, 2005 9/30/2005 Hurricane Hurricane Katrina Evacuation
Severe
DR-1589 April 2 -- April 4, 2005 4/19/2005 Severe Storms and Flooding
Storm(s)
September 16 -- September Severe
DR-1565 10/1/2004 Tropical Depression Ivan
24, 2004 Storm(s)
Severe
DR-1534 May 13 -- June 17, 2004 8/3/2004 Severe Storms and Flooding
Storm(s)
EM-3186 August 14 -- August 16, 2003 8/23/2003 Other Power Outage
Severe Ice
DR-1467 April 3 -- April 5, 2003 5/12/2003 Ice Storm
Storm
February 17 -- February 18,
EM-3184 3/27/2003 Snow Snow
2003
December 25 -- January 4,
EM-3173 2/25/2003 Snow Snowstorms
2002
DR-1391 11-Sep-01 9/11/2001 Fire Fires and Explosions
EM-3155 May 22 -- November 1, 2000 10/11/2000 Other West Nile Virus
Severe
DR-1335 May 3 -- August 12, 2000 7/21/2000 Severe Storms and Flooding
Storm(s)
Severe
DR-1222 May 31 -- June 2, 1998 6/16/1998 Severe Storms and Tornadoes
Storm(s)
January 19 -- January 30,
DR-1095 1/24/1996 Flood Severe Storms and Flooding
1996
EM-3107 March 13 – March 17, 1993 3/17/1993 Snow Severe Blizzard
DR-338 June 23, 1972 6/23/1972 Flood Tropical Storm Agnes
Source: FEMA 2020
USDA Declarations
Between 2015 and 2020, Chenango County was included in five severe storm-related USDA Disaster
Designations; refer to Table 5.4.8-5 below for more information.
Table 5.4.8-5. USDA Severe Storm Disaster Designations for Chenango County, 2015-2020
Designation Declaration
Number Event Date Date Incident Type Description
S3885 May 1 – July September 9, Excessive rain, moisture, Excessive Rain, High
14, 2015 2015 humidity; Hail; Wind, High Winds, Hail, Lightning, and
Winds; Tornadoes; Lightning Tornado
S4265 April 1, December 13, Excessive rain, moisture, humidity Excessive Rain
2017 2017
S4479 July 23, April 10, Excessive rain, moisture, humidity Excessive Precipitation
2018 2019
S4622 April 1, January 29, Excessive rain, moisture, humidity Excessive Rain
2019 2020
S4623 April 15, January 29, Excessive rain, moisture, Excessive Rain, Flash
2019 2020 humidity; Flood, Flash Flooding Flooding, and Flooding
Chenango County, New York Hazard Mitigation Plan 5.4.8-11
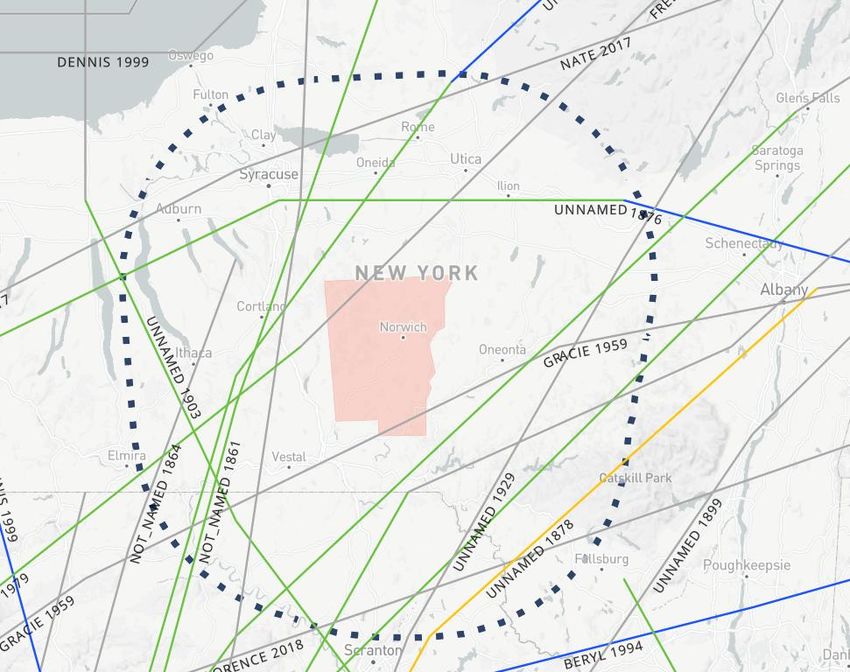
MONTH 2021Section 5.4.8: Risk Assessment – Severe Storms Previous Events Figure 5.4.8-8 from the NOAA Historical Hurricane Tracker illustrates the tracks of storms between 1842 and 2020 within 65 miles of Chenango County. Chenango County is rarely impacted by tropical systems but has recently experienced the direct and indirect landward effects associated with hurricanes and tropical storms, including Tropical Storm Lee in 2011 and Superstorm Sandy in 2012. Figure 5.4.8-8. Historical Hurricane Tracks within 65 miles of Chenango County, 1878 to 2018 Source:NOAA Historical Hurricane Tracks 2020 Note:Category refers to tropical cyclone strength. TS: Tropical Storm, TD: Tropical Depression, ET: Extra-tropical Storm, H1: Category 1 Hurricane, H2: Category 2 Hurricane, H3: Category 3 Hurricane, H4: Category 4 Hurricane. The NOAA National Centers for Environmental Information (NCEI) Storm Events database records severe storm events. For this HMP update, known severe storm events that have impacted Chenango County between July 2014 and 2020 are identified in Table 5.4.8-6. With severe storm documentation for New York State and Chenango County being extensive, not all sources have been identified or researched. Therefore, Table 5.4.8-6 might not include all events that have occurred in the county. For events prior to 2014, refer to Appendix E (Supplementary Data). For detailed information on damages and impacts to each municipality, refer to Section 9 (Jurisdictional Annexes). Chenango County, New York Hazard Mitigation Plan 5.4.8-12 MONTH 2021
Section 5.4.8: Risk Assessment – Severe Storms

Table 5.4.8-6. Severe Storm Events in Chenango County, July 2014 to 2020

                                             FEMA
                                         Declaration
                                            Number          County
  Dates of Event      Event Type        (if applicable)   Designated?                                            Event Details*
                                                                         Severe thunderstorms blew down trees on Bartlett Road and Route 23 in South Plymouth,
   July 1, 2014    Thunderstorm Wind         N/A              No
                                                                                    North Road in Plymouth, and took down trees and wires in Norwich.
                                                                         A cold front interacting with humid, warm air from a tropical system caused large winds up
   July 3, 2014    Thunderstorm Wind         N/A              No
                                                                                   to 50 knots, resulting in downed trees in Earlville and along Route 12B.
   July 7, 2014    Thunderstorm Wind         N/A              No                         Severe thunderstorms blew down trees and wires in Oxford.
                                                                          In East Pharsalia, severe thunderstorms blew down trees on County Route 7 and poles on
   July 8, 2014    Thunderstorm Wind         N/A              No
                                                                                                                County Route 10.
   July 9, 2014    Thunderstorm Wind         N/A              No                               Severe thunderstorms blew town trees in Norwich
                                                                        Severe thunderstorms affecting Chenango County blew down trees in McDonough, Preston,
                   Thunderstorm Wind;
   Sept. 2, 2014                             N/A              No         North Afton, and formed an EF-1 tornado that touched down near the intersection of Saint
                        Tornado
                                                                                                Johns Road and Hill Top Drive in Bennettsville.
                                                                           Severe thunderstorms resulted in blown-down trees and downed lines near Oxford and
  June 12, 2015    Thunderstorm Wind         N/A              No
                                                                                                   blown-down trees near Bainbridge/Afton.
                                                                        A thunderstorm resulted in downed trees in New Berlin near the intersection of Route 8 and
  July 15, 2016    Thunderstorm Wind         N/A              No
                                                                                                                 Turnpike Road.
  July 19, 2015    Thunderstorm Wind         N/A              No                     Bainbridge saw downed trees resulting from a severe thunderstorm.
 August 13, 2015   Thunderstorm Wind         N/A              No                             A thunderstorm caused downed trees in New Berlin.
                                                                         Severe thunderstorms caused 50 knot winds and downed trees and wires on Route 22 near
  April 16, 2017   Thunderstorm Wind         N/A              No
                                                                                                       East McDonough and in Norwich.
                                                                            Severe thunderstorms resulted in reported 65 knot winds in Oxford, where trees were
                                                                         uprooted trees, which impacted the intersection of Routes 12 and 80 in Sherburne. Preston,
   May 1, 2017     Thunderstorm Wind         N/A              No
                                                                        New Berlin, Oxford, and Guilford. A microburst caused wind speeds ranging between 90 and
                                                                                    100 mph and uprooted 100 healthy trees near the Norwich Reservoir.
                                                                        Trees and wires were downed by a severe thunderstorm that impacted Preston, Pharsalia, and
  June 30, 2017    Thunderstorm Wind         N/A              No
                                                                                                                     Willet.
                                                                          A severe thunderstorm caused damage to trees and power lines in Bainbridge, Smithville
  August 4, 2017   Thunderstorm Wind         N/A              No
                                                                                                         Flats, Oxford, and Sherburne.
                                                                           Thunderstorms with wind speeds up to 65 knots knocked over trees in McDonough and
 August 12, 2017   Thunderstorm Wind         N/A              No
                                                                                                                   Norwich.
   May 4, 2018     Thunderstorm Wind         N/A              No            Cortland Street in Norwich experienced downed trees and wires, sparking a grass fire.
                                                                           County Route 3A in Greene, Tall Pines Campground in East Guilford, and Brisben each
  June 13, 2018    Thunderstorm Wind         N/A              No
                                                                           experienced impacts from a thunderstorm that produced wind speeds of up to 50 knots.
   February 25,
                       High Wind             N/A              No                   Strong winds up to 50 knots caused impacts to the County and region.
      2019
                                                                        Afton saw impacts from 50 knot winds resulting from a strong thunderstorm. Winds brought
  July 19, 2019    Thunderstorm Wind         N/A              No
                                                                                                down trees and wires on Long Hill Road.
  July 30, 2019           Hail               N/A              No                 Severe thunderstorms produced hail up to one inch in size in Lincklaen.

Chenango County, New York Hazard Mitigation Plan                                                                                                           5.4.8-13
MONTH 2021
Section 5.4.8: Risk Assessment – Severe Storms
FEMA
Declaration
Number County
Dates of Event Event Type (if applicable) Designated? Event Details*
August 8, 2018 Thunderstorm Wind N/A No A thunderstorm impacting Central New York brought downed trees to Oxford,
Severe thunderstorms moved through Central New York and brought down a tree along
August 18, 2019 Thunderstorm Wind N/A No
Route 235 in Coventry.
October 31, Severe thunderstorms with winds up to 50 knots brought down multiple trees near Smyrna
Thunderstorm Wind N/A No
2019 and Plymouth.
Source(s):FEMA 2020; NOAA-NCEI 2020
* Many sources were consulted to provide an update of previous occurrences and losses; event details and loss/impact information may vary and has been summarized in the above table
FEMA Federal Emergency Management Agency
HMP Hazard Mitigation Plan
NCDC National Centers for Environmental Information
NOAA National Oceanic and Atmospheric Administration
NWS National Weather Service
NYS New York State
Chenango County, New York Hazard Mitigation Plan 5.4.8-14
MONTH 2021Section 5.4.6: Risk Assessment – Severe Storms
Climate Change Projections
The projected increase in
Figure 5.4.8-9. Projected Seasonal Precipitation Change in Region
precipitation is expected to fall in
3, 2050s (% change)
heavy downpours and less in light
rains. Downpours are likely to
increase in intensity and frequency.
That change that has the potential to
affect drinking water through flood
key rail lines, roadways, and
transportation hubs, flooding
contaminating wells, heighten the
risk of riverine flooding; and
increase delays and hazards related to extreme weather events (NYSERDA 2011). Less frequent rainfall during
the summer months can impact the ability of water supply systems to provide water. Increasing water
temperatures in rivers and streams will affect aquatic health and reduce the capacity of streams to assimilate
effluent wastewater treatment plants and industrial discharges (NYSERDA 2011). Figure 5.4.8-9 shows the
projected seasonal precipitation changes for Southern Tier ClimAID Region (NYSERDA 2014).
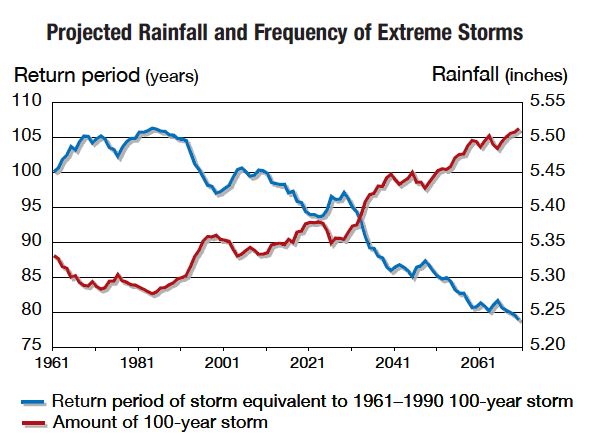
Figure 5.4.8-10 displays the projected rainfall and frequency of extreme storms in New York State. The amount
of rainfall in a 100-year event is projected to increase. However, the number of years between such storms (return
period) is projected to decrease. Rainstorms will become more severe and more frequent (NYSERDA 2011).
Figure 5.4.8-10. Projected Rainfall and Frequency of Extreme Storms
Source:NYSERDA 2011
Probability of Future Occurrences
Table 5.4.8-7 summarizes data regarding the probability of occurrences of severe storm events in Chenango
County based on the historic record. Thunderstorm events are the most common in Chenango County, followed
by hail events. The information used to calculate the probability of occurrences is based solely on NOAA-NCEI
storm events database results.
Chenango County, New York Hazard Mitigation Plan 5.4.8-15
MONTH 2021Section 5.4.6: Risk Assessment – Severe Storms
Table 5.4.8-7. Probability of Future Occurrence of Severe Storm Events
Number of Occurrences Between 1954 % Chance of Occurring in
Hazard Type and 2020 Any Given Year
Funnel Cloud 2 3.0
Hail 46 68.7
Heavy Rain 2 3.0
High Wind 12 18.0
Hurricane 0 N/A
Lightning 5 7.5
Strong Wind 2 3.0
Thunderstorm Wind 172 100.0
Tornado 13 19.4
Tropical Depression 0 N/A
Tropical Storm 0 N/A
TOTAL 254 100.0
Source: NOAA-NCEI 2020
Note: Hazard occurrences include federally declared disasters since the 1950 Federal Disaster Relief Act. Due to limitations in data, not all severe
storm events occurring between 1954 and 1996 are accounted for in the tally of occurrences. As a result, the number of hazard occurrences is
underestimated.
Chenango County is expected to continue experiencing direct and indirect impacts of severe storms annually.
These storms may induce secondary hazards such as flooding and utility failure. In Section 5.3 (Hazard Ranking),
the identified hazards of concern for Chenango County were ranked. The probability of occurrence, or likelihood
of the event, is one parameter used for hazard rankings. Based on historical records and input from the Planning
Committee, the probability of occurrence for severe storms in the county is considered ‘frequent’ (100% annual
chance of occurring; occurring multiple times a year).
5.4.8.2 Vulnerability Assessment
A probabilistic assessment was conducted for the 100-year and 500-year MRP hurricane wind event through a
Level 2 analysis in HAZUS-MH v4.2 to analyze the severe storm hazard and provide a range of loss estimates
due to wind impacts. Refer to Section 5.1 (Methodology and Tools) for additional details on the methodology
used to assess the severe storm risk.
Impact on Life, Health and Safety
The impact of a severe weather event and wind on life, health and safety is dependent upon several factors including
the severity of the event and whether adequate warning time was provided to residents. For the purposes of this
HMP, all of Chenango County is considered vulnerable to a severe weather event and wind impacts (i.e. 48,438
persons total, American Community Survey 2018). HAZUS-MH v4.2 estimates that no persons will be displaced
from their homes or will seek shelter during a 100-year or 500-year MRP hurricane wind event. Secondary impacts
caused by extreme wind events include downed trees, damaged buildings, and debris carried by high winds, which
can lead to injury or loss of life.
Socially vulnerable populations are most susceptible to severe weather events, based on a number of factors
including their physical and financial ability to react or respond during a hazard and the location and construction
quality of their housing. Vulnerable populations include homeless persons, elderly (over 65 years old), low income
or linguistically isolated populations, people with life-threatening illnesses, and residents living in areas that are
isolated from major roads. The population over the age of 65 is also more vulnerable and, physically, they may
Chenango County, New York Hazard Mitigation Plan 5.4.8-16
MONTH 2021Section 5.4.6: Risk Assessment – Severe Storms
have more difficulty evacuating. They may require extra time or outside assistance during evacuations and are
more likely to seek or need medical attention which may not be available due to isolation during a storm event.
Within Chenango County, there are approximately 9,539 people over the age of 65 and 6,826 people below the
poverty level (American Community Survey 2018).
Additionally, people located outdoors (i.e., recreational activities and farming) are considered most vulnerable to
hailstorms, thunderstorms and tornadoes. This is because there is little to no warning and shelter may not be
available. Moving to a lower risk location will decrease a person’s vulnerability. Refer to Section 4 (County
Profile) for population statistics for each participating jurisdiction.
Impact on General Building Stock
Damage to buildings is dependent upon several factors, including wind speed, storm duration, and path of the
storm track. Building construction also plays a major role in the extent of damage resulting from a coastal storm.
Due to differences in construction, residential structures are generally more susceptible to wind damage than
commercial and industrial structures. Wood and masonry buildings, in general, regardless of their occupancy
class, tend to experience more damage than concrete or steel buildings. Furthermore, high-rise buildings are
also very vulnerable structures.
To better understand these risks, HAZUS-MH v4.2 was used to estimate the expected wind-related building
damages. Table 5.4.8-8 summarizes the definition of the damage categories. HAZUS-MH v4.2 estimates there
will be approximately $0 and $2.3 million of replacement cost damages caused by the 100-year and 500-year
MRP hurricane wind event, respectively (Table 5.4.8-10). Specific types of wind damages are also summarized
in HAZUS-MH v4.2 at the following wind damage categories: no damage/very minor damage, minor damage,
moderate damage, severe damage, and total destruction. HAZUS-MH v4.2 estimates that 5 structures would
experience minor damage during a 500-year MRP hurricane wind event. HAZUS-MH v4.2 estimates no
damages during a 100-year MRP hurricane wind event. Refer to Table 5.4.8-9 for details on damage for all
occupancy classes. Furthermore, HAZUS-MH v4.2 estimated damages are summarized by general occupancy
classes in Table 5.4.8-10. HAZUS-MH v4.2 estimates that most damages caused by severe wind will occur to
residential structures in the County for the 500-year MRP wind events; approximately $2.3 million.
Table 5.4.8-8 Description of Damage Categories
Missile
Roof Window Impacts Roof Wall
Cover Door Roof on Structure Structure
Qualitative Damage Description Failure Failures Deck Walls Failure Failure
No Damage or Very Minor Damage
Little or no visible damage from the
outside. No broken windows, or failed roof ≤ 2% No No No No No
deck. Minimal loss of roof over, with no or
very; Limited water penetration.
Minor Damage
One
Maximum of one broken window, door or
window,
garage door. Moderate roof cover loss that
> 2% and door, or one and
Major roof cover damage, moderate ≤ Typically
> 15% and 1 to 3
window breakage. Minor roof sheathing the larger 5 to 10 No No
≤ 50% panels
failure. Some resulting damage to interior of impacts
of building from water. 20% & 3
Chenango County, New York Hazard Mitigation Plan 5.4.8-17
MONTH 2021Section 5.4.6: Risk Assessment – Severe Storms
Missile
Roof Window Impacts Roof Wall
Cover Door Roof on Structure Structure
Qualitative Damage Description Failure Failures Deck Walls Failure Failure
> the
Severe Damage
larger Typically
Major window damage or roof sheathing > 3 and
> 50% of 20% & 10 to 20 No No
loss. Major roof cover loss. Extensive ≤ 25%
3 impacts
damage to interior from water.
and ≤50%
Destruction
Typically
Complete roof failure and/or, failure of Typically
> 50% > 25% > 20 Yes Yes
wall frame. Loss of more than 50% of roof > 50%
impacts
sheathing.
Source: HAZUS-MH Hurricane Technical Manual
Table 5.4.8-9 Damage State Categories for Buildings During 100-Year and 500-Year MRP Hurricane
Wind Event in Chenango County
100-year 500-year
Total Percent Percent
Number of Buildings in Buildings in
Occupancy Buildings in Severity of Expected Building Occupancy Occupancy
Class Occupancy Damage Count Class Building Count Class
Residential None 25,993 100.0% 25,991 99.9%
Exposure Minor 0 0.0% 2Section 5.4.6: Risk Assessment – Severe Storms
Table 5.4.8-10 Expected Building Damage for 100-Year and 500-Year MRP Hurricane Wind Events for Chenango County
Percent of Total
Building and Contents Estimated Damages
Replacement Cost Estimated Residential Estimated for All Other
Estimated Total Damages Value (RCV) Damages Commercial Damages Occupancies
Total Replacement Cost 100- 100- 100- 100- 100-
Jurisdiction Value (All Occupancies) Year 500-Year Year 500-Year Year 500-Year Year 500-Year Year 500-Year
Afton (T) $864,699,700 $0 $164,508 0.0%Section 5.4.6: Risk Assessment – Severe Storms
Impact on Critical Facilities
Critical facilities are at risk of being impacted by high winds associated with structural damage, or falling tree
limbs/flying debris, which can result in the loss of power. Power loss can greatly impact households, business
operations, public utilities, and emergency personnel. For example, vulnerable populations in Chenango County
are at risk if power loss results in interruption of heating and cooling services, stagnated hospital operations, and
potable water supplies. Emergency personnel such as police, fire, and EMS will not be able to effectively
respond in a power loss event to maintain the safety of its citizens.
HAZUS-MH v4.2 estimates the probability that critical facilities (i.e., medical facilities, fire/EMS, police, EOC,
schools, and user-defined facilities such as shelters and municipal buildings) may sustain minor damage as a
result of the 100-year and 500-year MRP hurricane wind event. Additionally, HAZUS-MH v4.2 estimates the
loss of use for each facility in number of days. Overall, HAZUS-MH v4.2 estimates that no critical facilities in
Chenango County will experience damages or loss of functionality due to a 100-year or 500-year MRP hurricane
wind event.
Impact on Economy
Severe storm events can have short- and long-lasting impacts on the economy. When a business is closed during
storm recovery, there is lost economic activity in the form of day-to-day business and wages to employees.
Overall, economic impacts include the loss of business function (e.g., tourism, recreation), damage to inventory,
relocation costs, wage loss and rental loss due to the repair/replacement of buildings.
Impacts to transportation lifelines affect both short-term (e.g., evacuation activities) and long-term (e.g., day-to-
day commuting and goods transport) transportation needs. Utility infrastructure (power lines, gas lines, electrical
systems) could suffer damage and impacts can result in the loss of power, which can impact business operations
and can impact heating or cooling provision to the population.
HAZUS-MH v4.2 estimates the total economic loss associated with the 100-year and the 500-year MRP
hurricane wind event (direct building losses and business interruption losses). Direct building losses are the
estimated costs to repair or replace the damage caused to the building. This is reported in the “Impact on General
Building Stock” section discussed earlier. Business interruption losses are the losses associated with the inability
to operate a business because of the wind damage sustained during the storm or the temporary living expenses
for those displaced from their home because of the event. HAZUS-MH v4.2 estimates that there are no economic
losses for Chenango County caused by the 100-year MRP hurricane wind event. Refer to Table 5.4.8-11 for a
summary of HAZUS-MH v4.2 estimated economic losses for Chenango County caused by the 100-year and the
500-year MRP hurricane wind events.
Table 5.4.8-11 Estimated Economic Losses for the 100-Year and 500-Year Mean Return Period
Hurricane Wind Events
Mean Return Inventory Relocation Building and Wages
Rental Losses Income Losses
Period (MRP) Loss Loss Content Losses Losses
100-year MRP $0 $0 $0 $0 $0 $0
500-year MRP $0 $0 $2,257,300 $0 $0 $0
Source: HAZUS-MH v4.2
Debris management can be costly and may also impact the local economy. HAZUS-MH estimates the amount
of building and tree debris that may be produced as result of the 100- and 500-year MRP wind events. Because
Chenango County, New York Hazard Mitigation Plan 5.4.8-20
MONTH 2021Section 5.4.6: Risk Assessment – Severe Storms
the estimated debris production does not include flooding, this is likely a conservative estimate and may be
higher if multiple impacts occur. According to the HAZUS-MH Hurricane User Manual, estimates of weight
and volume of eligible tree debris consist of downed trees that would likely be collected and disposed at public
expense. Refer to the User Manual for additional details regarding these estimates. Table 5.4.8-12 summarizes
debris production estimates for the 100- and 500-year MRP wind events.
Table 5.4.8-12 Debris Production for 100- and 500-Year Mean Return Period Hurricane-Related
Winds
Debris Production During a 100-Year and 500-Year MRP Event
Concrete and
Brick and Wood Steel Tree Eligible Tree Volume
(tons) (tons) (tons) (cubic yards)
100- 500- 100- 500-
Jurisdiction Year Year Year Year 100-Year 500-Year 100-Year 500-Year
Afton (T) 0 0 0 0 0 1,142 0 11,426
Afton (V) 0 0 0 0 0 377 0 3,771
Bainbridge (T) 0 0 0 0 0 405 0 4,048
Bainbridge (V) 0 0 0 0 0 211 0 2,109
Columbus (T) 0 0 0 0 0 0 0 0
Coventry (T) 0 1 0 0 0 721 0 7,211
Earlville (V) 0 0 0 0 0 0 0 0
German (T) 0 0 0 0 0 596 0 5,962
Greene (T) 0 8 0 0 0 2,363 0 23,627
Greene (V) 0 1 0 0 0 624 0 6,243
Guilford (T) 0 0 0 0 0 0 0 0
Lincklaen (T) 0 0 0 0 0 698 0 6,983
McDonough (T) 0 0 0 0 0 1,261 0 12,605
New Berlin (T) 0 0 0 0 0 0 0 0
New Berlin (V) 0 0 0 0 0 0 0 0
North Norwich (T) 0 0 0 0 0 0 0 0
Norwich (C) 0 0 0 0 0 0 0 0
Norwich (T) 0 0 0 0 0 0 0 0
Otselic (T) 0 0 0 0 0 1,300 0 13,001
Oxford (T) 0 0 0 0 0 489 0 4,886
Oxford (V) 0 0 0 0 0 503 0 5,031
Pharsalia (T) 0 0 0 0 0 1,023 0 10,229
Pitcher (T) 0 0 0 0 0 1,069 0 10,685
Plymouth (T) 0 0 0 0 0 805 0 8,053
Preston (T) 0 0 0 0 0 669 0 6,688
Sherburne (T) 0 0 0 0 0 0 0 0
Sherburne (V) 0 0 0 0 0 0 0 0
Smithville (T) 0 0 0 0 0 1,076 0 10,755
Smyrna (T) 0 0 0 0 0 632 0 6,316
Smyrna (V) 0 0 0 0 0 0 0 0
Chenango County
0 11 0 0 0 15,963 0 159,630
(Total)
Source: HAZUS-MH v4.2
Impact on the Environment
The impact of severe weather events on the environment varies, but researchers are finding that the long-term
impacts of more severe weather can be destructive to the natural and local environment. National organizations
such as USGS and NOAA have been studying and monitoring the impacts of extreme weather phenomena as it
impacts long term climate change, streamflow, river levels, reservoir elevations, rainfall, floods, landslides,
erosion, etc. (USGS 2020). For example, severe weather that creates longer periods of rainfall can erode natural
Chenango County, New York Hazard Mitigation Plan 5.4.8-21
MONTH 2021Section 5.4.6: Risk Assessment – Severe Storms banks along waterways and degrade soil stability for terrestrial species. Tornadoes can tear apart habitats causing fragmentation across ecosystems. Researchers also believe that a greater number of diseases will spread across ecosystems because of impacts that severe weather and climate change will have on water supplies (NOAA 2013). Overall, as the physical environment becomes more altered, species will begin to contract or migrate in response, which may cause additional stressors to the entire ecosystem within Chenango County. Cascading Impacts on Other Hazards Severe weather events and severe wind events can escalate the impacts of flooding and severe winter weather. Severe weather may carry extreme rainfall that could exacerbate flooding and could increase the intensity of snow and blizzard events. More information about the flooding and severe winter weather hazards of concern can be found in Section 5.4.4 and Section 5.4.9, respectively. Future Changes that May Impact Vulnerability Understanding future changes that effect vulnerability in the County can assist in planning for future development and ensure establishment of appropriate mitigation, planning, and preparedness measures. Changes in the natural environment and built environment and how they interact can also provide insight about ways to plan for the future. Projected Development Any areas of growth could be potentially impacted by the severe storm hazard because the entire County is exposed and vulnerable to the wind hazard associated with severe storms. However, due to increased standards and codes, new development may be less vulnerable to the severe storm hazard compared to the aging building stock in the County. Projected Changes in Population According to the U.S. Census Bureau, the population in Chenango County has decreased by approximately 4.2- percent between 2010 and 2018 (US Census Bureau 2020). Estimated population projections provided by the 2017 Cornell Program on Applied Demographics indicates that the County’s population will continue to decrease into 2040, decreasing the total population to approximately 41,123 persons (Cornell Program on Applied Demographics 2017). The population that remains in the county is vulnerable to severe weather and severe wind events. Refer to Section 4 (County Profile) for additional discussion on population trends. Climate Change As displayed in Figure 5.4.8-10 the entire State of New York is projected to experience an increase in the frequency and severity of extreme storms and rainfall. The northeast region of the United States has experienced a greater increase in extreme precipitation than any other region in the U.S. between 1958 and 2010, the Northeast experienced more than 70% increase in the amount of precipitation falling in rain events (NCA, 2020). Refer to Section 5.4.4 (Flood) for a discussion related to the impact of climate change due to increases in rainfall. An increase in storms will produce more wind events and may increase tornado activity. Additionally, thunderstorms and increase in temperature can relate to the strength of a storm resulting in tornadoes (NOAA, 2020). With an increased likelihood of strong winds and tornado events, all of the County’s assets will experience additional risk for losses as a result of extreme wind events. Changes in Vulnerability Since the 2015 HMP Since the 2015 analysis, population statistics have been updated using the 5-Year 2014-2018 American Community Survey Population Estimates. The general building stock was also updated using RS Means 2019 Chenango County, New York Hazard Mitigation Plan 5.4.8-22 MONTH 2021
Section 5.4.6: Risk Assessment – Severe Storms

building valuations that estimated replacement cost value for each building in the inventory. The 2015 critical
facility inventory dataset was updated and updated parcel data, tax assessments were provided by Chenango
County GIS. The updated building stock inventory was imported into HAZUS-MH v4.2 to complete a hurricane
wind analysis for the 100-year and 500-year MRP hurricane wind event. Overall, this vulnerability assessment
uses a more accurate and updated building inventory which provides more accurate estimated exposure and
potential losses for Chenango County.

Identified Issues
TO BE ADDED

Chenango County, New York Hazard Mitigation Plan                                                      5.4.8-23
MONTH 2021
You can also read