European ECA support to carbon intensive industries - A research paper prepared for FERN
←
→
Page content transcription
If your browser does not render page correctly, please read the page content below
European ECA support to carbon
intensive industries

A research paper prepared for FERN
European ECA support to carbon
intensive industries

A research paper prepared for FERN

FINAL DRAFT: 15 April 2010

Jan Willem van Gelder, Anna van Ojik and Julia Padberg

Profundo
Radarweg 60
1043 NT Amsterdam
The Netherlands
Tel: +31-20-820 83 20
E-mail: profundo@profundo.nl
Website: www.profundo.nl
Contents

Summary ..................................................................................................................... i

Introduction................................................................................................................ 1

Chapter 1               Austria - OeKB ................................................................................. 2
              1.1       General......................................................................................................2
              1.2       Total export credit guarantees ................................................................2
              1.3       Export credit guarantees by region ........................................................2
              1.4       Export credit guarantees by sector ........................................................3
              1.5       Guarantees for carbon intensive sectors ............................................... 3

Chapter 2               Belgium - ONDD .............................................................................. 5
              2.1       General......................................................................................................5
              2.2       Total export credit guarantees ................................................................5
              2.3       Export credit guarantees by region ........................................................5
              2.4       Export credit guarantees by sector ........................................................6
              2.5       Guarantees for carbon intensive sectors ............................................... 6

Chapter 3               Czech Republic - EGAP .................................................................. 8
              3.1       General......................................................................................................8
              3.2       Total export credit guarantees ................................................................8
              3.3       Export credit guarantees by region ........................................................8
              3.4       Export credit guarantees by sector ...................................................... 11
              3.5       Guarantees for carbon intensive sectors ............................................. 12

Chapter 4               Denmark - EKF............................................................................... 14
              4.1       General....................................................................................................14
              4.2       Total export credit guarantees .............................................................. 14
              4.3       Export credit guarantees by region ...................................................... 14
              4.4       Export credit guarantees by sector ...................................................... 15
              4.5       Guarantees for carbon intensive sectors ............................................. 16

Chapter 5               Estonia - KredEx ............................................................................ 18
              5.1       General....................................................................................................18
              5.2       Total export credit guarantees .............................................................. 18
              5.3       Export credit guarantees by region ...................................................... 19
              5.4       Export credit guarantees by sector ...................................................... 19
              5.5       Guarantees for carbon intensive sectors ............................................. 20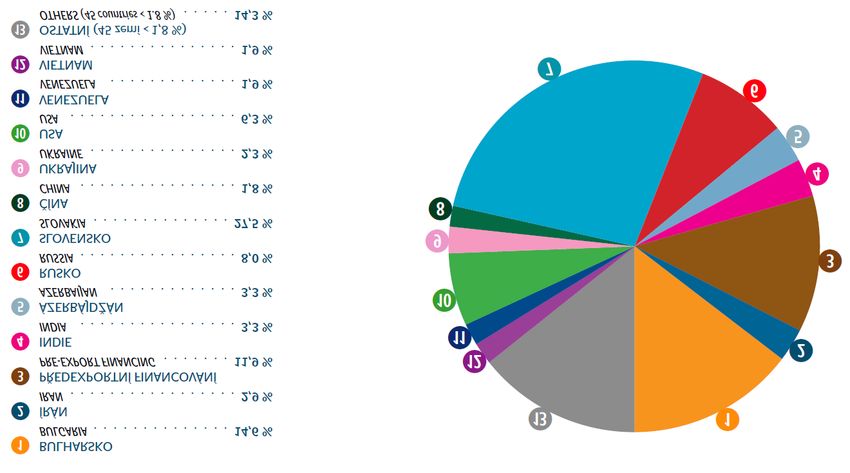
Chapter 6      Finland - Finnvera.......................................................................... 21
        6.1    General....................................................................................................21
        6.2    Total export credit guarantees .............................................................. 21
        6.3    Export credit guarantees by region ...................................................... 21
        6.4    Export credit guarantees by sector ...................................................... 22
        6.5    Guarantees for climate intensive sectors............................................. 22

Chapter 7      France - Coface ............................................................................. 24
        7.1    General....................................................................................................24
        7.2    Guarantees for climate intensive sectors............................................. 24

Chapter 8      Germany - Euler Hermes............................................................... 25
        8.1    General....................................................................................................25
        8.2    Total export credit guarantees .............................................................. 25
        8.3    Export credit guarantees by region ...................................................... 26
        8.4    Export credit guarantees by sector ...................................................... 26
        8.5    Guarantees for climate intensive sectors............................................. 27

Chapter 9      Greece - ECIO ................................................................................ 29
        9.1    General....................................................................................................29

Chapter 10     Hungary - Eximbank and MEHIB .................................................. 30
        10.1   General....................................................................................................30
        10.2   Total export credit guarantees .............................................................. 30
        10.3   Export credit guarantees by region ...................................................... 31
        10.4   Export credit guarantees by sector ...................................................... 31
        10.5   Guarantees for carbon intensive sectors ............................................. 32

Chapter 11     Italy - SACE .................................................................................... 33
        11.1   General....................................................................................................33
        11.2   Total export credit guarantees .............................................................. 33
        11.3   Export credit guarantees by region ...................................................... 33
        11.4   Export credit guarantees by sector ...................................................... 34
        11.5   Guarantees for climate intensive sectors............................................. 34

Chapter 12     Lithuania - LEIDAS ........................................................................ 36
        12.1   General....................................................................................................36

Chapter 13     Luxembourg - Ducroire ................................................................. 37
        13.1   General....................................................................................................37
        13.2   Total export credit guarantees .............................................................. 37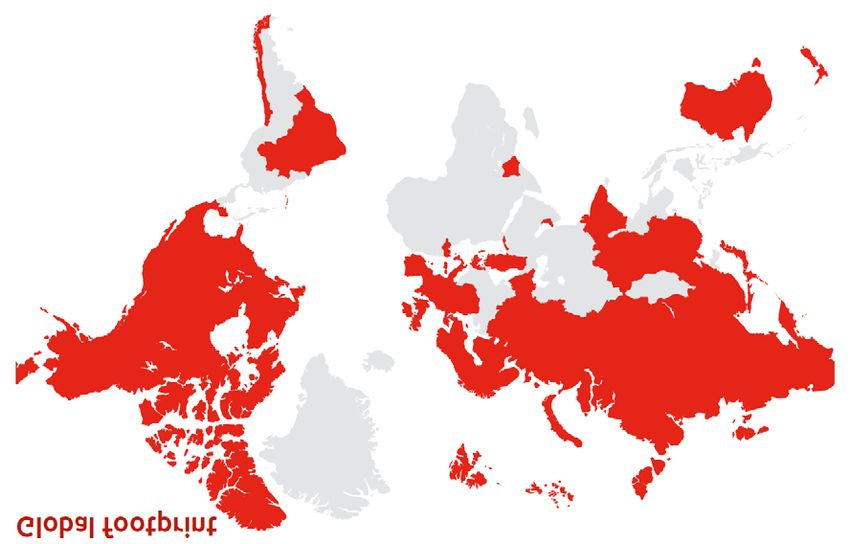
13.3   Export credit guarantees by region ...................................................... 38
        13.4   Export credit guarantees by sector ...................................................... 39
        13.5   Guarantees for carbon intensive sectors ............................................. 39

Chapter 14     Netherlands - Atradius .................................................................. 40
        14.1   General....................................................................................................40
        14.2   Total export credit guarantees .............................................................. 41
        14.3   Export credit guarantees by region ...................................................... 42
        14.4   Export credit guarantees by sector ...................................................... 42
        14.5   Guarantees for climate intensive sectors............................................. 43

Chapter 15     Poland - KUKE ............................................................................... 45
        15.1   General....................................................................................................45
        15.2   Total export credit guarantees .............................................................. 45
        15.3   Export credit guarantees by region ...................................................... 46
        15.4   Export credit guarantees by sector ...................................................... 47
        15.5   Guarantees for carbon intensive sectors ............................................. 48

Chapter 16     Portugal - COSEC .......................................................................... 49
        16.1   General....................................................................................................49
        16.2   Total export credit guarantees .............................................................. 49
        16.3   Export credit guarantees by region ...................................................... 49
        16.4   Export credit guarantees by sector ...................................................... 50
        16.5   Guarantees for carbon intensive sectors ............................................. 50

Chapter 17     Slovak Republic - Eximbanka....................................................... 51
        17.1   General....................................................................................................51
        17.2   Total export credit guarantees .............................................................. 51
        17.3   Export credit guarantees by region ...................................................... 51
        17.4   Export credit guarantees by sector ...................................................... 52
        17.5   Guarantees for carbon intensive sectors ............................................. 53

Chapter 18     Slovenia - SID ................................................................................ 54
        18.1   General....................................................................................................54

Chapter 19     Spain - CESCE ............................................................................... 55
        19.1   General....................................................................................................55
        19.2   Guarantees for climate intensive sectors............................................. 55

Chapter 20     Sweden - EKN ................................................................................ 56
        20.1   General....................................................................................................56
        20.2   Total export credit guarantees .............................................................. 56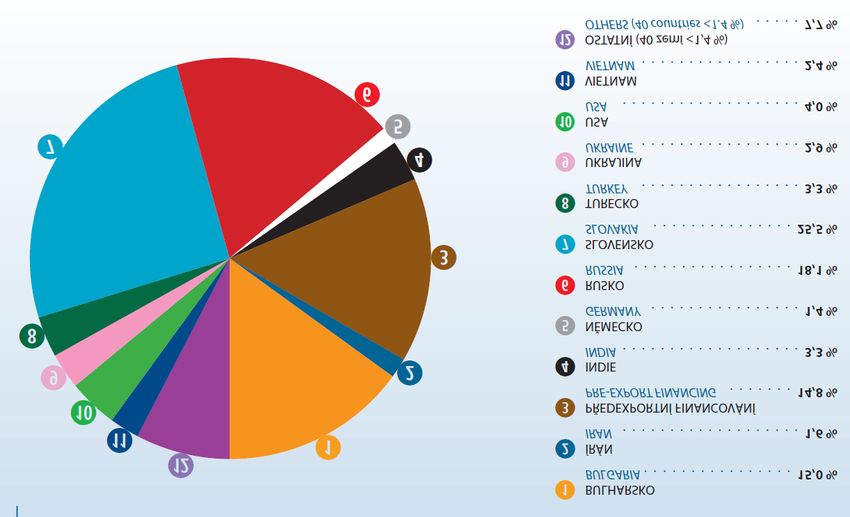
20.3   Export credit guarantees by region ...................................................... 56
        20.4   Export credit guarantees by sector ...................................................... 57
        20.5   Guarantees for carbon intensive sectors ............................................. 57

Chapter 21     United Kingdom - ECGD ............................................................... 59
        21.1   General....................................................................................................59
        21.2   Total export credit guarantees .............................................................. 59
        21.3   Export credit guarantees by region ...................................................... 60
        21.4   Export credit guarantees by sector ...................................................... 61
        21.5   Guarantees for climate intensive sectors............................................. 62

Appendix 1     References ..................................................................................... 65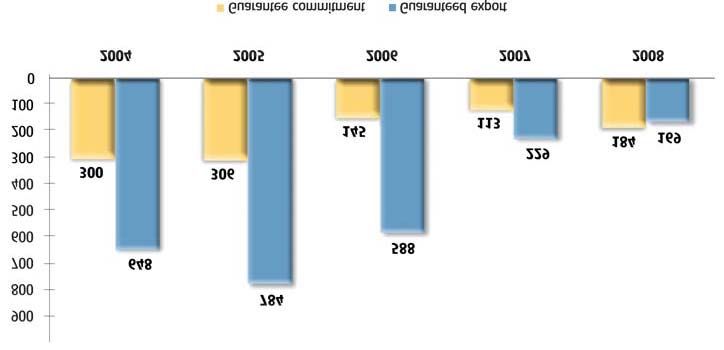
Summary
This report summarizes research findings on the involvement of European Export Credit
Agencies (ECA’s) in financing carbon intensive industries. It concentrates on all 21 ECA’s in
EU-member countries and on guarantees provided in the past six years (2004-2009). For
each European ECA an overview is provided of the export credit guarantees granted during
the studied period, split by sector and by region.
Subsequently, based on detailed information on individual guarantees as provided by some
of the ECAs, an analysis was made of the extent to which each ECA financially supported
companies active in eleven carbon-intensive activities or industries, as defined by FERN:

   •   Fossil-fuel electricity plants;
   •   Oil and gas extraction;
   •   Shipping;
   •   Mining;
   •   Dredging;
   •   Iron and steel manufacturing;
   •   Pulp and paper manufacturing;
   •   Chemical industry;
   •   Transportation infrastructure;
   •   Aircraft manufacturing;
   •   Airlines.

Table 1 summarizes our research findings, indicating the total value of export credit
guarantees issued by each ECA in the period 2004-2009 and the percentage of these
guarantees issued to companies in carbon intensive sectors.

       Table 1       European ECA’s: Total and carbon intensive export credit guarantees
                     2004-2009
                      Total            Carbon intensive
Export credit                                           Carbon intensive
                      guarantees       guarantees                              Comments
agency                                                  guarantees (%)
                      (mln €)          (mln €)
                                                                               Based on number of
Austria - OeKB            57,615.0            > 2,586.8               70.5
                                                                               reported projects
                                                                               Based on value of
Belgium - ONDD           115,168.9            > 1,640.0          1.8 - 87.4
                                                                               reported projects
Czech Republic -                                                               Based on value of two
                           7,775.9              > 225.4                    -
EGAP                                                                           reported projects
                                                                            Based on number of
Denmark - EKF             11,858.4                       -      13.5 - 18.7 (reported) projects in
                                                                            2006-08
Estonia - KredEx             176.0                       -                 - -
                                                                               Based on value of
Finland - Finnvera         9,505.7              3,022.6         32.0 - 71.5
                                                                               reported projects
                                                                               Based on value of
France - Coface                    -           17,166.0               48.2
                                                                               reported projects
Germany - Euler                                                                Based on value of
                         118,856.0             32,162.5               27.1
Hermes                                                                         reported projects
Greece - ECIO              1,470.0                       -                 - -

                                                   -i-
Total            Carbon intensive
Export credit                                          Carbon intensive
                     guarantees       guarantees                              Comments
agency                                                 guarantees (%)
                     (mln €)          (mln €)
Hungary -
Eximbank and              1,486.7                       -                 - -
MEHIB
                                                                              Based on value of
Italy - SACE             89,913.0              9,835.6         10.9 - 89.3
                                                                              reported projects
Lithuania - LEIDAS                -                     -                 - -
Luxembourg –                                                                  Based on 2007 and
                        > 2,000.0                       -                 -
Ducroire                                                                      2008
Netherlands -                                                                 Based on value of
                         16,154.0              7,700.0         48.0 - 81.0
Atradius                                                                      reported projects
                                                                              Based on 2004-07 and
Poland - KUKE           > 3,800.0                       -      49.9 - 67.8
                                                                              number of projects
                                                                              Based on 2007 and
Portugal - COSEC          > 291.1                       -                 -
                                                                              2008
Slovak Republic -                                                             Based on alternative
                            827.9                       -          > 12.2
Eximbanka                                                                     sector division
Slovenia - SID                    -                     -                 - -
                                                                              Based on number of
Spain - CESCE                     -                     -            44.4
                                                                              reported projects
                                                                              Based on alternative
Sweden - EKN             18,191.5                                  > 34.3
                                                                              sector division
United Kingdom -                                                              Based on value of
                         13,261.0              8,095.2         61.0 - 94.5
ECGD                                                                          reported projects
Total                 > 468,351.1           > 82,434.1

As shown in Table 1, seventeen European ECA’s provided export credit guarantees with a
total volume of € 468.4 billion in the period 2004-2009 (for four ECAs no figures were found).
For nine ECAs we were able to find or estimate figures on their export credit guarantees for
companies in carbon intensive sectors, totalling € 82.4 billion. As we could not make
estimates of their carbon intensive guarantees for twelve ECAs, the total amount probably
will be much higher, resulting in a significant percentage of all export credit guarantees
granted by European ECAs. For individual ECAs, this percentage varied between 12 and
95%.

This research project was hampered by the fact that most of the European ECA’s are not
very transparent in providing information about the total volume of export credit guarantees
over the past six years, and especially about specific projects guaranteed during these years.
Below, an overview is given of the amount of information provided by the different ECA’s
studied in this report, ranked from elaborate to no information.

   • None of the ECA’s provided details on all export credit guarantee transactions made
     during any particular year.

                                                 -ii-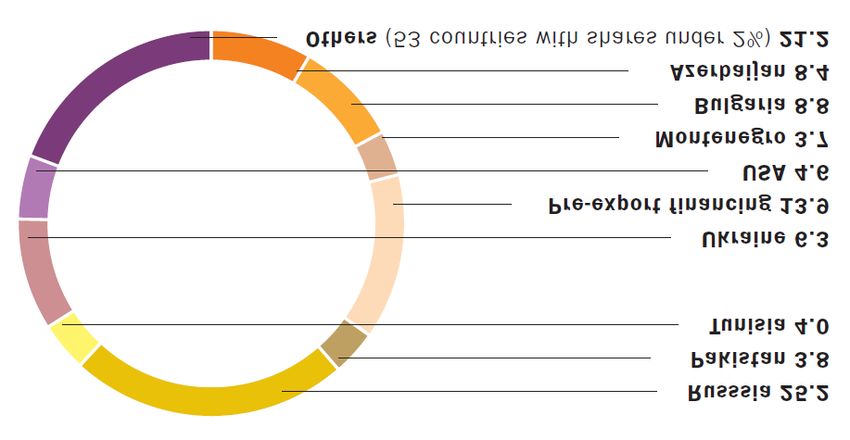
• Coface (France) publishes detailed information on guarantees provided to projects
  above € 10 million and projects that fall in environmental category A or B. Finnvera
  (Finland) reports information about export guarantees provided to projects above € 10
  million and projects that fall in environmental category A. Euler Hermes (Germany)
  provides information of all the official projects supported above € 15 million and
  selected projects of special public interest below this threshold. Atradius (Netherlands)
  and EGCD (United Kingdom) disclosed detailed information on all guarantees provided
  for projects which are not commercially confidential, including all environmental
  category A and B projects.

• SACE (Italy) only discloses elaborate transaction details for guarantees issued for
  projects within the environmental category A and B. ONDD (Belgium) published all the
  environmental category A and B insurance policies for 2007-09, with only a range of
  the guarantee values. OeKB (Austria) reported all the credit guarantees it issued to
  environmental category A and B export projects during the years 2006-09. It only
  disclosed the guarantee amount for some of these transactions.

• EGAP (Czech Republic) provided very limited information on the category A and B
  projects it issued guarantees to. Only two of these projects included the guarantee
  amount.

• EKF (Denmark), KUKE (Poland), and CESCE (Spain) reported the number of
  environmental category A and B export projects it helped financing during a limited
  amount of years, without providing details or guarantee amounts.

• Eximbanka (Slovak Republic) and EKN (Sweden) did not provide project specific information,
   but provided a relatively accurate sector division of the guarantees it provided during 2004-09.

• KredEx (Estonia), ECIO (Greece), Eximbank and MEHIB (Hungary), LEIDAS
  (Lithuania), COSEC (Portugal) and SID (Slovenia) did not provide any information that
  could be used to estimate the share of their guarantee volume dedicated to climate
  intensive projects.

                                               -iii-
Introduction
This report includes the results of our research into the involvement of European Export
Credit Agencies (ECA’s) in financing carbon intensive industries. The project concentrates on
all ECA’s in EU-member countries and on financing provided in the past six years (2004-
2009).

As far as possible per European ECA an overview is givenof the short- and long-term export
credit guarantees provided in the past six years (2004-2009), split by sector and by region
(Europe, developing countries and other).

To estimate the involvement in carbon intensive industries, an overview is made of the short-
and long-term export credit guarantees provided by ECAs from EU-countries in the past six
years (2004-2009) to companies active in the following carbon-intensive activities or
industries:

   •   fossil-fuel electricity plants;
   •   oil and gas extraction;
   •   shipping;
   •   mining;
   •   dredging;
   •   iron and steel manufacturing;
   •   pulp and paper manufacturing;
   •   chemical industry;
   •   transportation infrastructure;
   •   aircraft manufacturing;
   •   airlines.

In a separate spreadsheet, all export credit guarantees found are summarized per ECA,
indicating the date, recipient, activity, country, term and amount.
Taking all guarantees together the percentage of all export credits guarantees provided to
carbon-intensive industries during the past six years is calculated and included in this report.
Each European ECA is described in a separate chapter. Sources are mentioned on all data
included.

A summary of the findings of this report can be found on the first pages of this report.

                                               -1-
Chapter 1 Austria - OeKB
1.1 General
The “Oesterreichische Kontrollbank Aktiengesellschaft AG” (OeKB) is Austria's central
financial and information services agency for the export sector and capital market. Its specific
services in Austria evolve around strengthening the national economy within the global
competition. The institution was founded in 1946, and is owned by Austrian banks.
1.2 Total export credit guarantees
Table 2 shows the total amounts for which OeKB claims to have provided export credit
insurances. The amount for 2009 was estimated by using the average increment over
previous years. The sum of the amounts for the years 2006-09 is included for comparison
purposes later on in this chapter, where transaction details of the years 2004 and 2005 are
not available.
Table 2 OeKB: Export credit guarantees 2004-2009
Year Value of guarantees (mln €) Increment per year (mln €)
2004 5,191
2005 5,505 + 0,314
2006 8,714 + 3,209
2007 12,361 + 3,602
2008 12,063 - 0,253
2009* 13,781 + 1,718
Total 57,615
Total 2006-09 46,919
* The amount for 2009 was estimated on the basis of average increment over the
remaining years
Source: OeKB, Annual Report 2008, OeKB, June 2009.
As can be deduced from Table 2 the amount for which guarantees were granted per year
more than doubled during the five-year period.
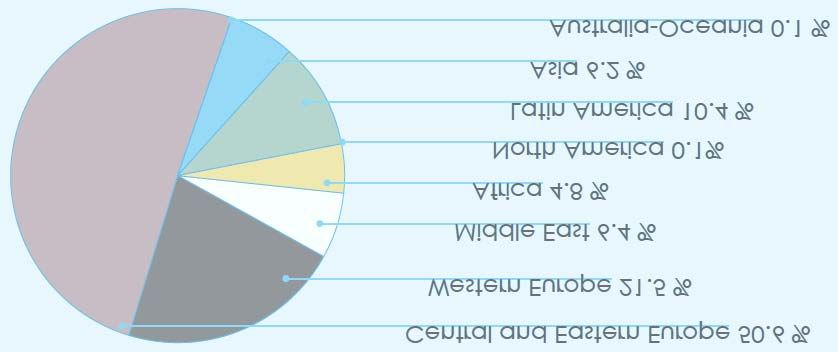
1.3 Export credit guarantees by region
Table 3 shows how the guarantees issued by OeKB are spread by region. The category
“Other guarantees” include “Guarantees by Aval (GA)” and “OeEB”, or the Oesterreichische
Entwicklungsbank AG, which is the official Development Bank of Austria and a full subsidiary
of OeKB. 1
-2-Table 3 OeKB: Export guarantees by region 2004-2008 (mln €)
Percentage
Region 2004 2005 2006 2007 2008 Total
of total (%)
Europe (including Turkey / CIS) 772 1,735 1,540 4,337 3,023 11,407 26.0
EU 329 70 250 232 1,437 2,318 5.3
North America 18 1 7 1 2 29 0.1
Latin America 37 44 62 71 145 359 0.8
Asia 797 1,215 1,139 973 1,205 5,329 12.2
Australia, Oceania — — — — 9 9 0.0
Africa 33 46 78 70 151 378 0.9
Comprehensive policies 942 35 145 40 182 1,344 3.1
Other guarantees 2,263 2,359 5,493 6,592 5,909 22,616 52.0
Total 5,191 5,505 8,714 12,316 12,063 43,789 100.0
Source: OeKB, Annual Reports 2005, 2007 and 2008, OeKB, May 2006, 2007 and 2008.
1.4 Export credit guarantees by sector
No division of export credit guarantees by sector was found.
1.5 Guarantees for carbon intensive sectors
In the years 2006-09 OeKB reported all the credit guarantees it issued to environmentally
sensitive export products. Over this period, it provided details on 95 projects, of which 67
(70.5%) were carbon sensitive.
For most of the projects it also specified the cost of the exported product, which would give
an indication of the amount for which OeKB provided insurance. As can be seen in Table 4,
46 of the projects had specified amounts, and the remaining 49 projects had barely or no
specified amounts.
The projects for which only a range was specified were not included in the total amounts
shown in Table 4, since the range was usually so wide that estimating them does not seem
sensible. For example, in April 2007 the Austrian firm Andritz provided a sheet drying line for
elemental bleached pulp that was “part of a larger 300 million project”, and in May 2007 the
Austrian Voith Paper exported four complete paper machines to China with an estimated
value within the “three digit million range”.
Excluding these amounts for carbon intensive projects from the calculations might seem to
underestimate the total share of this group of projects. However, we assume that generally
the value of an export product is more likely to be mentioned when it is relatively high.
Therefore, we might just as well be overestimating the relative share of guarantees to carbon
intensive projects with the total amounts shown in Table 4. Because of the large insecurity in
the data for OeKB, we could not provide a range for the share of carbon intensive projects in
this country.
-3-Table 4 OeKB: Carbon intensive export credit guarantees in 2006-09
2006 2007 2008 2009 Total
Total number of projects
21 26 27 21 95
Total specified amounts (mln €)
1,439.8 848.6 838.5 865.2 3,992.1
Number of carbon intensive projects
13 17 8 8 46
with specified amounts
Specified amounts for carbon
1,075.0 533.6 394.0 584.2 2,586.8
intensive projects (mln €)
Number of carbon intensive projects
1 4 10 6 21
with unspecified amounts
Source: OeKB, “Bundesgarantierte Projekte ab 10 Mio. Euro“, Transparenz &
Compliance, Website OeKB, Viewed in April 2010.
-4-Chapter 2 Belgium - ONDD
2.1 General
The National Delcredere Service (ONDD) is the Belgian public export credit agency. ONDD
performs this function as an autonomous public institution that receives financial guarantees
from the Belgian state. 2
2.2 Total export credit guarantees
Table 5 shows that the amount for which ONDD issued export credit guarantees almost
quadrupled between 2004 and 2009. The total (estimated) amount for which ONDD issued
guarantees in these five years is € 115.2 billion.
Table 5 ONDD: Export credit guarantees 2004-2009
Value of Increment per
Year guarantees year (mln €)
(mln €)
2004 8,922.3
2005 12,317.2 3,394.9
2006 14,671.0 2,353.8
2007 19,866.0 5,195.0
2008 27,388.0 7,522.0
2009* 32,004.4 4,616.4
Total 115,168.9
* The amount for 2009 was estimated on the basis of average increment over the
remaining years
Source: ONDD, Annual Report 2008, ONDD, June 2009.
2.3 Export credit guarantees by region
Table 6 shows how the earned premiums in 2004-08 were distributed over different
countries. The premium amounts relate to the guarantee amounts from Table 5 in a more or
less proportional manner. As can be observed from the table, Russia was the largest export
country in each year. Other countries that were amongst the largest in 2008 (such as Dubai
and Ghana) were not amongst the thirty largest ones in previous years, and were therefore
left out of the table.
-5-Table 6 ONDD: Earned premiums by country 2004-2008 (thousand €)
Country 2004 2005 2006 2007 2008
Russia 7,547 14,161 13,212 14,880 24,355
Turkey 5,333 7,087 7,516 6,443 9,250
Iran 8,905 4,438 12,253 24,532 8,409
Brazil 3,136 2,313 4,953 8,007 7,723
Ukraine 1,319 1,558 2,746 3,492 7,432
India 1,402 1,084 1,678 3,131 6,616
Nigeria 695 1,553 2,706 2,616 5,117
Kazakhstan 696 917 1,576 1,508 4,655
China 2,203 2,121 2,447 2,885 4,549
Saudi-Arabia 1,708 1,808 3,510 8,104 3,801
Other 64,858 60,579 112,558 90,182 124,601
Total 97,802 97,619 165,155 165,780 206,508
Source: ONDD, “Annual reports 2005-08”, ONDD, June 2006-09.
2.4 Export credit guarantees by sector
No division of export credit guarantees or premiums by sector was found.
2.5 Guarantees for carbon intensive sectors
On its website, ONDD presents one list with all the environmental category A and B
insurance policies that were issued since 2007. Guarantees issued before 2007 are not
included in the list.
Since the exact values of the issued credit guarantees were not reported - only five broad
categories - estimations had to be made in order to be able to perform computations with
these data. For most categories we simply took the average, as shown in Table 7. For
category 5 (above € 100 million), the average increment of the other categories was used to
compute the logical average of this fifth category. This procedure is also shown in Table 7.
Table 7 ONDD: Categories of guarantee values
Category Range (mln €) Average (mln €) Increment (mln €) Change (mln €)
1 >10 5
2 10-30 20 15
3 30-70 50 30 15
4 70-100 85 35 5
5* 100< 130 45 10
* Average amount is estimated based on the average change in increment.
Source: ECGD, “Annual Reports 2004-05 – 2008-09”, ECGD, September 2005-09
-6-For the years 2007-09, 33 projects were reported, meaning that these were the only
transactions belonging to the environmental categories A and B during this period. From the
33 environmentally sensitive projects, 30 were also carbon intensive.
When analysing the amounts (using the average amounts of Table 7), the value of all
reported transactions amounted to € 1,670 million. From this total amount, € 1,640 million
(87.4%) was devoted to carbon intensive projects. Since it is likely that relatively many of the
environmentally sensitive projects can also be classified as carbon intensive, this percentage
is probably an overestimation of the actual ratio of carbon sensitive to other guarantees.
ONDD published to have issued insurances covering € 79,258.4 million in the years 2007-09,
meaning that the carbon sensitive insurances we found would constitute only 1.8% of all
insurances. It is likely however, that this is an underestimation, since the large amount of not
reported guarantees is likely to contain other carbon intensive transactions.
Table 8 shows how the issued guarantee amounts, and the relative shares of the reported
and overall issued insurances are allocated over the sectors identified by FERN.
Table 8 ONDD: Carbon intensive export credit guarantees 2007-2009
Percentage of Percentage of
Sector Amount (mln €)
total reported (%) total covered (%)
Fossil-fuel electricity plant 0 0 0
Oil & gas extraction 130.0 7.8 0.2
Shipping 0 0 0
Mining 0 0 0
Dredging 1,060.0 63.5 1.3
Iron & steel 270.0 16.2 0.3
Pulp & paper 0 0 0
Chemical industry 0 0 0
Transportation infrastructure 0 0 0
Aircrafts manufacturing 0 0 0
Airlines 0 0 0
Total 1,640.0 87.4 1.8
Source: ONDD, “ETHIEK”, “Wie zijn wij?”, Website ONDD, Viewed in April 2010.
As the two computed percentages are expected to over- and underestimate the real share of
carbon sensitive export credit guarantees issued by ONDD, we conclude that the actual
percentage will lie within the range of 1.8 and 87.4 percent.
-7-Chapter 3 Czech Republic - EGAP
3.1 General
The Export Guarantee and Insurance Corporation (EGAP) of the Czech Republic was
founded in June 1992 as a state-owned export credit agency, insuring credits connected with
exports of goods and services from the Czech Republic against political and commercial
risks. EGAP, now part of the state export support programme, provides insurance services to
all exporters of Czech goods, and is still fully owned and financially guaranteed by the Czech
state. 3
3.2 Total export credit guarantees
Table 9 shows that the amount for which EGAP issued export credit guarantees more than
tripled between 2004 and 2009. The total (estimated) amount for which EGAP issued
guarantees in these five years is € 7.8 billion.
Table 9 EGAP: Export credit guarantees 2004-2009
Value of Change per year
Year guarantees (mln €)
(mln €)
2004 557.3
2005 765.6 + 208.3
2006 1,085.9 + 320.3
2007 1,874.9 + 789.0
2008 1,614.0 - 260.9
2009* 1,878.2 + 264.2
Total 7,775.9
* The amount for 2009 was estimated on the basis of average annual change over the
previous years
Source: EGAP, “EGAP in numbers”, Website EGAP, Viewed in April 2010.
3.3 Export credit guarantees by region
During 2004, credits were insured to 51 countries, although 92% was directed to eleven
countries. Slovakia was the largest export country with 25.5% of the EGAP credits
insurances. An overview of the country division for 2004 is given in Figure 1.
-8-Figure 1. EGAP: Country allocation of guarantees in 2004 (%)
Source: EGAP, “Annual report 2004”, EGAP, June 2005.
During 2005, the largest share from the state supported insurance (27.5 %) fell on Slovakia
with credits for the export of agricultural equipment, production lines, travelling cranes, and a
number of other machinery products and coal. The volume of the insurance value realized
with Bulgaria (14.6 %) was also significant and consisted primarily of the insurance of the
investment into a cascade of hydro power plants and of the insurance of the export of Škoda
cars. The insurance of the export to Russia (8 %) supported predominantly export of the
equipment for glass industry, agricultural technology, machinery products, industrial
hosepipes, chipboards, mining technology, machine tools, trucks and technology for sugar-
making industry.
-9-Figure 2. EGAP: Country allocation of guarantees in 2005 (%)
Source: EGAP, “Annual report 2005”, EGAP, June 2006.
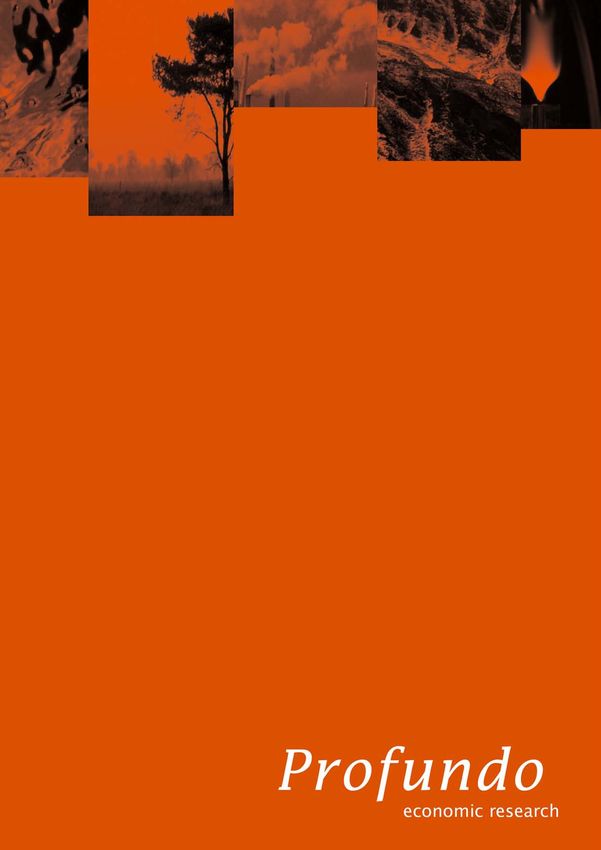
As a whole, EGAP insured export contracts to 62 countries in 2006. During the year, EGAP
was insuring Czech exports mainly to the Russian Federation, which reached approximately
CZK 7.5 billion (€ 272.4 million) and thus represented a quarter of the total insured volume. A
further amount of CZK 4.7 billion (€ 170.7 million) was devoted to other CIS countries.
Figure 3. EGAP; Country allocation of guarantees in 2006 (%)
Source: EGAP, “Annual report 2006”, EGAP, June 2007.
-10-In 2007, EGAP insured export contracts to 59 countries. In comparison with 2006, nine new
countries emerged in the list and three of them, Angola, Georgia and New Zealand,
appeared for the first time ever. Czech exports with EGAP insurance were directed most
often to the Russian Federation; they had an overall value of CZK 20 billion (€ 750.0 million)
and represented more than two-fifths of the overall insured volume in 2007. The second
place was taken by Georgia, where the company Energo Pro privatised, with the assistance
of an insured credit for financing investments, a range of hydroelectric power stations and
electricity distribution networks.
Figure 4. EGAP; Country allocation of guarantees in 2007 (%)
Source: EGAP, “Annual report 2007”, EGAP, June 2008.
In 2008, EGAP insured exports of Czech goods, services and investments to 56 countries all
over the world, of which 48% went to the Russian Federation and 13% to other CIS
countries. The insurance of deliveries of technology and construction of the steam-gas power
station in Kurgan with the insurance value of almost CZK 6.4 billion (€ 242.2 million) was
among the largest projects in the Russian Federation.
Figure 5. EGAP – country allocation of guarantees in 2008 (%)
Source: EGAP, “Annual report 2008”, EGAP, June 2009.
3.4 Export credit guarantees by sector
No division of export credit guarantees or premiums by sector was found, but a general
description was available for each year:
-11-• During 2004, the commodity segment “Machinery and transport equipment” was
predominant in the sectoral division of new state supported insurances of credits and
investment; its share made 60.5%. Two thirds of the total volume of this segment were
insured credits for deliveries of machinery and technological equipment, and
approximately one quarter were the insured credits for the deliveries of power-producing
equipment; the rest were deliveries of transport equipment. In 2004, among other
commodities, the export credit insurances covered credits and guarantees relating coal
(20.1% of the total volume) and further there were footwear, textiles, hides, metal
castings, etc.
• In 2005, the group “Machinery and transport equipment” continued to predominate in the
commodity structure of newly insured credits and investment with state support; its share
was 60.8%. More than half of the total volume of this group were insured credits for
deliveries of power-producing equipment, approximately one quarter were insured credits
for the delivery of means of transport and the rest were deliveries of machinery and
technological equipment. Among other commodities in 2005 were credits and guarantees
related to export support and production for the export for deliveries of coal (26.6% of the
total volume), and, furthermore there were footwear, textiles, wood and rubber products,
metal castings and others (together 4 %).
• Regarding the commodity structure of newly insured credits and investments with state
support in 2006, the segment “Machinery and transport equipment” had a share of 77% of
the total volume. Deliveries of machinery and technology equipment made out 56.5% of
this group, 17.4% was transport equipment and the remainder were deliveries of power-
generating equipment. Compared to 2005, the share of the deliveries of machines and
equipment increased, while the share of power-generating equipment declined in 2006.
Among other commodity classes, the most frequent ones were insurances of credits and
guarantees related to deliveries of footwear, textiles, wood and rubber products, metal
castings and scientific instruments.
• In 2007, similarly to previous years, the “Machinery and transport equipment” category
predominated in the commodity structure with a share of 85.6%.Deliveries of machinery
and equipment were 50% within this class, 40% were deliveries of power equipment and
the remainder was insurance of deliveries of means of transport. In comparison with 2006,
the share of the power equipment increased significantly, while the share of the means of
transport decreased moderately. In other commodity classes, the most frequently insured
industries were footwear, textiles, products from wood and rubber, of metal castings and
scientific instruments.
• Once again, “Machinery and transport equipment” was the dominant export credit
insurance category in 2008, with a share of 87.2%. Almost half of this segment consisted
of the deliveries of machinery and technological equipment, over 25% were deliveries of
power equipment and the rest were deliveries of means of transport. Compared to 2007,
the structure within this dominant category remained more or less identical. Amongst
other commodity groups, the insured credits and guarantees mainly related to the
deliveries of various wood and rubber products, metal castings, technologies and
construction activities, medications, pharmaceutical products and scientific instruments.
3.5 Guarantees for carbon intensive sectors
EGAP did not publish sufficient information for computing the share of carbon intensive
projects. It did provide several examples of export credits it insured for carbon intensive
projects during 2009:
-12-• In June 2009 EGAP insured a credit of € 108.2 million for the construction of one unit of
continuous casting and a vacuum furnace for the Magnitogorsk Metallurgical Ironworks in
Russia.
• In July 2009 it insured a credit of € 117.1 million for some mini-steelworks in Strážské ,
Slovakia.
• Furthermore, it guaranteed the financing of the Yunusemre coal-fired power plant in
Turkey, the reconstruction of an atmospheric distillation unit for crude oil in Belarus, and
the construction of a highway in Vietnam.
-13-Chapter 4 Denmark - EKF
4.1 General
Eksport Kredit Fonden (EKF) is the Danish national export credit agency. It is the only
organisation in the Danish market to offer insurance against the extraordinary risks that are
not covered by the private credit insurance market. 4
4.2 Total export credit guarantees
Table 10 shows how the total annual amount for which EKF issued export credit guarantees
changed over the past five years. As can be observed, this amount is estimated to have
more than doubled during this period. In total, the agency insured export credits with a value
of € 11.9 billion during the period of 2004-09.
Table 10 EKF: Export credit guarantees 2004-09
Value of Change per year
Year guarantees (mln €)
(mln €)
2004 1,142.2
2005 1,554.8 + 412.6
2006 2,158.8 + 604.0
2007 2,306.0 + 147.2
2008 2,214.3 - 91.7
2009* 2,482.3 + 268.0
Total 11,858.4
* The amount for 2009 was estimated on the basis of average annual change over the
previous years
Source: EKF, “Annual reports 2005-08”, EKF, April 2006-09.
4.3 Export credit guarantees by region
Table 11 provides an overview of the relative shares of the different regions in the world in
EKF’s insurance portfolio. Throughout the past five years Danish export projects to the Asia /
Pacific region received most of EKF’s financing, except in the year 2007, when Western
European projects received slightly more. Export credits for Africa generally received the
lowest amount of guarantees by EKF.
-14-Table 11 EKF: Geographical allocation of guarantees in 2004-08 (%)
Region 2004 2005 2006 2007 2008
Asia / Pacific 35.0 41.0 38.0 25.0 25.0
Western Europe 22.0 20.0 20.0 26.0 23.0
Eastern Europe 9.0 6.0 8.0 18.0 16.0
Middle East (including Turkey) 13.0 14.0 13.0 14.0 16.0
Americas 14.0 10.0 12.0 11.0 13.0
Africa 7.0 9.0 9.0 6.0 6.0
Total 100.0 100.0 100.0 100.0 100.0
Source: EKF, “Annual reports 2004-08”, EKF, April 2005-09.
Figure 6 shows the countries of which the above regions were composed in 2008. For
example, within the region “Americas” EKF only insured export projects directed to Mexico.
Figure 6. Export countries for which EKF issued guarantees in 2008
Source: EKF, “CSR report 2008”, EKF, April 2009.
4.4 Export credit guarantees by sector
Table 12 shows how the export credit guarantees issued by EKF were divided over several
economic sectors. In 2006 no differentiation was made between “chemistry and metal
working” and “process industry”. For 2004, 2005 and 2009 no data were available at all.
-15-Table 12 EKF: Sectoral allocation of guarantees in 2006-2008 (%)
Industry 2006 2007 2008
Cement industry 22.0 34.0 36.0
Water and waste 11.0 2.0 2.0
Infrastructure 17.0 14.0 15.0
CHP and energy 4.0 2.0 1.0
Wind energy 30.0 34.0 32.0
Agriculture and food 11.0 11.0 8.0
Chemistry and metal working 6.0 1.0 1.0
Process industry * 2.0 5.0
Total 100.0 100.0 100.0
* No distinction was made between “chemistry and metal working” and “process
industry”
Source: EKF, “Annual reports 2004-08”, EKF, April 2005-09.
4.5 Guarantees for carbon intensive sectors
EKF did not publish sufficient information to calculate the share of carbon intensive projects.
However, from the sector division in Table 12 can be deduced that the guarantee exposure
of the carbon intensive category “Transportation infrastructure” constituted 17%, 14% and
15% of all export credit guarantees granted in 2006, 2007 and 2008 respectively. The
relative share of the “Chemistry and metal working” industry was 1% of all guarantees in both
2007 and 2008. Furthermore, the carbon sensitive category “Fossil-fuel electricity plants”
received 4%, 2% and 1% of all guarantees respectively in 2006, 2007 and 2008. This would
indicate that the carbon intensive export projects constituted on average 18.7 percent of all
guarantees granted during the period 2006-08.
Another, less accurate, indication of the share of carbon intensive projects as defined by
FERN, was made by looking at the 74 projects with potential environmental impact included
in the audit of EKF’s 2008 CSR report. Of these 74 projects that received an export credit
guarantee from EKF, 10 could be categorized as carbon intensive. This indicates a relative
share of 13.5%.
-16-Table 13 EKF: Export credit guarantees for carbon intensive sectors 2004-2009
Percentage of
Sector Frequency
total reported (%)
Fossil-fuel electricity plant 2 2.7
Oil & gas extraction 1 1.4
Shipping 1 1.4
Mining 0 0.0
Dredging 0 0.0
Iron & steel 0 0.0
Pulp & paper 0 0.0
Chemical industry 0 0.0
Transportation infrastructure 6 8.1
Aircrafts manufacturing 0 0.0
Airlines 0 0.0
Total 10 13.5
Source: EKF, “CSR report 2008”, EKF, April 2009.
-17-Chapter 5 Estonia - KredEx
5.1 General
The Credit and Export Guarantee Fund KredEx was founded in 2001 by the Ministry of
Economic Affairs and Communications of Estonia
5.2 Total export credit guarantees
Figure 7 shows the amounts (in Estonian Kroons) for which KredEx provided export credit
guarantees in each year. The guaranteed export amounts from the figure are converted into
euro’s in Table 14 below, and the number of guarantees per year is added as well. The total
guarantee amount for 2009 was not included in Figure 7 since it has not yet been included in
an annual report. It is unclear what the “Guarantee commitments” in Figure 7 imply.
Figure 7. KredEx: Export credit guarantees 2004-08 (mln EEK)
Source: KredEx, “Annual report 2008”, KredEx, April 2009.
Table 14 shows that the value for which KredEx issued export credit guarantees in each year
reached its peak in 2005 with € 50.1 million, then rapidly declined to € 10.9 million in 2008,
and has since almost doubled again to € 21.4 million. The number of guarantees has
consistently been declining since 2004, with only a small increase in 2009. This would
indicate that the average amount per guarantee is rising over the years.
-18-Table 14 KredEx: Export credit guarantees 2004-09
Value of Number of
Year guarantees guarantees
(mln €) issued
2004 41.4 418
2005 50.1 395
2006 37.6 203
2007 14.6 104
2008 10.9 78
2009 21.4 98
Total 176.0 1,296
Source: KredEx, “Annual reports 2004-08”, KredEx, April 2005-09; KredEx, “Interest of
entrepreneurs in the export guarantees of KredEx is continually increasing”, KredEx, 4
March 2010.
5.3 Export credit guarantees by region
Table 15 gives a division by country of the total volume of guarantee contracts concluded in
each year. Since different countries were pointed out in each year, the category “Other” is
rather large in years where many of the export credit guarantees were issued for export
destinations that were uncommon in other years. For example, in 2007 many of Estonia’s
exports were directed to Lithuania, Serbia, Latvia and Japan. 5
Table 15 KredEx: Geographical allocation of guarantees in 2005-09 (%)
Country 2005 2006 2007 2008 2009
Ukraine 0.0 0.0 10.0 88.0 68.0
Russia 6.0 15.0 0.0 3.0 9.0
Sweden 11.0 6.0 8.0 1.0 0.0
United States 0.0 15.0 14.0 0.0 0.0
United Kingdom 13.0 9.0 11.0 0.0 0.0
Germany 29.0 9.0 8.0 0.0 0.0
Other 41.0 46.0 49.0 8.0 23.0
Total 100.0 100.0 100.0 100.0 100.0
Source: KredEx, “Annual reports 2005-08”, KredEx, April 2006-09; KredEx, “Interest of
entrepreneurs in the export guarantees of KredEx is continually increasing”, KredEx, 4
March 2010.
5.4 Export credit guarantees by sector
Each year, KredEx provides details of the issued loan guarantee division per sector. This is
the commercial part of the company that insures loans to Estonian companies operating
nationally. However, for export credit guarantees or premiums no information on the
allocation over different economic sectors was found.
-19-5.5 Guarantees for carbon intensive sectors
Since no detailed list of specific projects was encountered either, no estimation can be made
of the share of carbon intensive projects in the total export credit guarantee volume of
KredEx.
-20-Chapter 6 Finland - Finnvera
6.1 General
Finnvera is a specialised financing company owned by the state of Finland that provides
loans, guarantees and export financing services.
Finnvera publishes basic information on long-term and medium-term (two years or over two
years) export credit guarantees when the principal guaranteed by Finnvera is over € 10
million or when a project is in environmental category A.
6.2 Total export credit guarantees
As Table 16 shows, the total export guarantees given by Finnvera more than doubled from
2004 to 2009. 2006 Saw a slight decrease compared to 2005 while the value of given
guarantees dropped significantly in 2007 to an amount of € 705.7 million. In 2008 however,
the export guarantees recovered and reached a record high of € 2,719.7 million. This amount
of export guarantees seems to have stabilized as in 2009 the number only dropped slightly to
a total of € 2,446.5 million. The amount of export guarantees given by Finnvera over the
years 2004-2009 in total is € 9,505.7 million.
Table 16 Finnvera: Export credit guarantees 2004-2009
Year Value of guarantees (mln €)
2004 987.1
2005 1,406.9
2006 1,239.8
2007 705.7
2008 2,719.7
2009 2,446.5
Total 9,505.7
Source: Finnvera, Annual Reports 2008, 2009, Finnvera.
6.3 Export credit guarantees by region
As Table 17 shows, over the years 2004-2009 Finnvera provided most export guarantees to
industrialized countries. Of the non-industrialised countries the CIS countries and Latin
America received most export guarantees of Finnvera. Sub-Saharan Africa only received 0.8
% of the total of guarantees given by Finnvera over the years 2004-2009. In the year 2008
this region got a relatively high amount of guarantees as Finnvera changed its policy in 2007
which enabled them to guarantee credits to 37 new countries, mainly in Africa. 6
-21-Table 17 Finnvera: Export credit guarantees per region 2004-2009
Percentage
Region 2004 2005 2006 2007 2008 2009 Total
of total (%)
Asia 211.2 309.5 181.0 142.1 199.1 599.2 1,642.1 17%
CIS 162.5 483.0 406.3 189.4 555.3 78.3 1,874.8 20%
Central and Eastern 384.2 4%
125.4 1.4 96.7 - 144.1 16.6
Europe
Latin America 257.9 165.2 154.7 249.0 817.9 480.0 2,124.7 22%
Middle East and North 1,015.9 11%
147.5 85.5 222.9 87.4 319.8 152.8
Africa
Sub-Saharan Africa 16.4 - 14.8 22.7 4.1 99.3 157.3 2%
Industrialised 2,306.7 24%
66.2 362.3 163.4 15.1 679.4 1,020.3
countries
Total 987.1 1,406.9 1,239.8 705.7 2,719.7 2,446.5 9,505.7 100%
Source: Finnvera, Annual Reports 2008, 2009, Finnvera.
6.4 Export credit guarantees by sector
Over the years 2004-2009 Finnvera mainly provided export credit guarantees for the
shipbuilding and shipping industry and to the telecommunication sector. Over the years, also
the forestry and wood processing sector became to play a larger role in Finnvera’s offered
guarantees. 7
Table 18 Finnvera: Export credit guarantees per sector 2004-2009
Percentage
Sector 2004 2005 2006 2007 2008 2009 Total
of total
Telecommunications 597.6 785.9 556.3 164.9 1,135.9 854.2 4,094.8 43%
Wood processing 84.8 149.4 315.2 273.3 286.7 213.3 1,322.7 14%
Power generation 177.0 25.2 82.8 47.5 347.1 106.6 786.2 8%
Shipping companies 2.4 309.1 181.4 - 687.8 835.4 2,016.1 21%
Other 125.3 137.3 104.1 220.0 262.3 437.0 1,286.0 14%
Total 987.1 1,406.9 1,239.8 705.7 2,719.8 2,446.5 9,505.8 100%
Source: Finnvera, Annual Reports 2008, 2009, Finnvera.
6.5 Guarantees for climate intensive sectors
Finnvera reports information about export guarantees provided to projects above € 10 million
and projects that fall in environmental category A. The total amount for the 45 export
guarantees provided in the period 2004-2009 for which details are reported is € 4,225.4
million. Of these, € 3,022.6 million was provided to 32 projects that fall in the category
‘carbon intensive’ as identified by FERN. Only based upon the reported projects, 71.5% of
the projects covered would thus fall in the category ‘carbon intensive’.
-22-If we compare this figure of € 3,023 million with the total of export credit guarantees provided
in the period 2004-2009 (€ 9,505.8 million, see Table 16), around 32% of the total amount of
export covered by Finnvera over the years 2004-2009 would fall in one of the ‘carbon
intensive’ sectors as identified by FERN. This however most probably is an underestimation
as Finnvera only reports information about projects supported above € 10 million or that fall
in environmental category A. Table 19 gives an overview of the distribution per defined
sector.
Table 19 Finnvera: Export credit guarantees to carbon intensive sectors 2004-2009
Percentage of total Percentage of total
Sector Amount (million €)
reported (%) covered (%)
Fossil-fuel electricity plant 208.2 4.9 2.2%
Shipping 1,858.1 44.0 19.5%
1
Iron & steel 23.3 0.6 0.2%
Pulp & paper 781.1 18.5 8.2%
2
Transportation infrastructure 151.9 3.6 1.6%
Total 3,022.6 71.5 31.8%
Source: Reported export credit guarantees, Website Finnvera, Viewed in March 2010.
1
This is an underestimation as there is no amount available of one of the two projects
supported by Finnvera that fall in this category.
2
This is an underestimation as there is no amount available of one of the four projects
supported by Finnvera that fall in this category.
-23-Chapter 7 France - Coface
7.1 General
Coface is not very transparent in reporting general information about amounts guaranteed or
regional/sectoral divisions. The website of Coface does not offer annual reports.
7.2 Guarantees for climate intensive sectors
Coface publishes information on large contracts, above € 10 million, obtained by French
companies and benefiting from Coface guarantee on behalf of the French State. Additionally,
Coface publishes all projects that fall in the environmental category A or B. This list is
updated every quarter. It provides a description of projects, basic information on their
environmental consequences and, where applicable, the requirements of Coface in the
matter.
Coface reported a total of 201 projects over the years 2004-2009. 145 of these projects fall in
the category ‘carbon intensive’ as identified by FERN. The export credit guarantee amount of
these 145 projects together comes to € 17,166 million. The total amount of the reported
projects is € 35,545 million. We can thus conclude that around 48% of the reported projects
of Coface falls in the category ‘carbon intensive’.
Table 20 gives an overview of the distribution across the sectors defined by FERN. The most
important category is airlines. This is largely to be attributed to Airbus that secured
guarantees of Coface of a total € 8872 million over the years 2004-2009 to deliver aircrafts to
airlines all around the world.
Table 20 Coface: Export credit guarantees to carbon intensive sectors 2004-2009
Sector Amount (million €) Percentage of total reported (%)
Fossil-fuel electricity plant 1,064.0 3.0
Oil & gas extraction 564.8 1.6
Shipping 2,210.3 6.2
Mining 0.0 0.0
Dredging 223.3 0.6
Iron & steel 410.3 1.2
Pulp & paper 0.0 0.0
Chemical industry 924.7 2.6
Transportation infrastructure 2,142.8 6.0
Aircrafts manufacturing 82.6 0.2
Airlines 9,543.3 26.8
Total 17,166.0 48.2
Source: Coface, “Reported projects”, Website Coface, Viewed in March 2010.
-24-Chapter 8 Germany - Euler Hermes
8.1 General
Euler Hermes is the official Export Credit Agency of Germany.
8.2 Total export credit guarantees
As Table 21 shows, the amounts guaranteed by Euler Hermes over the years 2004-2009 are
fairly stable around € 20,000 million. Only in 2006 the amount of guarantees offered
decreased to a record low € 16,971 million. This is the same trend we saw with Finnvera
(Finland) and can most probably be explained by the global economic downturn of that year.
Over the years 2004-2009 together, Euler Hermes provided export guarantees worth a total
of € 118,856 million.
Table 21 Euler Hermes: Export credit guarantees 2004-2009
Year Amount (mln €)
2004 21,067
2005 19,773
2006 20,553
2007 16,971
2008 20,683
2009* 19,809
Total 118,856
* As there are no numbers yet available for the total covered export volume of 2009, the
amount given in the table above is an estimation based upon the average covered
export volume of 2004-2008.
Source: Euler Hermes, Annual Reports 2004, 2005, 2006, 2007, 2008, Euler Hermes.
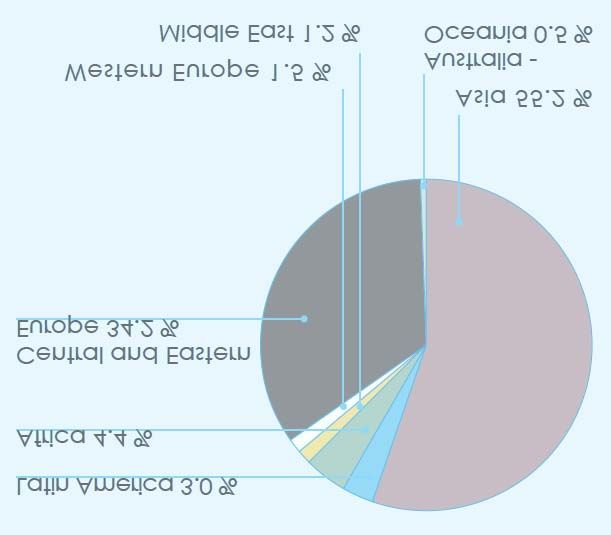
-25-8.3 Export credit guarantees by region
Table 22 gives an overview of how the guarantees issued by Euler Hermes were
geographically distributed over the past six years.
Table 22 Euler Hermes: Export guarantees by region (mln €)
Percentage
Region 2004 2005 2006 2007 2008 Total
of total (%)
3 4
Industrial countries 1,582 1,932 2,288 1,242 3,351 10,395 10.5
Central/Eastern Europe 3,523 3,568 3,425 n/a n/a 10,516 10.6
European developing countries 2,071 1,494 1,541 5,690 5,625 16,421 16.6
Africa 2,027 1,181 1,351 2,021 2,929 9,509 9.6
Latin America 2,599 2,454 3,253 2,403 2,325 13,034 13.2
Asia 9,291 9,142 8,438 5,608 6,451 38,930 39.4
Oceania 4.2 1.5 1.4 6.1 2.7 16 0.0
Total 21,067 19,774 20,297 16,971 20,683 98,821 100.0
Source: Euler Hermes, Annual Reports 2004, 2005, 2006, 2007, 2008, Euler Hermes.
8.4 Export credit guarantees by sector
Over the years 2004-2009 Euler Hermes reports a division of guarantees offered by goods.
As Table 23 shows, by far the most guarantees were given for plants and for machinery and
equipment.
Table 23 Euler Hermes: Reported guarantees by goods 2004-2007 (mln €)
Goods 2004 2005 2006 2007
Plants 5,368 4,728 5,607 4,712
Machinery and equipment 2,397 2,043 2,122 2,132
Electronic, precision engineering and
1,109 1,182 554 492
optical equipment, telecommunication
Shipping 815 1,459 2,516 601
Vehicles 356 507 289 597
Aircraft 1,279 1,676 932 875
Construction services 234 140 470 421
Others 359 409 284 403
Total 11,917 12,142 12,774 10,233
Source: Euler Hermes, Annual Reports 2004, 2005, 2006, 2007, Euler Hermes.
For 2007 and 2008 Euler Hermes provides a different division of guarantees offered as they
use a sectoral division. As Table 24 shows, over 2008 most guarantees given by Euler
Hermes concerned projects in the Infrastructure, Manufacturing and Energy sector.
3
OECD high income countries
4
OECD high income countries
-26-You can also read