Use of GIS in Hydrogeochemical Study and Quality Status From Pudukkottai District, Tamil Nadu, India
←
→
Page content transcription
If your browser does not render page correctly, please read the page content below
Use of GIS in Hydrogeochemical Study and Quality Status From Pudukkottai District, Tamil Nadu, India Muruganantham Arumugam Alagappa University Faculty of Science Sivakumar Karthikeyan Alagappa University Faculty of Science Prabakaran Kulandaisamy ( prabakarank@alagappauniversity.ac.in ) Alagappa University Faculty of Science https://orcid.org/0000-0002-3393-8033 Kongeswaran Thangaraj Alagappa University Faculty of Science Venkatramanan Senapathi Alagappa University Bangaru Priyanga Sundaram Alagappa University Faculty of Science Agastheeswaran Vellaikannu Alagappa Government Arts College Perumal Velmayil Alagappa University Faculty of Science Research Article Keywords: Hydrogeochemical, groundwater quality, DWQI, IRWQI and GIS Posted Date: June 17th, 2021 DOI: https://doi.org/10.21203/rs.3.rs-577840/v1 License: This work is licensed under a Creative Commons Attribution 4.0 International License. Read Full License
Authors: Muruganantham A1, Sivakumar K1, Prabakaran K1, Kongeswaran T1, Venkatramanan S2, Bangaru
           Priyanga S1, Agastheeswaran V3,1 and Perumal V1
Title:     Use of GIS in hydrogeochemical study and quality status from Pudukkottai District, Tamil Nadu, India
Affiliation:
1
    Department of Geology, Alagappa University, Faculty of Science, Karaikudi-630003, India
2
    Department of Disaster Management, Alagappa University, Karaikudi-630003, India
3
    Department of Geology, Alagappa Govt. Arts College (Affiliated to Alagappa University), Karaikudi-630003, India

*Corresponding author email:prabakarank@alagappauniversity.ac.in
ORCID:

Muruganantham Arumugam: 0000-0002-2832-722X; Sivakumar Karthikeyan: 0000-0001-8164-1157;

Prabakaran Kulandaisamy: 0000-0002-3393-8033; Kongeswaran Thangaraj: 0000-0002-0752-8727;

Venkatramanan Senapathi: 0000-0002-1698-1101; Bangaru Priyanga Sundaram: 0000-0002-6346-4342;

Agastheeswaran Vellaikannu: 0000-0002-5360-6431; Perumal Velmayil: 0000-0002-5744-0870

Abstract

This study focused on hydrogeochemical characterisation and groundwater quality deterioration based on drinking,
irrigation purposes in Pudukottai district. Eighty-seven groundwater samples were collected from the bore and dug
wells during pre and post monsoon seasons in the year 2019. The order of mean abundance of ions is followed as C l
> HCO3 > Na > SO4 > Mg > Ca > K (325.5 > 182.2 > 181.4 > 83.2 > 51.1 > 35.8> 9.1 > 8.6 > o.9 > 0.3) and Cl >
Na > HCO3 > SO4 > Mg > Ca > K (415.7 > 230.3 > 198.2 > 82.9 > 53.8 > 43.4 > 14.9) in both seasons. Analytical
results are used in Piper, Gibbs, Na% vs. EC, USSL, and PI to evaluate the hydrogeochemical processes. Rock water
interaction and evaporation processes causing variations in hydrogeochemistry of the study area during pre and
postmonsoon. Nearly 15 % of the groundwater samples were not permissible for drinking based on the standard,
which is distributed in south eastern region of the study area. It is revealed from Na%, SAR, RSC, MgC and KR
results that majority of the groundwater samples are fit for irrigation uses. The higher concentration of EC, TDS, Cl
and Na values noted in south region due to the sea water intrusion that attributed by excess pumping in the coastal
regions. The drinking water quality index (DWQI) and irrigation water quality index (IRWQI) are calculated to
identify the suitability of groundwater for drinking and irrigation purposes. However, this research concludes that
the groundwater quality of maximum part in the district is appropriate for drinking as well as agriculture which can
be used for the sustainable growth. It is also recommended implementing the artificial recharge techniques to
improve the groundwater quality.

Keywords: Hydrogeochemical, groundwater quality, DWQI, IRWQI and GIS
Declarations

Funding

          This article has been written with the financial support of RUSA – Phase 2.0 grant sanctioned vide letter No.

24-51/2014-U, Policy (TNMulti-Gen), Department of Education, Government of India, Dated. 09.10.2018.

Conflicts of interest/Competing interests

          The authors declare that they have no competing interests.

Availability of data and material

          The datasets used and/or analyzed during the current study are available from the corresponding author on

reasonable request.

Code availability

          Not applicable

Authors' contributions

         Muruganantham Arumugam: conceptualization; methodology; writing-original draft preparation

          Sivakumar Karthikeyan: conceptualization; methodology; writing- review and editing.

          Prabakaran Kulandaisamy: supervision; writing-review and editing.

          Kongeswaran Thangaraj: data collection, editing data processing and visual interpretations

          Venkatramanan Senapathi: formal analysis and writing-review and editing

          Bangaru Priyanga Sundaram: data processing and visual interpretations

          Agastheeswaran Vellaikannu: conceptualization; methodology; writing-review and editing

          Perumal Velmayil: data collection and editing

Ethics approval: Not applicable

Consent to participate: Not applicable

Consent for publication: All the authors have given their consent for the publication of this article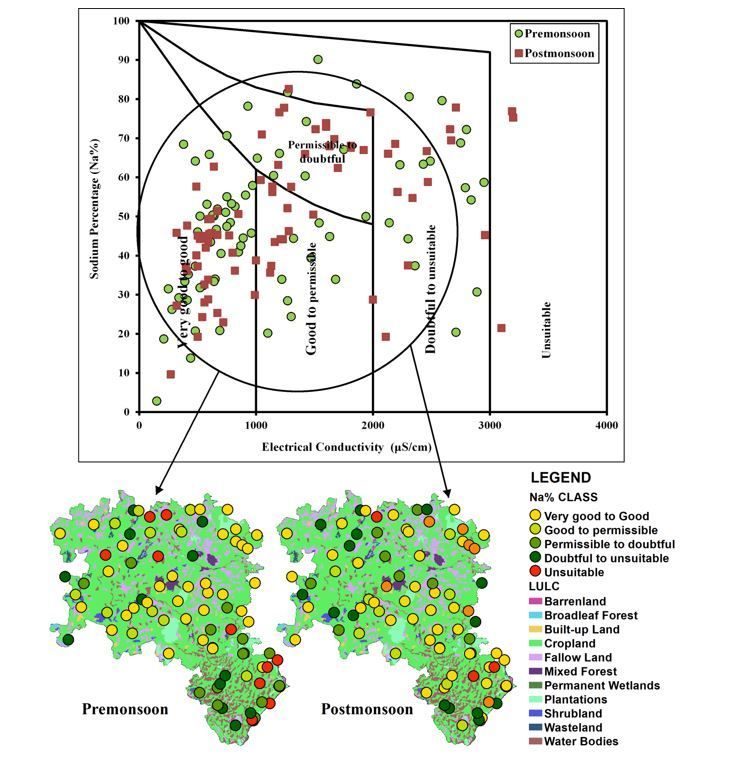
Use of GIS in hydrogeochemical study and quality status from Pudukkottai District, Tamil Nadu, India

Introduction

Groundwater is a dynamic and replenishing natural resource, which forms the core of the ecological system. The
emerging global freshwater crisis in terms of water quality and quantity is already felt in India. Quality of
groundwater has particularly received immense attention since the groundwater is required for domestic and
irrigation purpose (Prabakaran et al. 2020).Land and water are precious natural resources on which rely the
sustainability of agriculture, industrialization and the civilization of mankind. Unfortunately, they have been subject
to severe exploitation and contamination due to anthropogenic activities such as artisanal mining, industrial effluent,
dumpsites, gas flaring, oil spillage and petroleum refining leading to the release of heavy metals into the aquatic
environment (Nair et al. 2021). Groundwater is not only the most important resources for drinking purposes and it is
also used extensively to satisfy agricultural, domestic and industrial water demands (Sivakumar et al. 2021).
Generally, maximum crop yields management can be obtained based on the water quality and soil. In addition, the
decrease of drinking water quality has been reported in many cases followed by groundwater contamination
(Sivakumar et al. 2016; Ramachandran et al. 2020; Roy et al. 2021; Nair et al. 2021). Geochemical studies are
widely used to understand the probable changes in groundwater quality (Arumugam and Elangovan 2009). Variation
of groundwater chemistry mainly controlled by the factors of geology, chemical weathering intensity of rocks,
recharging water quality and other inputs from anthropogenic sources (Adithya et al. 2021). These factors with their
interactions result in a complex quality of groundwater in various aquifer system (Aghazadeh & Mogaddam, 2010).
The groundwater salinization is a major issue whichis triggered by seawater intrusion, agrochemical effluents,
geogenic contamination and salinization induced by irrigation (Selvam et al. 2021). The rapid increase in the
population of the country has led to large-scale groundwater depletion in some areas. Seasonal and spatial variations
caused by condensation, dispersion, dissolution, oxidation, precipitation, reductions, sorption and volatilization are
major geochemical processes (Sarath et al. 2012). To achieve the quality control and improvement, understanding
these interrelated processes is very important due to their control over the chemistry of groundwater (Subba Rao et
al. 2011).Modern GIS technology can be used to identify the groundwater potential zone (Agastheeswaran et al.
2021), portable zone (Prabakaran et al 2020) and to delineate the saline water from fresh water zone (Selvam et al.
2021). Water Quality index (WQI) approach is another important tool used to convert complex water quality data
into easily interpretable form. It reports the overall quality of water at an allocation for the specific purposes (Chung
et al. 2015; Venkatramanan et al. 2016). WQI integrated with GIS gives more precise and reliable results of spatial
distribution of overall water quality (Venkatramanan et al. 2016; Ramachandran et al. 2020). For this purpose, we
have approached the important research tasks such as (1) understanding the complex nature of hydrogeochemical
process, (2) GIS techniques were used to determine the suitability for groundwater in the purpose of drinking and
irrigation uses and (3) we investigated both natural and anthropogenic sources of this region. Also it appraised the
updated scientific basis of groundwater quality deterioration and its sources in this region and may offer a treasured
insight for future research.
Study area

This region is situated between 78°25′ and 79°15′ east longitudes and between 9°50′ and 10°40′ of north latitudes. It
is wide spread with an aerial extent of about 4,663sq.kmand a coastal stretch of 35km.The hard rocks are found on
the western part and sedimentary formation found towards the eastern part. About 45% of the area is under hard
massive formation of Archean age. Granitic gneiss, hornblende biotite gneiss, charnockites, pegmatite and quartzite
are the various types of rocks encountered in this region and the rest 55% comprises of the sedimentary formation
ranging from pre-cambrian to quaternary period. Sedimentary deposits consist of clay, limestone, sand stone and
clayey sandstone. The coastal alluvial deposits consist of unconsolidated sands, gravels and clay which are the major
water bearing formations. The annual mean water level is varies between 0.58m and 9.50m below ground level. The
transmissivity values in crystalline rock is
content (MgC) (Eq.6) and Kelly’s Ratio (KR) (Eq.7) were calculated using excel spread sheet. The same was used to
plot the PI diagram whereas, Piper, Gibbs, Wilcox USSL, Na% vs. EC plotted using Aquachem software. The water
quality index formula was followed from Ramachandran et al. (2020) and modified after Prabakaran et al. (2020)
(Eq.8).

                                   TH = (Ca2+ + Mg 2+ )meq/l × 50………..Eq (1)

                                                 Na+
                                  SAR =                       ……………………..Eq (2)
                                           √(Ca2+ +Mg2+ )/2

                                                (Na+ +K+ )×100
                                   Na% =
                                            (Ca2+ +Mg2+ +Na+ +K+ )
                                                                  ………………Eq (3)

                                           (CO2−    −
                                              3 +HCO3 )
                                  RSC =                    …………………………Eq (4)
                                           (Ca2+ +Mg2+ )

                                           (Na+ +√HCO−
                                                     3 )×100
                                    PI =                        …………………Eq (5)
                                           (Ca2+ +Mg2+ +Na+ )

                                              (Mg2+ )×100
                                    MgC = (Ca2+ +Mg2+ )……………….…....Eq (6)

                                                Na+
                                    KR = (Ca2+ +Mg2+ )………………………Eq (7)

                                                   Wi
                                    WQI = ∑ [∑n            ] × qi……………..….Eq (8)
                                                  i=1 Wi
          Where ‘wi’ is the assigned weightage for selected parameters and ‘n’ is the number of parameters selected
for WQI assessment. The ‘qi’ denotes the ranking assigned for class range based on the standards for drinking and
irrigation. The standard range of values provided by WHO and BIS was taken to derive the drinking water quality
index (DWQI), whereas for the derivation of irrigation water quality index (IRWQI), the irrigation water quality
parameters such as EC, TDS, TH, Na%, SAR, MgC, RSC and KR were taken. All the plots are integrated with the
ArcGIS v10.2 to determine the spatial pattern for the classification of hydrogeochemical plots (Fig. 3 to 8).
Results and discussion
The statistical summary of all the groundwater parameters are given in the Table (1) and the spatial distribution of
the total dissolved solids with the spatial pattern of all the major ions are shown in the Figure (2) as pie charts in the
map.
                          Table 1. Statistics of the water quality parameters in both seasons
                        Table 2. Water quality standards for drinking based on WHO and BIS
Drinking quality
Physical constituents
Hydrogen ion activity (pH)
The pH value is ranging between 7.0 and 8.4 with a mean value of 7.7in premonsoon and the same is ranging
between 7.0 and 8.8 with a mean value of 8.33 during postmonsoon. The groundwater quality is good for drinking
based on the premonsoon pH values when compared with WHO (2017) and BIS (2012) guideline values. However a
small part in the northern and in the south-western region which shows higher pH values(>8.5) caused by the mining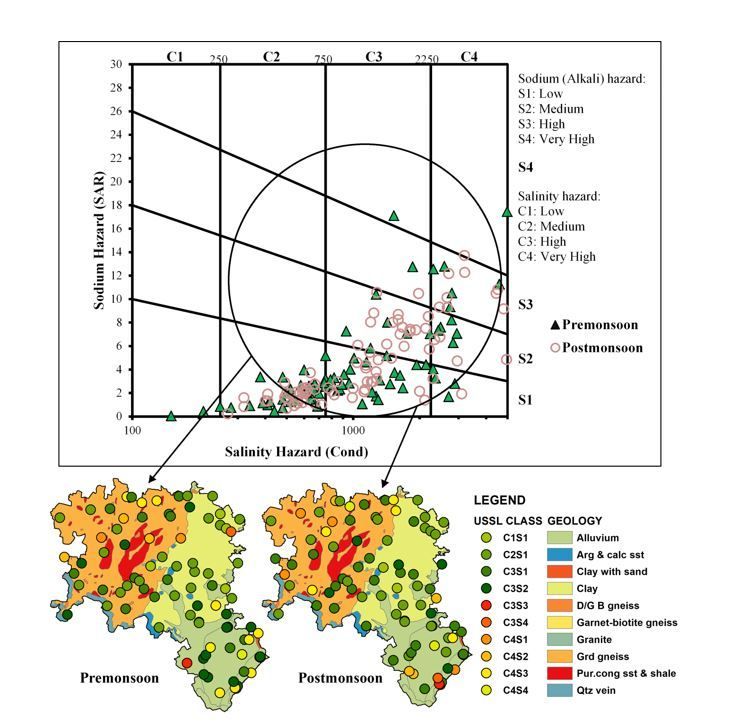
leaches mixed with groundwater and addition to the seawater input in south-western coastal region during
postmonsoon (Venkatramanan et al. 2016).It is found that most of the water plant companies are located around the
southern part.
Total Dissolved Solids (TDS)
TDS levels of above 2000mg/L are unsuitable and not suggested for drinking purpose (Table 2).TDS levels of more
than 3000mg/L affected the agricultural land (Table 3). Premonsoon TDS values are ranging from78 to 7248 mg/L
with an average of 822 mg/L, whereas it is varying from145 to 5938 mg/L with an average 982 mg/L during
postmonsoon. In premonsoon season 45.97% sample, are desirable for drinking and 26.43% samples are permissible
for drinking, 24.13% samples are useful for irrigation and 3.44% samples are unfit for irrigation. In case of
premonsoon, southwest part is having high TDS values due to agricultural activities (Sivakumar et al. 2016). While
postmonsoon season 37.93 and 29.88% of samples are desirable and permissible limit for drinking purpose and
27.58% samples are useful for irrigation,4.5% samples are unfit for irrigation. North and south-eastern part are
having high TDS value exhibit the mining activity and saline water intrusion due to the mining dump sites and over
exploitation(Fig. 2).
                        Fig 2. Spatial distribution map shows the TDS with major ions as pie chart
Electrical Conductivity (EC)
The total ionized constituent of natural water is generally indicated by the EC values and is directly connected to the
total cations and anions. In other hand, it is directly proportional to the value of total dissolved solids (Prabakaran et
al. 2020). The minimum, maximum and average EC values determined is 150, 11340& 1411µS/Cm and 270,
10170& 1699.1µS/Cm in pre and postmonsoon seasons, respectively. During premonsoon 3.44% sample are
excellent and 39% samples are good for irrigation purpose respectively,37.8% samples are permissible for irrigation,
16.09% samples are doubtful and 3.44% sample are unsuitable for irrigation. While,33.33% samples are good for
irrigation purpose,40.22% samples are permissible for irrigation, 13.79% samples are doubtful for irrigation and
12.64% samples are unsuitable for irrigation purpose in postmonsoon season (Table 3). This is attributed by
dissolution of minerals from the aquifer media by intrusion of seawater increases the dissolved solids in
groundwater which leads to increased EC value (Ramachandran et al. 2020).
Chemical constituents
Calcium (Ca) and Magnesium (Mg)
In premonsoon season, the Ca content is ranging between 10 and 116 mg/L. While in postmonsoon season, it is
varied from 8 mg/L to 224 mg/L. In case of premonsoon season 90.80% sample, are excellent for drinking and
9.19% samples are permissible for drinking, most of the sample are good for drinking purpose. 85.05% of samples
are excellent for drinking and 13.79% samples are permissible for drinking, some of the samples shows high Ca
values in the area of northern part during the postmonsoon (Fig.2). Mg concentration in groundwater is varied
between 8.51 mg/L and 359.64 mg/L during premonsoon and the same is between 10.9 mg/Land 233.28mg/Lin
postmonsoon season. During premonsoon season 45.97%, samples are excellent, 42.52% samples are good and
9.19% samples are poor for drinking purpose. In postmonsoon season, 39.08% samples are excellent followed by
45.97% and 14.94% samples are permissible and poor for drinking purpose. High Mg content was found in the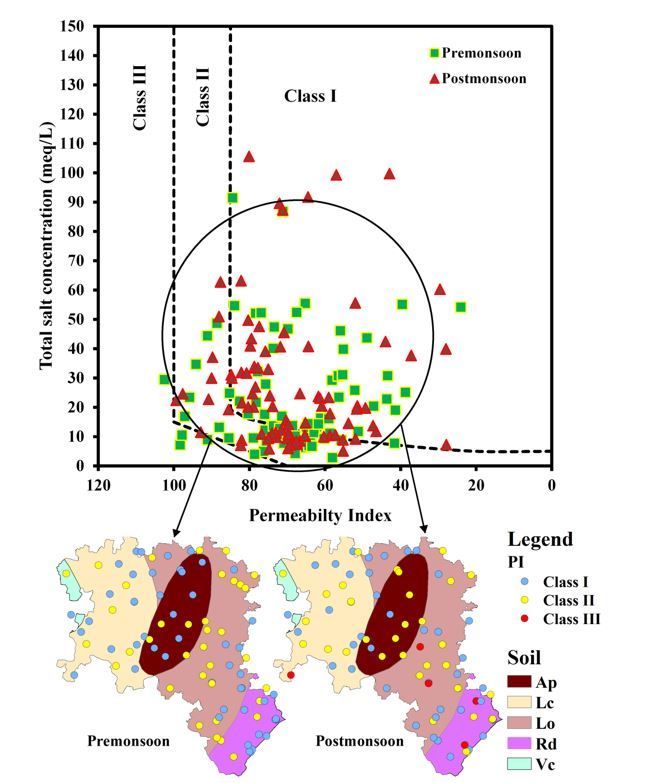
northern and southwest part in postmonsoon, whereas central part of the study area is affected by Mg in premonsoon
season. Due to the mineral dissolution from the host rocks (Nair et al. 2021).
Sodium (Na) and Potassium (K)
Sodium is the important element for plants and animals though it is required to maintain the metabolic activities
(ref). During postmonsoon, groundwater samples Na is ranges from 6 to 1916 mg/L and from 1 to 1766 mg/L in
premonsoon. Na affected in the region of western, southeast and small patches of southwest regions in premonsoon.
While postmonsoon season, few location affected by Na and distributed in western part of the area. The
concentration of K is ranging from 0.1to 168mg/L and from 0.1 to 117mg/L in pre and postmonsoon seasons. The
trend of K concentration is increasing towards east in premonsoon and increasing towards west in postmonsoon. The
higher concentration of Na and K may be originated from seawater intrusion and fertilizer (Venkatramanan et al.
2016).
Chloride (Cl)
Natural waters contain Cl a major dissolved constituent which is also used as good indicator of water quality (Sarath
et al. 2012). Cl concentration in groundwater ranges between32 and 2836 mg/L and between 18 and 4013 mg/L in
pre and postmonsoon seasons, respectively. In case of premonsoon season, 59.10% samples are excellent, 36.78%
are good and 4.59% samples are poor for drinking. In postmonsoon season 52.87% sample are excellent for
drinking, 37.93% samples are permissible and 9.19% samples are poor for drinking (WHO, 2008; BIS,
2012).Groundwater of the southeast part is contaminated by Cl in premonsoon. While postmonsoon season, high Cl
was found in the northern part and south-eastern part. Higher concentration of Cl ion in groundwater may point out
the significant influences of seawater intrusion and fertilizer waste. High concentration of Cl may be harmful to
human health such as heart, kidney, indigestion and palatability (CPCB, 2008).
Carbonate (CO3) and Bicarbonate (HCO3)
The CO3 level is ranges from BDL (below detectable limit) to 12 mg/L in premonsoon and it is varies from BDL to
36 mg/L in postmonsoon. Bicarbonate and carbonate levels of
i.e. dissolution and oxidation of sulphate and sulphide minerals, intrusion of seawater and sources from
anthropogenic origin (Srinivasamoorthy et al. 2014).
Fluoride (F)
Fluoride content is ranges between 0.05 and 1.0 mg/L during premonsoon and the same is ranges between 0.05and
1.63 mg/L during postmonsoon. In premonsoon season, 97.70% and 2.29% samples are excellent and are good for
drinking uses. In postmonsoon season 93.10%, 5.74% and 1.14% samples are excellent, permissible and poor for
drinking purpose. During postmonsoon period, F content is high in the northern part because of dissolution of
fluoride baring granitic rocks that are present in the study area is the source for the enrichment of the groundwater
(Kalpana et al. 2019).The excess fluoride in groundwater as being the only source of fresh water in drinking
purposes may leads to the dental fluorosis condition to the people.
Total Nitrogen (NO2+NO3)
The total nitrogen concentration in groundwater samples ranges between 0.05and84 mg/L with a mean of 8.57
mg/L. Also, it ranges between 0.1and45 mg/L with the mean of6.37 mg/L in pre and postmonsoon season,
respectively. Atmospheric nitrogen gas is mineralised by soil bacteria and converted into ammonium. Further the
nitrifying bacteria under aerobic conditions convert it into nitrate hence the origin for the concentration of nitrogen
in groundwater is biosphere (Tindall et al. 1995; Saleh et al. 1999).
Total hardness classification
Even though water hardness was not identified for hostile effects, some specific indication relates it in heart sickness
(WHO, 2008). Hard water stands inappropriate for general use and it has a degree of the Ca2+ and Mg2+
concentration expressed in equivalent of calcium carbonate. The measure of water that react with soap compound
and precipitate Ca2+ and Mg2+ as carbonates, chlorides and sulphates is defined as hardness of water. The presence
of CaCO3is released from boiling water is measured as temporary hardness whereas the removal of Ca2+ and Mg2+
ions only by means of ion exchange processes is called as permanent hardness (Srinivasamoorthy et al. 2014).
Scaling on pots, boilers and irrigation pipes are caused by water hardness which limits its usage in industries and
also causes kidney failure problems to the human health (WHO 2008). Equation (1) was proposed by Todd 1980 to
determine the total hardness. During premonsoon, TH ranges between 60 and 1740 mg/L with a mean 299.62 mg/L
and representing 29.87% of the groundwater samples beyond the soft and moderate level. In postmonsoon, TH
varies between 85 and 1,520 mg/L with mean value of 329.24 mg/L and representing 20.68% of the samples
exceeding the soft and moderate limit (Table 3). It has inferred that, both the seasons records moderate TH as
permanent hardness due to the mining and industrial activities in eastern coastal region (Sivakumar at al. 2016).
Table 3 Groundwater suitability for irrigation as per the quality parameters
Hydrogeochemical processes
Different facies of hydrogeochemical process
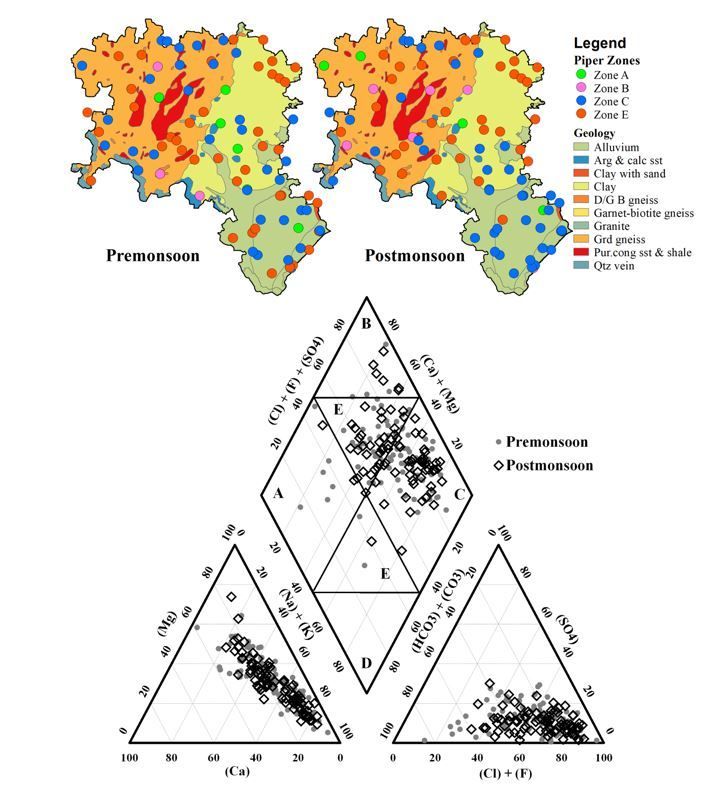
Piper diagram (Fig. 3) was developed to understand water chemistry of different hydrogeological facies. The
difference or dominance of cation and anion in the groundwater is explained by the Piper diagram in both seasons.
The higher percentage of samples falling under the second broad category of alkali earth (Na+K) exceeds alkaline
earth (Ca+Mg) was 53.75% during the premonsoon and 54.02% in postmonsoon. The strong acids (SO4+Cl)exceeds weak acids is the forth broad and dominant category which holds 90% and 94.25% in both seasons. The
non-carbonate alkali exceeds 50% (Na+Cl) is the dominant water type in pre and postmonsoon season of
groundwater samples which is about 51.25% and 54.04% respectively. This water type causes the primary salinity to
the groundwater of the study area. No one cation-anion pair exceeds 50% is the second dominant water type with
37.75% in premonsoon and 34.48% in postmonsoon season. The carbonate hardness exceeds 50% (Ca+Mg+HCO3)
water type exist about 7.5% followed by 3.75% of non-carbonate hardness exceeds 50% (Ca+Mg+SO4) water type
during premonsoon. Whereas, same water types exist during postmonsoon as 4.59% and 6.89% respectively. These
water types are causing the secondary alkalinity and secondary salinity to the groundwater. Carbonate alkali exceeds
50% (Na+HCO3) water type causes the primary alkalinity to the groundwater. It is lead by the dissolution of
minerals from the weathered rocks and recharge by precipitation processes. The primary salinity maybe attributed
by the seawater intrusion or by the formation salt in the coastal regions of the district. The samples has classified
based on the Piper diagram and spatially shown on the geology map of the study area (Fig.3). It clearly shows the
correlation between the water type and rock types that present in the study area.
Fig 3. Piper plot for both seasons with spatial distribution maps of hydrological facies
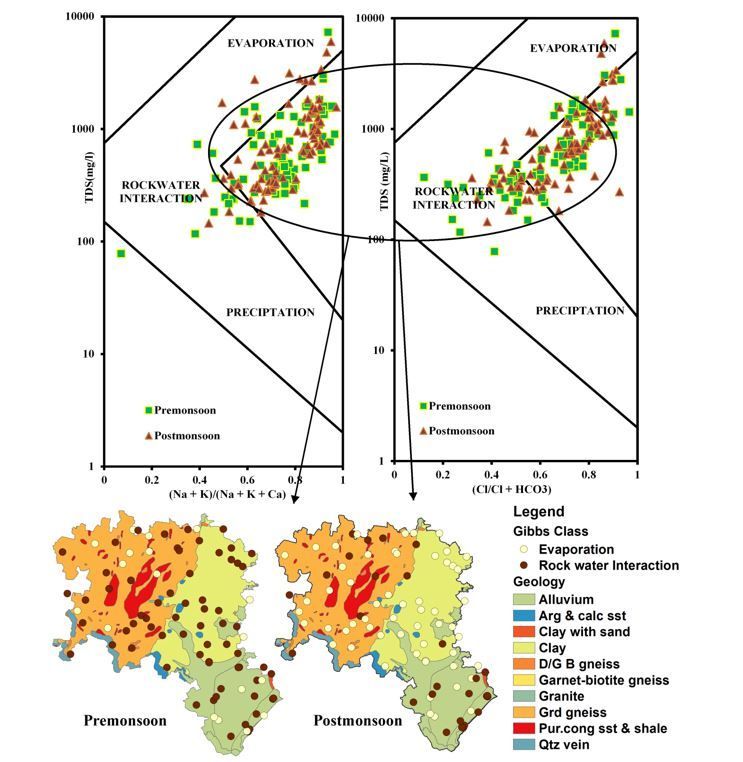
Mechanism controlling the groundwater processes
Three major mechanisms such as evaporation, precipitation and rock water interaction are the processes controlling
the water quality derived from the Gibbs (1970) diagram. Gibbs diagram shows 73.75% of the groundwater samples
fall between 100 and 1000 (mg/L) TDS in premonsoon signifying the rock water interaction is the main controlling
factor in the study area. Whereas in postmonsoon season, evaporation (67.82%) process is followed by rock water
interaction (32.18%) are the dominant controlling factors. Weathering of host rock silicate minerals are contributing
towards the enrichment of water variation in aquifers (Venkatramanan et al. 2016). The lower concentration of Ca
and Mg in groundwater is due to the lower concentration of carbonate minerals in the lithology of the region, though
Na and K values show that silicate weathering followed by hard rock weathering (Chung et al. 2015). Many samples
poses carbonate of below detectable limit however, bicarbonate is found present in all the samples during both
seasons (Fig.4).
Fig 4. Gibb’s plot for both seasons with spatial distribution map of influencing factors
Irrigation quality
Sodium percentage (Na%)
Sodium reacts with soil and reduces its permeability makes it as a significant ion studied to classify the water quality
for irrigation. It is generally denoted as soluble sodium percentage or percent sodium (%Na) and is widely used to
assess the water suitability for irrigation purposes (Wilcox, 1955; Todd, 1980; Islam et al. 2017). The ratio of Na
and the total cations present in the water is computed as Na% where all values are calculated in meq/L. The sodium
percentage values shows that only 3.44% of the pre and post monsoon samples are excellent (1955).Land use and land cover map is used as a base layer to overlay the obtained classes from Na% vs. EC plot for
irrigation purposes (Fig.5).
Fig 5. Na% vs. EC plot for both seasons with irrigation suitability map
Sodium Adsorption Ratio (SAR)
SAR is used to determine the sodium hazard for irrigation waters though it is used to find the suitability of
groundwater for irrigation, where it measures the alkali or sodium hazard to crops. Increase in SAR value leads to
increase the sodium hazard and decrease the water quality for irrigation uses. The dispersion and flocculation of
sodium and specific conductance affects the soil infiltration rates through the irrigation water (Aghazadeh &
Mogaddam, 2010). Irrigation water with larger SAR values can’t be tolerated by soils. The study area SAR values
are ranging from18.42 to 27.78 with a mean value of 4.40 and from 0.238 to 8.16 with a mean value of 5.18 in pre
and postmonsoon seasons, respectively. SAR value classified as 83.9% excellent (>10), 14.94% good for irrigation
purpose (10-18) and 1.14% doubtful (18-26) for irrigation purpose in premonsoon. While postmonsoon, SAR value
classified as 87.35% excellent (>10),10.34% good (10-18), and 2.29% doubtful (18-26)for irrigation uses. This
shows that crops in the study area do not have alkali hazards. US salinity diagram (USSL) illustrates the SAR values
against the EC values to classify the water quality for irrigation purposes (Fig.6). According to the USSL
classification plot the sodium and salinity hazard class is followed as
C2S1>C3S1>C3S2>C4S2=C4S3>C4S1>C1S1=C4S4>C3S3=C3S4 in premonsoon and in postmonsoon it is
ordered as C2S1>C3S1>C3S2>C4S3>C4S2>C4S1>C4S4=C3S3. The result shows that medium to high saline
groundwater with low to medium alkali hazard (C2S1+C3S1= 67.5% and 57.47% respectively) in both seasons. The
sodium hazard and salinity hazard classification result have overlaid on the study area geology map (Fig.6).
Fig 6. USSL plot for both seasons with spatial distribution map classes
Residual Sodium Carbonate (RSC)
The rise of carbonate and bicarbonate values over calcium and magnesium concentration is alarming to the soil
fertility and plants growth (Brindha et al. 2013) hence it is used to decide the appropriateness of water for irrigation.
The RSC values during premonsoon are ranging between 0.023 and 1.49(meq/L) with a mean value of 0.7(meq/L).
While postmonsoon RSC values are varies from 0.025 to 2.99 and the average value is 0.95. Overall96.56% and
93.12% in pre and postmonsoon seasons, respectively with the groundwater samples fall below1.25 meq/L and are
suitable for irrigation (Srinivasamoorthy et al. 2014).
Permeability Index (PI)
Doneen (1964) plotted PI against total salt concentration and divided into three water quality class. Class I indicate
the 100-75% soil permeability exhibit suitable for irrigation. Whereas class II indicates 75-25% soil permeability
which is moderately suitable for irrigation and class III isLo-Orthic Luvisols and Vc-Chromic Vertisols (IUSS Working Group WRB, 2015). The soil type map has used as
base layer to overlay the class derived from the PI vs. TSC plot (Fig.7).
Fig 7. Doneen’s PI plot for both seasons with spatial distribution map of classes
Magnesium Content (MgC)
Most of the groundwater generally shows equilibrium state between Ca2+ and Mg2+ions (Hem 1985). Since, increase
in Mg2+ ions collapses this equilibrium and impacts the soil quality by increasing its alkalinity which ultimately
decreases the crop yield (Kumar et al. 2007). The magnesium hazard is calculated using an index proposed by
Paliwal (1972). The MgC ranges from 8.51 to 359.64 mg/L and 10.9 to 233.28 for premonsoon and postmonsoon
season respectively. During premonsoon 57 samples and in postmonsoon 55 samples falls over the allowable value
of 50 mg/L representing the increased soil alkalinity and leads to adverse effect on crop yield. Those samples would
adversely affect the crop yield by making the soil more alkaline (Paliwal, 1972).
Kelly’s Ratio (KR)
Kelly’s ratio is used to divide the water quality as either suitable or unsuitable for irrigation uses. Sodium measured
against total calcium and magnesium is considered as Kelly’s ratio (KR). KR of above (KR>1) indicates an excess
level of sodium in waters (Kelly, 1940). Therefore, waters with a KR ofsuitable for drinking as well as irrigation purposes. By implementing artificial recharge structures in thegroundwater
contaminated area will improve the quality and will make it suitable for both purposes.
Fig 8. Spatial distribution maps of calculated DWQI & IRWQI for both seasons
Table 6 Drinking Water Quality Index (DWQI) class for Pudukottai district
Table 7 Irrigation Water Quality Index (IRWQI) class for Pudukottai district
Conclusion
Groundwater quality in both seasons is mostly suitable for drinking uses when comparing the analytical results with
the proposed drinking water guidelines. The abundance sequence of ions was in the following order:
Cl>HCO3>Na>SO4>Mg>Ca>K and Cl>Na>HCO3>SO4>Mg>Ca>K in pre and postmonsoon seasons. In case of
calculated values of irrigation water quality parameters (TH, Na%, SAR, RSC, PI, MgC and KR) show that the
majority of the groundwater samples are appropriate for irrigation and it also verified by comparing the EC and TDS
values. Alkali earth exceeds alkaline earth and strong acids exceed weak acids are the dominant hydrogeological
facies which is followed by non-carbonate alkali exceeds 50% facies water type in both monsoons. Gibbs plot shows
evaporation and rock water interaction are the major controlling factors of the hydrogeochemistry. The
comprehensive WQI technique was used to know the groundwater suitability for drinking and irrigation uses. The
DWQI and IRWQI spatial maps of higher concentration exhibits the south-eastern, north and north-western parts
which is controlled by seawater intrusion and irrigation inputs. While southern and central part shows unpolluted
zones. The characteristics of groundwater in this region were primarily due to the natural processes such as mineral
dissolution, ion exchange, and leaching. Secondarily, the area was affected by seawater intrusion, mining activities,
fertilizer and pesticide inputs increased the degradation of the groundwater quality. Groundwater quality can be
improved in this region by implementing the groundwater management scheme of artificial recharge that ensures
sustainable and non-hazardous groundwater resources for drinking, agriculture, and domestic purposes.
Funding
This article has been written with the financial support of RUSA, Phase 2.0 grant sanctioned vide letter No. 24-
51/2014-U, Policy (TNMulti-Gen), Department of Education, Government of India, dated September 10, 2018.
Reference
Adithya VSP, Chidambaram S, Prasanna MV, Venkatramanan S, Tirumalesh K, Thivya C, Thilagavathi R (2021)
Health Risk Implication and Spatial Distribution of Radon in Groundwater Along the Lithological Contact in South
India. Archives of Environmental Contamination and Toxicology, 80(1), 308–318. https://doi.org/10.1007/s00244-
020-00798-9
Agastheeswaran V, Udayaganesan P, Sivakumar K, Venkatramanan S, Prasanna Mohan V, Selvam S (2021)
Identification of groundwater potential zones using geospatial approach in Sivagangai district, South India. Arabian
Journal of Geosciences, 14(1), 8. https://doi.org/10.1007/s12517-020-06316-4
Aghazadeh N, Mogaddam AA (2010) Assessment of Groundwater Quality and its Suitability for Drinking and
Agricultural Uses in the Oshnavieh Area, Northwest of Iran. Journal of Environmental Protection, 01(01), 30–40.
https://doi.org/10.4236/jep.2010.11005APHA (2017) Standard methods for the examination of water and waste water, 23 rd edn. E.W. Rice, R.B. Baird, A.D. Eaton, editors, American Public Health Association, American Water Works Association, Water Environment Federation, Washington Arumugam K, Elangovan K (2009) Hydrochemical characteristics and groundwater quality assessment in Tirupur region, Coimbatore district, Tamil Nadu, India. Environ Geol 58:1509–1520 BIS 2012. Indian standard drinking water specification IS: 10500. Bureau of Indian Standards, New Delhi. Brindha K, Neena Vaman KV, Srinivasan K, Sathis Babu, M, Elango L (2013) Identification of surface water- groundwater interaction by hydrogeochemical indicators and assessing its suitability for drinking and irrigational purposes in Chennai, Southern India. Applied Water Science, 4(2), 159–174. https://doi.org/10.1007/s13201-013- 0138-6 CGWB (2008) District groundwater brochure- Sivaganga District, TAMIL NADU, Central Groundwater Board, South Eastern Coastal Region. Chung SY, Venkatramanan S, Kim TH, Kim DS, Ramkumar T (2015) Influence of hydrogeochemical processes and assessment of suitability for groundwater uses in Busan City, Korea. Environment, Development and Sustainability, 17(3), 423–441. https://doi.org/10.1007/s10668-014-9552-7 CPCB (2008) Guideline for water quality management. Central Pollution Control Board, Parivesh Bhawan Doneen LD (1964) Water quality for Agriculture. Department of Irrigation, University of California, Davis, p 48 Gibbs RJ (1970) Mechanisms controlling world’s water chemistry. Science 170:1088–1090 Hem JD (1985) Study and interpretation of the chemical characteristics of natural water, USGS water supply Paper- 2254, p 2641 Islam SMDD, Majumder RK, Uddin MJ, Khalil MI, Ferdous Alam M (2017) Hydrochemical Characteristics and Quality Assessment of Groundwater in Patuakhali District, Southern Coastal Region of Bangladesh. Exposure and Health, 9(1), 43–60. https://doi.org/10.1007/s12403-016-0221-y IUSS Working Group WRB (2015) World Reference Base for Soil Resources 2014, update 2015 International soil classification system for naming soils and creating legends for soil maps. World Soil Resources Reports No. 106. FAO, Rome Kalpana L, Brindha K, Elango L (2019) FIMAR: A new Fluoride Index to mitigate geogenic contamination by Managed Aquifer Recharge. Chemosphere, 220, 381–390. https://doi.org/10.1016/j.chemosphere.2018.12.084 Kelly WP (1940) Permissible composition and concentration of irrigated waters. In: Proceedings of the ASCF66. p. 607 Kumar M, Kumari K, Ramanathan AL, Saxena R (2007) A comparative evaluation of groundwater suitability for irrigation and drinking purposes in two intensively cultivated districts of Punjab, India. Environ Geol 53:553–574. https://doi.org/10.1007/s00254-007-0672-3 Kuttimani R, Raviraj A, Pandian BJ, Kar G (2017) Chemical Science Review and Letters Determination of Water Quality Index in Coastal Area (Nagapattinam) of Tamil Nadu, India. Chem Sci Rev Lett, 6(24), 2208–2221.
Nair IS, Brindha K, Elango L (2021) Assessing the origin and processes controlling groundwater salinization in
coastal aquifers through integrated hydrochemical, isotopic and hydrogeochemical modelling techniques.
Hydrological Sciences Journal, 66(1), 152–164. https://doi.org/10.1080/02626667.2020.1826490
Nazzal Y, Ahmed I, Al-Arifi NSN, Ghrefat H, Zaidi FK, El-Waheidi MM, Batayneh A, Zumlot T (2014) A
pragmatic approach to study the groundwater quality suitability for domestic and agricultural usage, Saq aquifer,
northwest    of      Saudi   Arabia.    Environmental      Monitoring     and     Assessment,     186(8),    4655–4667.
https://doi.org/10.1007/s10661-014-3728-3
Paliwal KV (1972) Irrigation with saline water, Monogram no. 2 (New series). New Delhi, IARI, p 198
Piper AM (1953) A graphic procedure in the geological interpretation of water analysis. Ground water note no. 12,
US Geology Survey Department
Ponsingh BA, Maharani K (2015) A Study on Groundwater Quality and Spatial Distribution of Gandarvakottai
Taluk by Using GIS. The Asian Review of Civil Engineering, 4(1), 36–41. www.trp.org.in
Prabakaran K, Sivakumar K, Aruna C (2020) Use of GIS-AHP tools for potable groundwater potential zone
investigations - a case study in Vairavanpatti rural area, Tamil Nadu, India. Arabian Journal of Geosciences, 13(17),
866. https://doi.org/10.1007/s12517-020-05794-w
Ramachandran A, Sivakumar K, Shanmugasundharam A, Sangunathan, U, Krishnamurthy R (2020) Evaluation of
potable groundwater zones identification based on WQI and GIS techniques in Adyar River basin, Chennai,
Tamilnadu, India. Acta Ecologica Sinica. https://doi.org/10.1016/j.chnaes.2020.02.006
Roy PD, Selvam S, Venkatramanan S, Logesh N, Lakshumanan C, Sánchez-Zavala JL (2021) Identification of
sources and groundwater recharge zones from hydrochemistry and stable isotopes of an agriculture-based paleo-
lacustrine   basin     of    drought-prone    northeast    Mexico.      Geochemistry,     December      2020,    125742.
https://doi.org/10.1016/j.chemer.2021.125742
Saleh A, Al-Ruwaih F, Shehata M (1999) Hydrogeochemical processes operating within the main aquifers of
Kuwait. J Arid Environ 42: 195–209
Sarath Prasanth SV, Magesh NS, Jitheshlal KV, Chandrasekar N, Gangadhar K (2012) Evaluation of groundwater
quality and its suitability for drinking and agricultural use in the coastal stretch of Alappuzha District, Kerala, India.
Appl Water Sci.https://doi.org/10. 1007/s13201-012-0042-5
Selvam S, Jesuraja K, Venkatramanan S, Chidambaram S, Prasanna Mohan V, Sivakumar K (2021) Delineating
saline and fresh water aquifers in Tuticorin of southern India by using geophysical techniques. Environment,
Development and Sustainability, 0123456789. https://doi.org/10.1007/s10668-021-01409-w
Sirajudeen J, Manivel V, Manikandan S (2015) Assessment of physic-chemical parameters and water quality index
of Viralimalai area near Koraiyar river Pudukkottai district, Tamil Nadu, India. Der Chemica Sinica, 6(1), 13–
24.Available online at www.pelagiaresearchlibrary.com
Sivakumar K, Priya J, Muthusamy S, Saravanan P, Jayaprakash M (2016) Spatial Diversity of Major Ionic
Absorptions in Groundwater : Recent study from the Industrial region of Tuticorin, Tamil Nadu, India.
EnviroGeoChimica Acta, 3(1), 138–147. http://www.egcacta.com/AcceptedUpload/160018_20160427213016.PDF
Sivakumar K, Shanmugasundaram A, Jayaprakash M, Prabakaran K, Muthusamy S, Ramachandran A,
Venkatramanan S, Selvam S (2021) Causes of heavy metal contamination in groundwater of Tuticorin industrial
block,   Tamil   Nadu,   India.   Environmental    Science   and     Pollution   Research,   28(15),   18651–18666.
https://doi.org/10.1007/s11356-020-11704-0
Srinivasamoorthy K, Gopinath M, Chidambaram S, Vasanthavigar M, Sarma VS (2014) Hydrochemical
characterization and quality appraisal of groundwater from Pungar sub basin, Tamilnadu, India. Journal of King
Saud University - Science, 26(1), 37–52. https://doi.org/10.1016/j.jksus.2013.08.001
Subba Rao N, Surya Rao P, Venktram Reddy G, Nagamani M, Vidyasagar G, Sathyanarayana NLVV (2011)
Chemical characteristics of groundwater and assessment of water quality in Varaha River Basin, Visakhapatnam
District, Andhra Pradesh, India. Environ Monit Assess. https://doi.org/10.1007/s10667-011-2333-y
Sundaray SK, Nayak BB, Bhatta D (2009) Environmental studies on river water quality with reference to suitability
for agricultural purposes: Mahanadi river estuarine system, India—a case study. Environ Monit Assess 155:227–243
Tindall JA, Petrusak RL, McMohan PB (1995) Nitrate transport and transformation process in unsaturated porous
media. J Hydrol 169:51–94
Todd DK (1980) Groundwater hydrology, 2nd edn. John Wiley and Sons, New York, p 535
Venkatramanan S, Chung SY, Ramkumar T, Rajesh R, Gnanachandrasamy G (2016) Assessment of groundwater
quality using GIS and CCME WQI techniques: a case study of Thiruthuraipoondi city in Cauvery deltaic region,
Tamil      Nadu,      India.      Desalination      and      Water       Treatment,      57(26),       12058–12073.
https://doi.org/10.1080/19443994.2015.1048740
WHO (2008) Guidelines for drinking water quality. vol 1. Recommendations, 3rd edn. WHO, Geneva, p 515
Wilcox LV (1955) Classification and Use of Irrigation Waters. USDA, Washington, DC, USA Circular 969.
Figures

Figure 1

The map shows the study area and sample location Note: The designations employed and the
presentation of the material on this map do not imply the expression of any opinion whatsoever on the
part of Research Square concerning the legal status of any country, territory, city or area or of its
authorities, or concerning the delimitation of its frontiers or boundaries. This map has been provided by
the authors.
Figure 2

Spatial distribution map shows the TDS with major ions as pie chart Note: The designations employed
and the presentation of the material on this map do not imply the expression of any opinion whatsoever
on the part of Research Square concerning the legal status of any country, territory, city or area or of its
authorities, or concerning the delimitation of its frontiers or boundaries. This map has been provided by
the authors.
Figure 3

Piper plot for both seasons with spatial distribution maps of hydrological facies Note: The designations
employed and the presentation of the material on this map do not imply the expression of any opinion
whatsoever on the part of Research Square concerning the legal status of any country, territory, city or
area or of its authorities, or concerning the delimitation of its frontiers or boundaries. This map has been
provided by the authors.
Figure 4

Gibb’s plot for both seasons with spatial distribution map of in uencing factors Note: The designations
employed and the presentation of the material on this map do not imply the expression of any opinion
whatsoever on the part of Research Square concerning the legal status of any country, territory, city or
area or of its authorities, or concerning the delimitation of its frontiers or boundaries. This map has been
provided by the authors.
Figure 5

Na% vs. EC plot for both seasons with irrigation suitability map Note: The designations employed and the
presentation of the material on this map do not imply the expression of any opinion whatsoever on the
part of Research Square concerning the legal status of any country, territory, city or area or of its
authorities, or concerning the delimitation of its frontiers or boundaries. This map has been provided by
the authors.
Figure 6

USSL plot for both seasons with spatial distribution map classes
Figure 7

Doneen’s PI plot for both seasons with spatial distribution map of classes Note: The designations
employed and the presentation of the material on this map do not imply the expression of any opinion
whatsoever on the part of Research Square concerning the legal status of any country, territory, city or
area or of its authorities, or concerning the delimitation of its frontiers or boundaries. This map has been
provided by the authors.
Figure 8

Spatial distribution maps of calculated DWQI & IRWQI for both seasons Note: The designations employed
and the presentation of the material on this map do not imply the expression of any opinion whatsoever
on the part of Research Square concerning the legal status of any country, territory, city or area or of its
authorities, or concerning the delimitation of its frontiers or boundaries. This map has been provided by
the authors.
You can also read