INTEGRATION OF NDVI IMAGERY AND CROP COVERAGE REGISTRATION SYSTEM FOR APIARY SCHEDULE - Sciendo
←
→
Page content transcription
If your browser does not render page correctly, please read the page content below
DOI: 10.2478/JAS-2020-0011 J. APIC. SCI. VOL. 64 NO. 1 2020
                                                        J. APIC. SCI. Vol. 64 No. 1 2020
    Original Article

INTEGRATION OF NDVI IMAGERY AND CROP COVERAGE
REGISTRATION SYSTEM FOR APIARY SCHEDULE
    Fatih Sari1*
    İrfan Kandemіr2
    Durmuş A. Ceylan1
    1
     Selçuk University, Konya, Turkey
    2
     Ankara University, Ankara, Turkey
    *corresponding author: fatihsari@selcuk.edu.tr
    Received: 06 September 2019; accepted: 05 March 2020

                                                    Abstract
            Beekeepers need to establish migratory apiaries to benefit from pollen and nectar source
            plants as in order to increase honey yield. Thus, following the flowering seasons of honey
            source plants has vital importance when deciding the route of migration. In this study,
            MODIS imagery was used to generate weekly NDVI data between 1st April to 31st Au-
            gust 2018, when beekeeping activities start and end in the study area. Although MODIS
            images have high temporal resolution, low spatial resolution (250 meters) makes them
            insufficient when deciding the crop types and plants. While detecting plants in natu-
            ral plant areas requires high spatial resolution NDVI, Crop Coverage Registration System
            (CCRS) parcel-based crop coverage records can enrich the NDVI data without increasing
            spatial resolution in agricultural lands. Thus, the CCRS data were integrated with NDVI
            images for migratory beekeeping in agricultural areas as an innovation. To generate both
            high temporal and spatial resolution, NDVI and CCRS data were integrated together with
            a beekeeping suitability map to generate the apiary schedule. The results were veri-
            fied with 176 existing apiary locations and production dates retrieved from field studies
            which revealed the existence of three seasons in the study area as early and late apiaries
            (in natural plant areas) and apiaries in agricultural lands. Accuracy analysis showed that
            82% of the apiaries intersected with suitable locations and that apiaries in agricultural
            areas were detected five days earlier than in field studies and obtained more accurately
            than natural plant apiaries.

            Keywords: Apiary Schedule, Geographical Information Systems, Multi Criteria Decision
            Analysis, Site Suitability Analysis

INTRODUCTION                                               al., 2008; Landmann et al., 2015; Adgaba et al.,
                                                           2017). There are several sources to generate
Beekeeping activities contribute to rural                  NDVI data, including NASA Moderate Resolution
economic development thanks to bee products                Imaging Spectroradiometer (MODIS), the NOAA
and the pollination of about 33% of crop species           Advanced Very High Resolution Radiometer
(Estoque & Murayama, 2010, 2011; Damián,                   (AVHRR) and the Copernicus Sentinel-2 satellite
2016). Due to this importance, unaccounted                 systems. NDVI usage for monitoring landscape
income is gained with increased of agricultural            changes have been studied by Myneni et al.
crop yield (Oldroyd & Nanork, 2009; Maris et al.,          (1997), Zhou et al. (2001), Heumann et al.
2008). Increasing the honey yield from beehives            (2007), Karlsen et al. (2008) and Lange et al.
requires predicting and detecting the suitable             (2017). In this context, the Moderate Resolution
floral resources and suitable apiary locations             Imaging Spectroradiometer (MODIS) vegetation
within an apiary schedule concept. Normalized              index is a frequently used NDVI source in
Difference Vegetation Index (NDVI) images                  phenology studies (Beck et al., 2006; Fontana
are the most commonly used data sources to                 et al., 2008; Bian et al., 2010; Schmidt et al.,
detect zones covered by plants and can be                  2012; Ahmad, 2013; Eckert et al., 2015; Arundel
used to determine apiary locations (Jarlan et              et al., 2016). However, detecting pollen-nec-
                                                                                                         105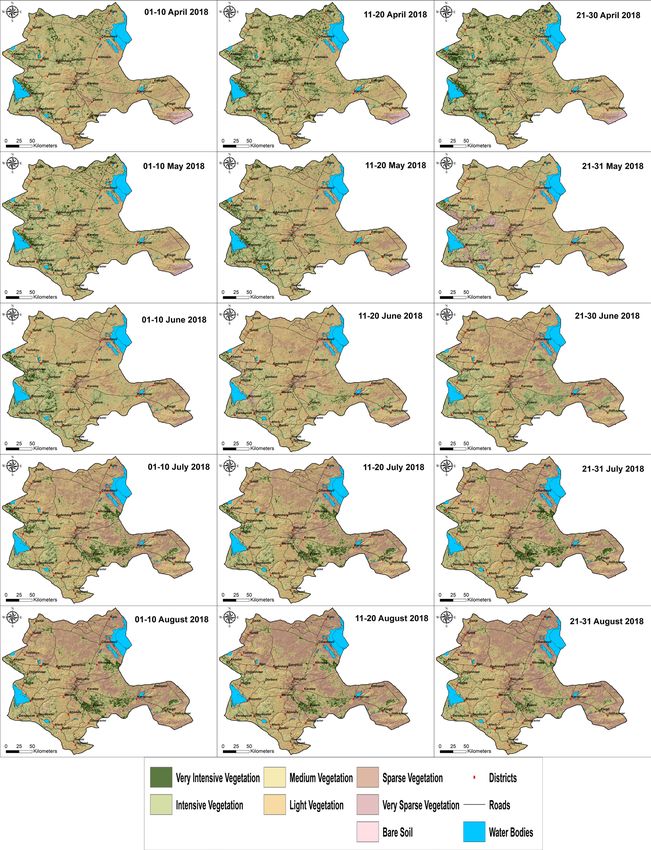
Sari et AL.                  Apıary schedule generatıon for mıgratory apıarıes

tar sources and the ecological distribution of           requires high temporal resolution due to the
plants to determine the location of apiaries is a        short-lived plants and fast-growing agricultural
complex process without any field studies. Dif-          crops. This disadvantage is avoidable through
ferentiating honey bee plants is difficult within        the usage of local spatial datasets or field
the temporal vegetation phenology concept due            studies to enrich NDVI data.
to the spatial and temporal resolutions of the           In this context, the Crop Coverage Registration
NDVI images.                                             System (CCRS) includes all parcels and related
Although the recent studies are performed t for          crop information for every year and is used in
different purposes, the main problems about              this study to specify the crops on which honey
NDVI data sources are the same (Arundel et al.,          bees can be located. The CCRS was established
2016). The temporal and spatial resolutions of           in 2005 by the Republic of Turkey Ministry of
the satellite systems are the main phenomena             Agriculture and Forestry for monitoring crops
when determining the NDVI sources. While                 and regulation of agricultural incentives. In
MODIS and AHVRR have low spatial resolution              addition to this, its aim is monitoring the crops
(250 meters and 1 km, respectively), these               in all stages from cultivation to end-user. The
satellites have very high temporal resolution            CCRS is a spatial database based on parcels,
(daily). Low spatial resolution is revealed in mixed     and a large number of attribute data are
pixels, such as forest and grassland borders, and        related to the parcels which are actively used.
in agricultural lands near forests (Arundel et al.,      Irrigation, fertilization and pesticide informa-
2016). This problem can be solved through the            tion are included in addition to crop data, and
use of Sentinel-2 images with their high spatial         the records are updated each year. Turkey has
resolution (10-20 meters). However, especially           a high amount of migratory beekeeping activity,
for apiaries, flowering schedule determination           so a knowledge of the crop texture before
                                                                                                        Table 1.
                            Recent studies on beekeeping suitability and criteria

              Criteria                                         Recent Studies
                                    Maris et al., (2008); Estaque & Murayama, (2010); Amiri & Shariff,
             Elevation
                                              (2012); Camargo et al., (2014); Zoccali et al., (2017);
                                    Estaque & Murayama, (2010); Amiri & Shariff, (2012); Abou-Shaara
              Land use             et al., (2013); Camargo et al., (2014); Femandez et al., (2016); Zoccali
                                                                et al., (2017);
                                    Maris et al., (2008); Estaque & Murayama, (2010); Amiri & Shariff,
          Water Resources                (2012); Abou-Shaara et al., (2013); Camargo et al., (2014);
                                                 Femandez et al., (2016); Zoccali et al., (2017);
                                     Maris et al. (2008); Estaque & Murayama (2010); Amiri & Shariff,
           Road Network
                                             (2012); Femandez et al., (2016); Zoccali et al., (2017)
                                    Amiri & Shariff, (2012); Abou-Shaara et al., (2013); Camargo et al.,
            Temperature
                                                         (2014); Zoccali et al., (2017)
              Humidity                         Abou-Shaara et al., (2013); (Camargo et al., 2014)
                                      Amiri & Shariff, (2012); Camargo et al., (2014); Femandez et al.,
            Precipitation
                                                                     (2016);
       Nectar and Pollen Class                               Maris et al., (2008)
           Summer Crops                                   Abou-Shaara et al., (2013)
          Solar Radiation                                  Femandez et al., (2016)
          Electromagnetic
                                                          Femandez et al., (2016)
             Radiation

 106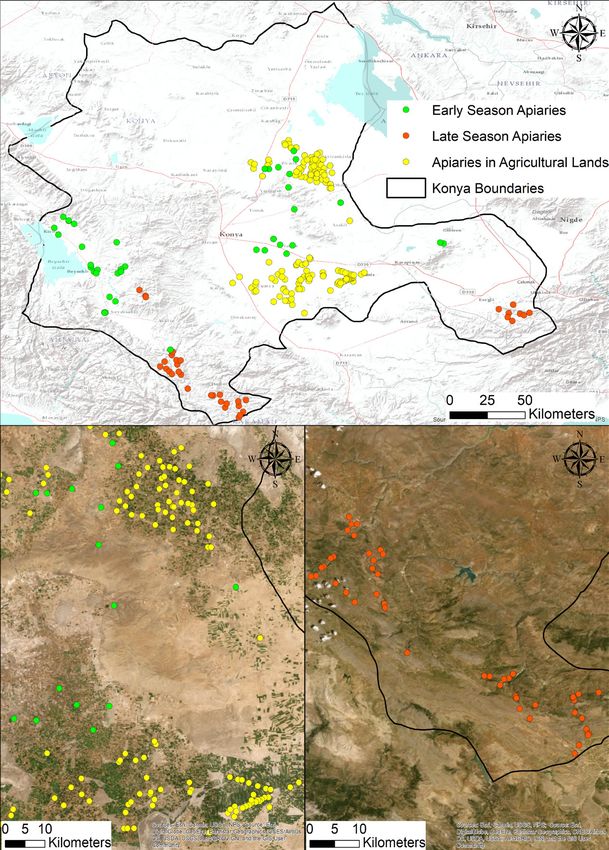
J. APIC. SCI. Vol. 64 No. 1 2020
the beekeeping season is of vital importance        studies on the beekeeping suitability analysis
to predict and increase the honey yield and to      concept which use MCDA techniques. Those
guide the migratory beekeepers as to where to       that include criteria for beekeeping suitability
locate their apiaries.                              are given in Tab. 1.
Moreover, crop information gives valuable infor-    Aspect, slope, elevation, flora, water resources,
mation about the flowering schedule of a region.    roads, settlements, precipitation, buildings,
Although the CCRS includes crop planting and        railroads, power lines and natural disaster
harvesting dates, these data are not recorded       areas have been included in previous studies as
accurately through land observation but are         criteria to generate beekeeping suitability maps.
enough to predict the flowering schedule with       The resultant maps were then overlapped with
the integration of NDVI data for apiaries. The      NDVI and CCRS integration to generate apiary
integration of high temporal resolution NDVI        schedules. The novelty of this study is the in-
imagery and CCRS records can generate a useful      tegration of suitable apiary locations, NDVI
infrastructure for the apiary schedule. The         imagery and CCRS records instead of using only
growth of the plants can be specified through       NDVI imagery as in recent studies. The main aim
NDVI images and crop types through CCRS             of this study is to generate an apiary schedule
records which refer to the honey production date    to be able to determine honey production dates
interval. This time interval will be mentioned as   within the beekeeping suitability concept and
the apiary establishment duration, which starts     to detect the seasons of the study area in
from locating hives in a location and ends when     both natural plant areas and agricultural lands.
moving to another location.                         The resultant maps guide both beekeepers
At this point, the beekeeping suitability concept   and authorized institutions in monitoring and
can be integrated into both NDVI and CCRS           managing beekeeping activities and establishing
data to limit the apiary establishment to only      a conceptual model for an apiary schedule and
suitable areas. This approach enables both          migration route determination.
the generation of apiary establishment only
in suitable areas and the exclusion of green        MATERIAL AND METHODS
areas which are unsuitable for beekeeping. The
suitable areas can be defined via Multi-Criteria    Study Area
Decision Analysis (MCDA), since a large number      The study was carried out in Turkey’s province
of criteria affect beekeeping activities. In the    of Konya (38,873 km2) including its thirty-one
MCDA concept, the Analytical Hierarchy Process      districts (Fig. 1). The study area is located
(AHP), one of the most commonly applied             between latitudes 36°41’59.6” and 39°16’03.6”,
methods, determines the importance of each          and longitudes 31°14’18.0” and 34°25’37.3”.
criterion among the factors that determine suit-    The altitude of the city is 1020 meters above
ability (Saaty, 1977; 1980; 1994; 2001; Saaty       sea level and the area has high mountains
& Vargas, 1991). The AHP includes the calcu-        over 3000 meters. Because the topography of
lations used to determine
the best solutions for the
specified problem among
multiple          alternatives
(Arentze & Timmermans,
2000) and determines the
weights with a pairwise
comparison matrix in which
the importance of all criteria
is compared (Chen et al.,
2010). There are quite a few
                                Fig. 1. The boundaries of the study area (Konya province).

                                                                                                  107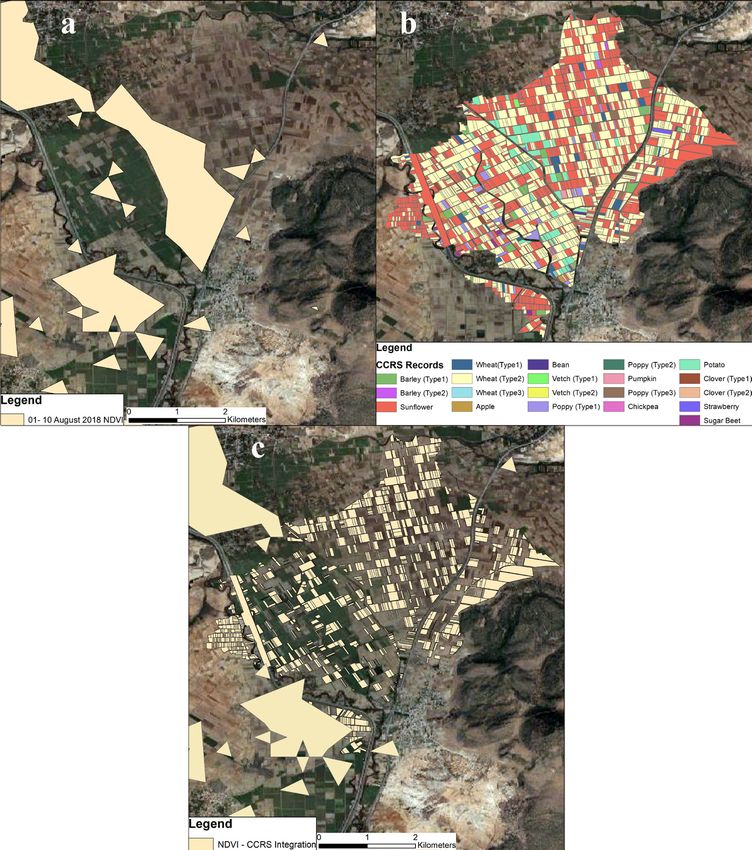
Sari et AL.              Apıary schedule generatıon for mıgratory apıarıes

Konya includes both high mountains and plains      values close to zero refer to non-vegetated
with valuable agricultural lands, it provides a    areas (Hall et al., 2002).
good conceptual model for an apiary schedule.
Additionally, Konya has the largest agricultural
lands in Turkey where much agricultural activity   					(1)
is conducted, and natural plant and agricultural
apiary activities which enhance apiary schedule   The MODIS images were retrieved over a 10-day
application can be determined. The study area     period and the NDVI data (Fig. 3) were generated
is one of the largest mono-floral honey regions   by using ArcGIS 10.5 software.
in Turkey and this characteristic enables a more  In addition, parcel-based CCRS records were
accurate apiary schedule to be made.              retrieved for the study area to generate a
                                                  crop type map. For the purpose of defining
Methodology                                       the boundaries of the apiary schedule, the
Generating apiary schedule maps requires beekeeping suitability areas are used to
including suitable locations for beekeeping, determine suitability for apiaries and date
NDVI images, CCRS records, criteria specification interval. This is because every green area in the
and verification of apiary schedule stages. The NDVI images might not refer to suitable locations
implementation model of the study is shown in and similar to this, every non-planted area might
Fig. 2.                                           not refer to unsuitable locations, such as agri-
                                                                         cultural areas for foraging,
                                                                         and excluding unsuitable
                                                                         locations from the apiary
                                                                         schedule provides a more
                                                                         detailed     and     precise
                                                                         schedule map.
                                                                         The criteria used to
                                                                         generate beekeeping suit-
                                                                         ability maps were specified
                                                                         by      considering     the
                                                                         beekeeping requirements
                                                                         in the field of topographic,
                                                                         climatic and environmental
                                                                         perspectives and twelve
                                                                         criteria were specified and
                                                                         included in the suitability
                                                                         analyses.

Fig. 2. The implementation model of the apiary     Topographic Criteria
schedule.                                          Elevation, aspect and slope criteria were
                                                   included in the suitability analysis according to
Datasets of the Model                              previous studies by Maris et al. (2008); Estoque
Generating apiary schedules requires NDVI maps & Murayama (2010); Amiri & Shariff (2012);
and CCRS records along with criteria maps for Abou-Shaara et al. (2013); Camargo et al. (2014);
beekeeping suitability analysis. In total, fifteen Fernandez et al. (2016) and Zoccali et al. (2017).
NDVI maps were derived from MODIS images. Slope and aspect data were derived from ASTER
NDVI calculation has a simple formula that uses GDEM elevation data at thirty -meter resolution
near-infrared radiation and visible radiation (Eq. via spatial analyst tools in ArcGIS 10.5 software.
1). The results range between +1 and -1, where

 108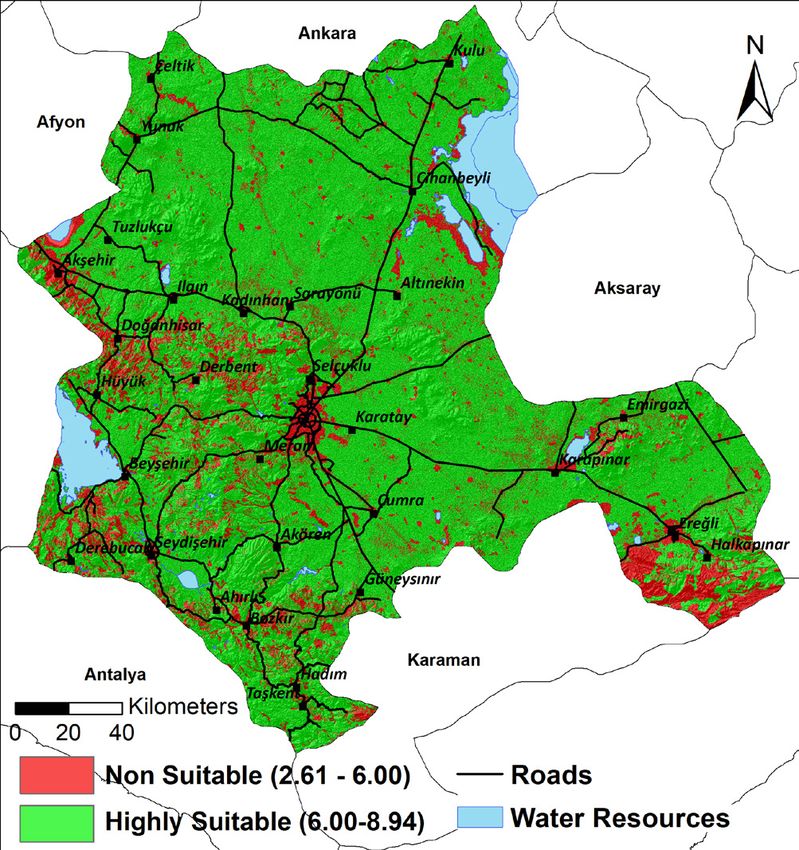
J. APIC. SCI. Vol. 64 No. 1 2020

Fig. 3. NDVI images from 1st April to 31st August.
Climatic Criteria                                    the precipitation map was generated through
Precipitation was included in the suitability        density analysis in ArcGIS 10.5 software.
analysis according to Amiri & Shariff (2012),
Camargo et al. (2014) and Fernandez et al.           Physical Environmental Criteria
(2016) due to the importance of this parameter       Physical environmental factors such as roads,
for beekeeping. The precipitation rate is            railways, buildings, settlements and power lines
expected to be between 1275 and 1800 mm              indirectly affect beekeeping activities. Locations
annual rainfall to ensure optimal beekeeping         close to these zones have disadvantages for
(FAO, 1976; Maris et al., 2008). The precipitation   beekeeping, as human-related pollution, air
data were retrieved from the database of the         and noise pollution, greenhouse gases, exhaust
Turkish State Meteorological Service Institute       emissions and intensive traffic flow negatively
observation stations. In total, the precipitation    affect both flora and beekeeping activities.
data of ten observation stations were used and       Thus, these criteria were included in the suita-

                                                                                                  109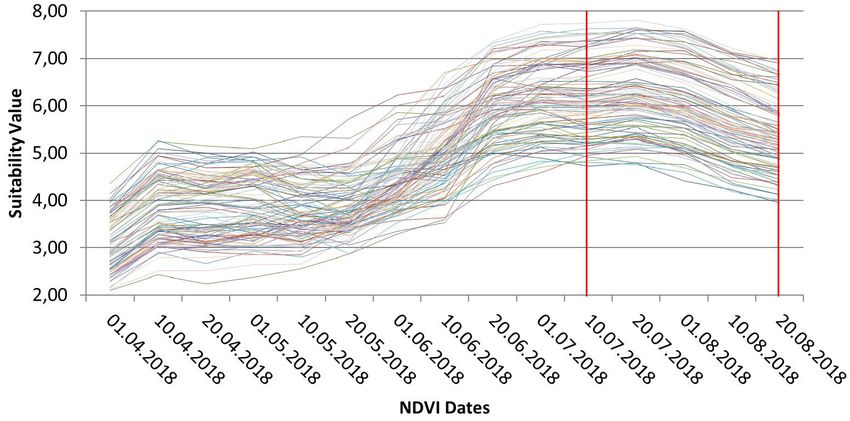
Sari et AL.               Apıary schedule generatıon for mıgratory apıarıes

bility analysis to consider and avoid the negative    the agricultural lands because most of the
effects of artificial structures. The criteria data   migratory apiaries are located in agricultural
were retrieved from the Open Street Database          lands for clover, sunflower and sainfoin. Urban
in vector format and converted to buffer zones        settlements and industrial areas were not
to determine the effect zones via spatial analyst     included to avoid the disadvantages and adverse
tools in ArcGIS 10.5 software.                        effects of urbanization on honey production.
Water resources are also important for supplying      The flora map was derived from CORINE 2018
water to apiaries and for the richness of flora.      land cover data and classified according to the
The study area has 2127 square-meter water            land use type considering beekeeping require-
resources and can provide clean water for             ments. Because biodiversity and flower data
apiaries. Natural disasters indicate the locations    are unavailable for the study area, land use map
that are a threat to apiaries. Areas with a high      classifications were used in this study.
potential for floods, sinkholes and landslides
were included in this criterion to avoid loss of  Analytical Hierarchy Process (AHP) and
or damage to apiaries. The natural disaster       Beekeeping Suitability Map
data were retrieved from the Ministry of the      The Analytic Hierarchy Process (AHP), proposed
Interior’s Disaster and Emergency Management      by Saaty (1977; 1980), is a complex decision-
Presidency in vector format and converted to      making tool that considers the importance of
buffer zones in ArcGIS 10.5 software.             each criterion. For this purpose, the AHP estab-
                                                  lishes an importance scale from 1 to 9 (1=Equal,
The Bee Flora Criteria                            3=Moderate, 5=Strong, 7=Very Strong,
The flora criterion is of vital importance for 9=Extreme). The AHP is based on a normalized
beekeeping activities. The flora are the decisive matrix and calculates weights with an average
factor of pollen resources and define the pro- sum of the normalized matrix. Moreover, the
ductivity and yield. This criterion also includes AHP provides a consistency rate concept to
                                                                                                     Table 2.
                               Beekeeping suitability pairwise matrix

          Criteria   AS   EL SL FL DtW        DtR DtS DtP DtB             DtRI   PR  ND Weight
            AS       1    2 2,7 0,3 1,1        4   4 2,5 2,5               4      3   3  0,129
            EL            1   1,1 0,2   0,5    2      2     1,1   1,1      2     1,5 1,5 0,063
            SL                1   0,2   0,3    1,2    1,2   1     1       1,2    1,1 1,2     0,048
            FL                     1    3,5    9      9     8     8        8     7     8     0,339
           DtW                           1     4      4,2   3     3       4,2    3     2,8   0,133
            DtR                                1      1     0,8   0,8      1     0,9 0,8     0,036
            DtS                                       1     0,8   0,8      1     0,9 0,7     0,035
            DtP                                             1     1       1,6    1,1 1,2     0,048
            DtB                                                   1       1,4    1,1   1,1   0,047
           DtRI                                                            1     0,9 0,7     0,035
            PR                                                                   1     0,8   0,042
            ND                                                                         1     0,045
                                                   (CR=0,081)     Total     1.0000

(AS: Aspect, EL: Elevation, SL: Slope, FL: Flora, DtW: Distance to Waters, DtR: Distance to Roads, DtP:
Distance to Powerlines, DtB: Distance to Buildings, DtRI: Distance to Railways, PR: Precipitation, ND:
Natural Disasters)

 110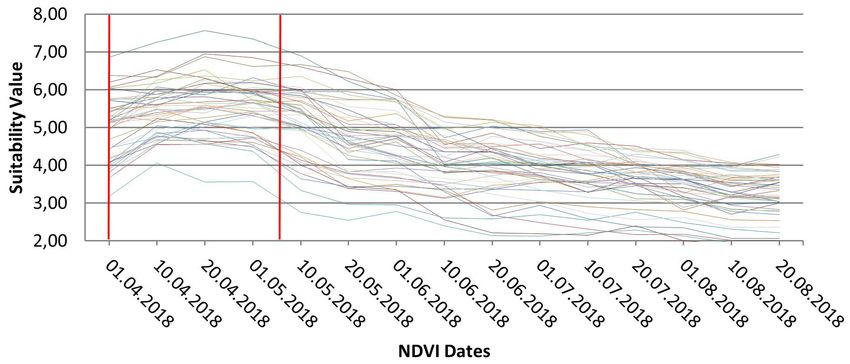
J. APIC. SCI. Vol. 64 No. 1 2020
be able to calculate the consistency of overall      The CR of the comparison matrix was calculated
weights and priorities (Saaty, 1994). Finally, the   as 0.081, which means that the weight calcula-
consistency ratio (CR) is calculated, which should   tion is consistent. Due to the high importance
be less than 0.1 to prove that the weights and       of the criteria of flora and distance to water
priorities are consistent (Saaty & Vargas, 1991).    resources, the weights were calculated as
The AHP method was used to generate the              34% and 13%. After weight calculation, the
final suitability map for beekeeping in the study    Beekeeping Suitability (BS) map was generated
area.		                                              by the contribution of each criterion with
Beekeeping suitability map generation requires       its weight. The BS was calculated with the
determining the weights of each criterion via        following equation:
the AHP method with a comparison matrix. The
importance of each criterion and preference          Integration of NDVI and CCRS Records
values were specified considering previous           In the CCRS records, all the parcels with sunflower
studies in literature and the decisions of thirty    crops were exported as a new layer. These
expert beekeepers located in the study area.         parcels were then intersected with all NDVI
The preference values are given to the criteria      images and merged. The result data included
considering the importance (from 1 to 9) of each     both planted areas outside agricultural lands
criterion compared to another. The comparison        and sunflower-harvested agricultural lands. A
matrix and preference values are given in Tab. 2.    sample result of the NDVI and CCRS record map
                                                                              for 1st - 10th August is
                                                                              given in Fig. 4.

                                                                            Field Studies
                                                                            Field studies included
                                                                            both specifying apiary
                                                                            location coordinates and
                                                                            apiary      establishment
                                                                            dates, which refer to the
                                                                            beginning (when they are
                                                                            located) and end (when
                                                                            they are left) of the
                                                                            apiaries to verify both
                                                                            the suitability and apiary
                                                                            schedule. In total, 176
                                                                            apiary location coordi-
                                                                            nates were collected and
                                                                            apiary production dates
                                                                            were recorded. Consider-
                                                                            ing the apiary production
                                                                            dates, three clusters were
                                                                            detected, which refer
                                                                            to the three different
                                                                            seasons.      The    dates
                                                                            revealed that eighty of
                                                                            the apiaries were located
                                                                            in natural plant areas and
                                                                            ninety-six of the apiaries
Fig. 4. a-) 01-10 August 2018 NDVI Imagery b-) CCRS crop type map c-) Inte- were located in agricul-
gration of CCRS and NDVI data (Apiary Schedule).                             tural lands. Moreover,

                                                                                                   111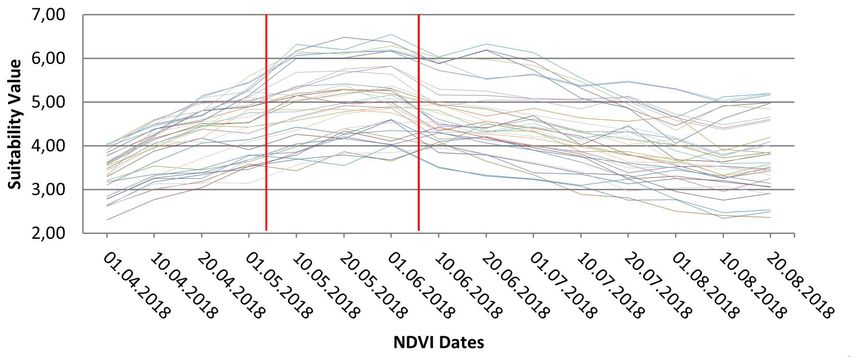
Sari et AL.                   Apıary schedule generatıon for mıgratory apıarıes

                                                                                                        Table 3.
                               Field study results for a sample 5 of 176 apiaries

   Apiary Name       Latitude       Longitude    Hive Count   Location    Begin Date   End Date    Honey Type
        A1          32,86913       38,338409        50         Hüyük        3 April     10 May      Highland
       A25          33,084416      38,181350        30        Gevrekli      5 April     16 May      Highland
       A52          33,058012      38,308402        100       Karapınar    11 July     27 August   Sunflower
        …                  …           …             …           …            …           …            …
       A102         32,88018       38,177285        15        Altınekin     9 July     23 August   Sunflower
       A148         32,677932      38,339811        35         Bozkır       8 May       13 June     Highland

in natural plant areas, the existence of two       which honey bees each within a three-kilome-
seasons was revealed with forty-five apiaries      tre buffer zone. Although the forage area gives
in early season and thirty-five apiaries in late   valuable information about the suitability and
season. The average beginning and end of the       reliability of the apiary schedule, it is also the
apiaries were calculated for each cluster. The     most appropriate data to prove the schedule’s
records of five apiaries as a random sample out    accuracy. Thus, three-kilometre buffer zones
of 176 apiaries are given in Tab. 3. The dates     were determined for each of the 176 apiary
retrieved from the field studies also represent    locations, and zonal statistics were calculated
the flowering dates, when the beekeepers           to determine the total vegetation availability
locate their apiaries.                             within all honey season dates for each buffer
                                                   zone. Every pixel of the resultant NDVI maps
Verification of the Results                        was counted and summarized with a mean
The apiary schedule are verified by comparing value to compare each buffer zone to another.
the flowering season retrieved from field studies The results for three apiary schedule zones
and the existing apiary locations. Existing apiary were evaluated by comparing forage zone
locations are accepted as suitable because the statistics and date intervals retrieved from the
beekeepers have decided on the locations after field studies. The mean values were converted
a long period of experience.                       to the 1-to-9 scale in which 9 represented the
The apiary schedule is verified with zonal most intensive planted forage zones and 1 the
statistics by determining the vegetation index non-planted forage zones (Fig. 5).

Fig. 5. Zonal statistics of forage zones.

 112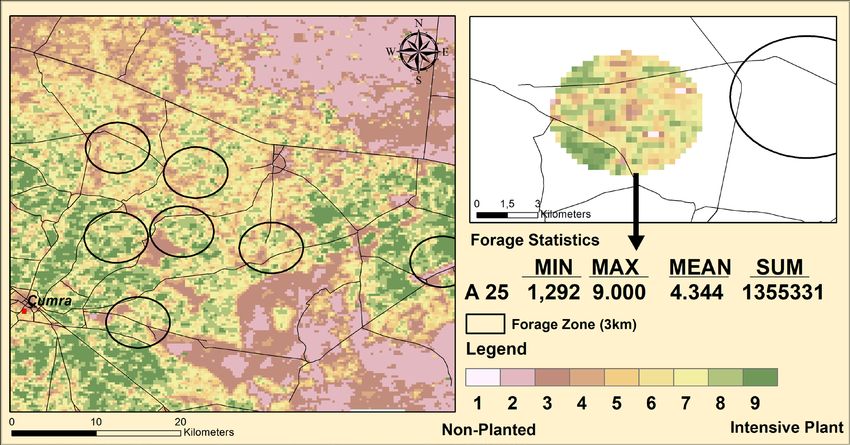
J. APIC. SCI. Vol. 64 No. 1 2020
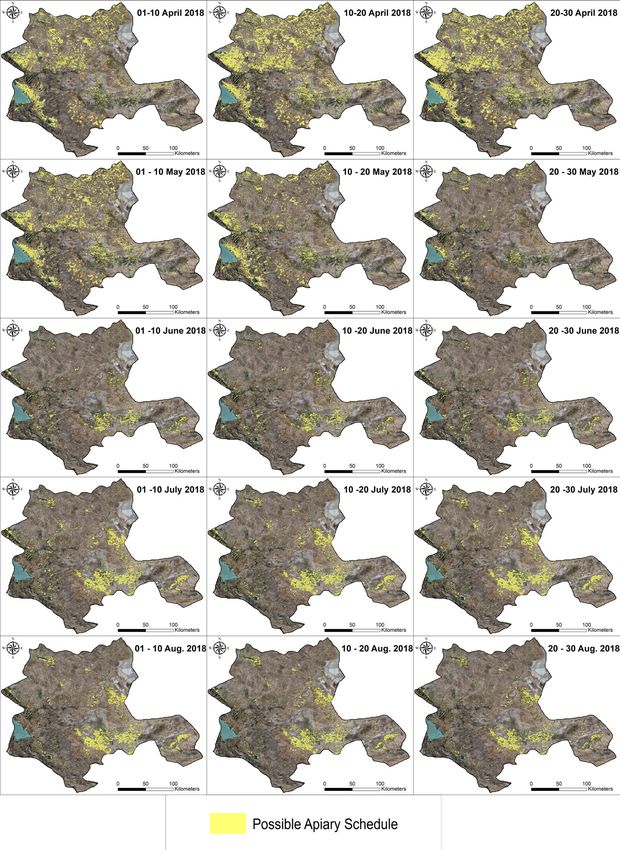
RESULTS intersected with the suitability map, and non-
suitable areas were excluded from the apiary
Suitability map for beekeeping in the study schedule. Thus, the generated apiary schedule
area maps refer to the suitable and high-inten-
The results indicated that 10.8% and 42.5% sive planted crop lands which can be used for
of the study areas were determined as beekeeping activities (Fig. 7).
highly suitable and suitable, respectively, for The apiary schedule map revealed the presence
beekeeping activities. A large percentage of the of two main zones which vary distinctly by
highly suitable areas included agricultural lands. seasons. The first season is for natural floral
Approximately 60% of the suitability specified areas and the second season is for agricultural
was accounted for by the high weight values crop areas. The first season, the earliest season
of the flora, distance to water resources and of the study area, starts on 1st April and ends on
aspect. The beekeeping suitability map of the 10th May and covers the vicinity of Lake Beyşehir
study area is shown in Fig. 6. in the west of the study area due to the warmer
climate of the region. Lake Eğirdir, which is not
included in the study area but is quite close to
Lake Beyşehir, also affects the warmer climate
and early season of the region. The region has
a large number of natural floral areas and large
moors located between lakes and mountains.
The latest season of the study area starts on
1st July and ends on 30th August and covers the
agricultural lands and represents the sunflower
honey production in the southeast of the study
area and south of Salt Lake. This region has the
largest sunflower cultivation and most valuable
agricultural lands in the study area and includes
migratory apiary locations. The topography of
the region is in the form of a plain and has very
intensive agricultural activities.
According to the field studies, the average dates
revealed that ninety-six of the apiary locations
were located in agricultural lands for sunflower
and eighty in natural floral areas (Tab. 4).
Fig. 6. Beekeeping suitability map.
On the other hand, eighty apiary locations were
clustered in two groups as early and late seasons,
Apiary schedule map for the active season of which forty-five apiaries were located in ear-
All the NDVI and CCRS combination maps were ly-season regions and thirty-five in late season
Table 4.
Average season start and end dates retrieved from field studies
Average Average
Region Apiaries
Start Date End Date
Early Season Apiaries Beyşehir, Seydişehir, Bozkır 6 April 12 May 45
Late Season Apiaries Hadim, Taşkent 3 May 27 May 35
Apiaries at Agricultural
Çumra, Karapınar, Altınekin 8 June 24 August 96
Lands
113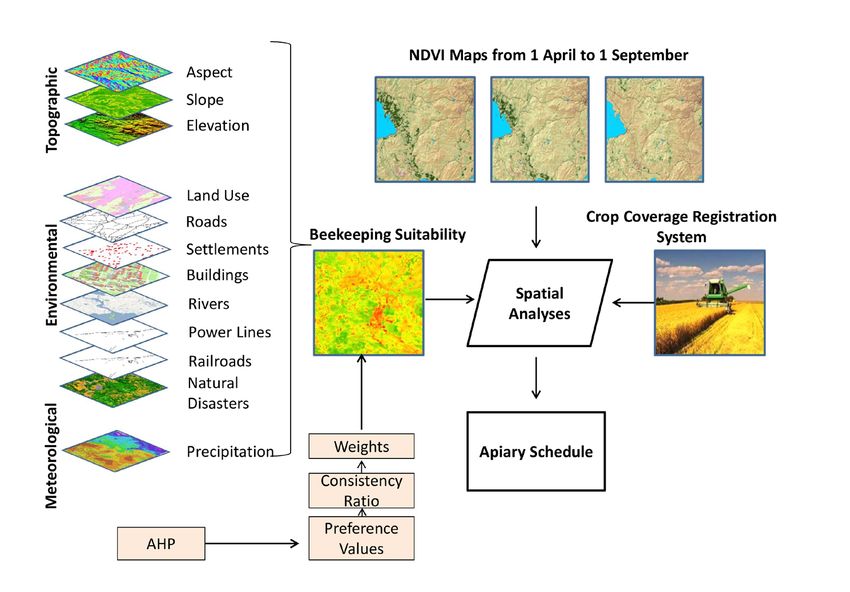
Sari et AL.                Apıary schedule generatıon for mıgratory apıarıes

Fig. 7. Determined apiary schedules from 1st April to 31st August.
regions. The apiary locations according to the          and end dates (red lines) were determined as
groups are given in Fig. 8.                             6th April and 12th May, which represents a good
                                                        overlap (Fig. 9).
Apiary schedule map for early season
Early season apiaries were clustered into three         Apiary schedule map for late season
groups and located on plains. The average               Late season apiaries were clustered into two
elevation of the apiaries varies from 1018              groups and located mostly in mountainous areas.
meters above sea level to 1046 meters, where            The average elevation of the apiaries varies
the climatic and topographic conditions can be          between 1158 and 1346 meters, where climatic
accepted as similar. The plant density values           and topographic conditions are quite different
vary from minimum 2.0 to maximum 7.58 in                compared to the other apiary locations. Due to
the forage zone statistics. For the forage zone         the climatic conditions in higher elevations, the
statistics, the maximum plant density started           flowering seasons of the plants start later than
on 10th April and continued until the 10th May.         in lower elevations. The difference in elevation
For the field study results, the average start          leads to the constitution of a second season,

 114
J. APIC. SCI. Vol. 64 No. 1 2020
Fig. 8. Existing apiary locations and their clusters.
Fig. 9. NDVI graphics for early season apiaries.
115Sari et AL. Apıary schedule generatıon for mıgratory apıarıes
Fig. 10. NDVI graphics for late season apiaries.
which is an advantage for beekeepers. The Karapınar districts and thirty-eight in the
plant density values vary from minimum 2.3 andAltınekin district. These regions have similar
maximum 6.4 in the forage zone statistics. An the topography and climatic conditions and the
evaluation the forage zone statistics shows that
same agricultural crops. Plant density varies
the maximum flowering plant density started onfrom minimum 2.1 to maximum 7.82 within the
20th May and continued until 20th June (Fig. 10).
apiary schedule. The graphics revealed that
The field study results show that the average the maximum plant density started on 1st July
start and end dates were determined as 10th and started to decrease on 20th August. The
May and 10th June, which represents a weaker field study results show that average start and
overlap than for the early season. end dates were determined as 8th July and 24th
August. The plant density and apiary schedules
Apiary schedule map for agricultural crops are given in Fig. 11. The red lines represent the
In total, ninety-six apiaries were located in start and end times of the season which were
agricultural zones within two main clusters, retrieved from the field studies.
fifty-two of them were located in the Çumra-
Fig. 11. NDVI graphics of apiaries in agricultural lands.
116J. APIC. SCI. Vol. 64 No. 1 2020
Fig. 12. Distribution of apiaries according to suitability values corresponding to their geographical locations,
considering the value 6 as the suitability threshold (The blue line represents the average suitability value
of 176 beekeeping locations).
Verification of Apiary Schedule As a result, all the field studies and determined
The apiary locations and suitability values were apiary schedule dates are given together in Fig.
examined to verify the suitability map, and the 13. The most suitable results were obtained
results showed that fourteen apiary locations for apiaries in agricultural lands via integrated
intersected with low suitability and forty-two CCRS records with regard to the increased
apiary locations intersected with highly suitable resolution of NDVI images in agricultural lands.
locations. Thus, 144 of the existing beekeeping For the evaluation of natural plant apiaries,
areas intersected with suitability values higher the early season apiaries were determined
than 6 and provided 82% intersection with one week later and one week earlier than the
existing apiary locations. The graphics of suit- field study dates. This result is also related to
ability values according to the existing apiary the NDVI imagery resolution because sparse
locations are given in Fig. 12., and the optimal and small plants could not be specified with
production start suitability threshold value (6) this resolution. The one-week date differences
for apiaries is emphasized with a red line. The from the start and end are quite significant
blue line indicates the average suitability of because plant intensities are the same before
all 176 existing apiary suitability values. The and after the season, which the NDVI resolution
accuracy and intersection rates show that the is not sufficient to detect. Similarly, late season
suitability map can be used for both apiary apiaries were calculated two weeks later than in
schedules and locating apiaries. the field study results. This result indicates the
Fig. 13. Comparison of apiary schedule and field study dates.
117Sari et AL. Apıary schedule generatıon for mıgratory apıarıes
difficulty of differentiating the forest cover and Although MODIS NDVI images are not sufficient
natural plants in mountainous areas. However, to generate apiary schedules, integrating the
these difficulties can be overcome through the CCRS records overcame this problem, albeit
use of high spatial resolution NDVI imagery. only in agricultural lands, by both increasing
As seen in Fig. 8, some early season apiaries the resolution and identifying the crop type.
were detected inside agricultural lands, and The natural plant areas, however, still required
upon examination they were revealed to be high resolution NDVI data images to detect the
located in mountainous and natural floral areas schedule more accurately. A five-day difference
surrounded by agricultural lands. The overlap- between the determined apiary schedule and
ping of these apiaries with the apiary schedule real apiary production dates is a good and
was generated between 10th April and 10th May. reliable result for apiaries and can occur due to
Late season apiaries were located in moun- the climatic conditions of a season from year
tanious lands where climatic and topographic to year. In this context, the results should be
conditions were quite harsh. evaluated based on the guiding role of the apiary
Although early season apiaries in agricultural schedule which points to the agricultural lands
lands intersected more noticeably with the where beekeepers can locate. Moreover, the
apiary schedule zones, the late season apiaries resultant apiary schedule provides a prediction
were not specified and did not intersect with of yield and total production estimations within
the apiary schedule zones. One reason for this a specified area. In addition to this, generating
result is related to the resolution of the NDVI an apiary schedule not only provides possible
images. The late season apiaries were located areas but also generates a honey type map for
on forested mountains with very small natural a study area. Because the CCRS involves all crop
plants which NDVI resolution was not sufficient information, the crop types can be separated
to detect. Another reason is that forests were and possible honey type areas can be easily
excluded from the apiary schedule via the suit- detected. In this way, with the contribution of
ability map to distinguish the plant and forest the suitability map, beekeepers were provided
covers. Thus, together with the resolution with a complete guide to with regard to honey
effect, these zones could not be determined in type, honey yield, suitable areas and productiv-
the apiary schedule. However, the resolution ity scheduling. By using the CCRS records, the
of the NDVI images was sufficient to detect use of field studies can be decreased as much
the large moors and planted areas. Thus, early as possible compared to other studies. Previous
season apiaries were determined accurately studies have only included suitability map
because non-forest areas and large natural plant generation and validation, but this study is the
areas could be identified with NDVI imagery. first to introduce the apiary schedule-oriented
suitability analysis. Moreover, the accuracy and
DISCUSSION reliability of the suitability map was increased in
this study through the evaluation of the most
This study presented a conceptual model detailed criteria used for site suitability for
for predicting apiary migration zones via an apiary locations from other research (Maris et al.,
apiary schedule map and a suitability analysis. 2008; Estoque & Murayama, 2010; Abou-Shaara
The methodology used in this study reveals a et al., 2013; Camargo et al., 2014; Fernandez
most detailed and comprehensive approach for et al., 2016; Zoccali et al., 2017). Criteria for
apiary migration which includes apiaries in both buildings, railroads and natural disaster zones
natural and agricultural lands. The diversity of were first used in addition to other criteria
the topography, the climatic conditions and the used in previous studies. Additional criteria such
flora of the study area enriched the results and as meteorological conditions, wind directions,
reliability of the apiary schedule which can be flowering, foraging area, and pesticide usage in
accepted as a conceptual model for all of Turkey. agricultural lands were also included to increase
118J. APIC. SCI. Vol. 64 No. 1 2020
the suitability. The unavailability of a temporal
flora map and plant density information, which Adgaba, N., Alghamdi, A., Sammoud, R., Shenkute,
are important for bees particularly limited A., Tadesse, Y., Ansari, MJ., Sharma, D., Hepburn,
accurate decision making. Thus, especially a late C. (2017). Determining spatio-temporal distribution
season apiary schedule could be determined of bee forage species of Al-Baha region based on
accurately in the case of local field studies for ground inventorying supported with GIS applica-
detecting plant density and flowering data. The tions and Remote Sensed Satellite Image analysis.
contribution of these criteria will provide both Saudi Journal of Biological Sciences, 24(5), 1038-
more accurate suitability analyses and apiary 1044. DOI: 10.1016/j.sjbs.2017.01.009
schedules.
In different topographical, physical and climatic Ahmad, F., (2013). Phenologically-tuned MODIS ND-
conditions, as in the study area, beekeeping VI-based time series (2000-2012) for monitoring
activities are enhanced due to the probabil- of vegetation and climate change in north-eastern
ity of an increased honey season. Beekeepers Punjab, Pakistan. Global Journal of Human-Social Sci-
can increase the honey yield by following the ence, 12(13-B), 37-54.
different seasons. At this point, this study reveals
two main subjects for beekeepers to increase Amiri, F., & Shariff, M.A. (2012). Application of geo-
their honey yield. The results establish for graphic information systems in land-use suitability
beekeepers both a route where to migrate and evaluation for beekeeping: A case study of Vah-
the start and end dates of migration. Moreover, regan watershed (Iran). African Journal of Agricul-
the beekeeping suitability concept reveals tural Research, 7(1), 89-97.
suitable areas which beekeepers had never
located, and by establishing new apiaries new Arentze, T.A., & Timmermans, H.J.P. (2000). ALBA-
beekeeping areas are specified and the honey TROSS: A Learning-based Transportation Oriented
yield increased. Thus, because beekeepers will Simulation System. EIRASS, Eindhoven University of
know when to migrate and where to locate, Technology, The Netherlands.
they may set their annual plan. By extending
this conceptual model to Turkey, a large number Arundel, J., Winter S., Gui, G., & Keatley, M. (2016). A
of seasons will be revealed and general routes web-based application for beekeepers to visualise
for beekeepers specified. The migration routes patterns of growth in floral resources using MODIS
can also be verified via GPS systems through data. Environmental Modelling & Software, 83, 116-
the monitoring of beekeeper movements during 125.
a year. Moreover, the possibility of over fifteen
honey types in Turkey will allow beekeepers Beck, P.S.A., Atzberger, C., Høgda, K.A., Johansen, B.,
to harvest more honey types by setting their Skidmore, A.K. (2006). Improved monitoring of vege-
schedules according to the apiary schedule. tation dynamics at very high latitudes: a new meth-
By introducing both the suitability and apiary od using MODIS NDVI. Remote Sensing and Environ-
schedule concepts, the results of this study can ment, 100(3), 321-334. http://dx.doi.org/ 10.1016/j.
constitute the infrastructure of National Apiary rse.2005.10.021
Management platforms.
Bian, J., Li, A., Song, M., Ma, L., Jiang, J. (2010). Recon-
REFERENCES struction of NDVI time-series datasets of MODIS
based on Savitzky-Golay filter. Journal of Remote
Abou-Shaara, H.F., Al-Ghamdi, A.A., & Mohamed, A.A. Sensing, 14(4), 725-741.
(2013). A Suitability Map for Keeping Honey Bees
Under Harsh Environmental Conditions Using Geo- Camargo, S.C., Garcia, R.C., Feiden, A., Vasconce-
graphical Information System. World Applied Sci- los, E.S., Pires., B.G., Hartleben, A.M. ... Pereira, D.J.
ences Journal, 22, 1099-1105. (2014). Implementation of a geographic informa-
119Sari et AL. Apıary schedule generatıon for mıgratory apıarıes
tion system (GIS) for the planning of beekeeping in e a comparison with in situ measurements. Sensors,
the west region of Paraná. Annals of the Brazilian 8(4), 2833-2853.
Academy of Sciences, 86(2), 955-971. http://dx.doi.
org/10.1590/0001-3765201420130278 Hall, A., Lamb, D.W., Holzapfel, B., & Louis, J. (2002).
Optical remote sensing applications in viticulture -
Chen, Y., Yua, J., & Khan, S. (2010). Spatial sensitivity a review, Australian Journal of Grape and Wine Re-
analysis of multi-criteria weights in GIS-based land search, 8, 36-47.
suitability evaluation. Environmental Modelling &
Software, 25, 1582-1591. Heumann, B.W., Seaquist, J.W., Eklundh, L., & Jöns-
son, P. (2007). AVHRR Derived Phenological Change
Damián, G.C. (2016). GIS-based optimal localisation in the Sahel and Soudan, Africa, 1982-2005. Re-
of beekeeping in rural Kenya Master’s degree the- mote Sensing and Environment, 108, 385-392.
sis, 30/ credits in Master in Geographical Information DOI:10.1016/j.rse.2006.11.025
Sciences Department of Physical Geography and
Ecosystems Science, Lund University. Jarlan, L., Mangiarotti, S., Mougin, E., Mazzega, P., Hier-
naux, P., Le Dantec, V. (2008). Assimilation of spot/
Eckert, S., Hüsler, F., Liniger, H., & Hodel, E. (2015). vegetation NDVI data into a Sahelian vegetation
Trend analysis of MODIS NDVI time series for de- dynamics model. Remote Sensing and Environment,
tecting land degradation and regeneration in Mon- 112, 1381-1394.
golia. The Journal of Arid Environments, 113, 16-28.
http://dx.doi.org/10.1016/j.jaridenv.2014.09.001 Karlsen, S.R., Tolvanen, A., Kubin, E., Poikolainen,
J., Høgda, K.A., Johansen, B., Makarova, O. (2008).
Estoque, R.C., & Murayama, Y. (2010). Suitability Anal- MODIS-NDVI-based mapping of the length of the
ysis for Beekeeping Sites in La Union, Philippines, growing season in northern Fennoscandia. Inter-
Using GIS and Multi-Criteria Evaluation Techniques. national. Journal of Applied Earth Observations, 10,
Research Journal of Applied Sciences, 5(3), 242-253. 253-266. DOI:10.1016/j.jag.2007.10.005
Estoque, R.C., & Murayama, Y. (2011). Suitabil- Landmann, T., Piiroinen, R., Makori, DM., Abdel-Rah-
ity Analysis for Beekeeping Sites Integrating GIS & man, E., Makau, S., Pellikka, P., Raina, SK. (2015). Ap-
MCE Techniques. Spatial Analysis and Modeling in plication of hyperspectral remote sensing for flower
Geographical Transformation Process. 978-94-007- mapping in African savannas, Remote Sensing of
0670-5. Springer Netherlands. Environment, 166, 50-60.
Fernandez, P., Roque, N., & Anjos, O. (2016). Spatial Lange, M., Dechant, B., Rebmann, C., Vohland, M.,
multicriteria decision analysis to potential beekeep- Cuntz, M., Doktor, D. (2017). Validating MODIS and
ing assessment. Case study: Montesinho Natural Sentinel-2 NDVI Products at a Temperate Decidu-
Park (Portugal). In: Sarjakoski, T., Santos, M.Y., Sarja- ous Forest Site Using Two Independent Ground-
koski, L.T. (Eds.), 19th AGILE International Conference Based Sensors. Sensors, 17, 1855.
on Geographic Information Science - Geospatial
Data in a Changing World, Helsinki, Finland. Maris, N., Mansor, S., & Shafri, H. (2008). Apicultural
Site Zonation Using GIS and Multi-Criteria Decision
FAO, (1976). A framework for land evaluation. Soils Analysis. Pertanika Journal of Tropical Agricultural
Bulletin 32, Food and Agriculture Organization of Science, 31(2), 147 - 162.
the United Nations, Rome.
Myneni, R.B., Keeling, C.D., Tucker, C.J., Asrar, G., Nem-
Fontana, F., Rixen, C., Jonas, T., Aberegg, G., Wunderle, ani, R.R. (1997). Increased plant growth in the north-
S. (2008). Alpine grassland phenology as seen in ern high latitudes from 1981 to 1991. Nature, 386,
AVHRR, VEGETATION, and MODIS NDVI time series 698-702. DOI: 10.1038/386698a0
120J. APIC. SCI. Vol. 64 No. 1 2020
Oldroyd, P.B., & Nanork, P. (2009). Conservation of Zhou, L., Tucker, C.J., Kaufmann, R.K., Slayback, D.,
Asian honey-bees- Apidologie Bee Conservation, Shabanov, N.V., Myneni, R.B. (2001). Variations in
40, 296-312. northern vegetation activity inferred from satel-
lite data of vegetation index during 1981 to 1999.
Saaty, T.L. (1977). A scaling method for priorities in The Journal of Geophysical Research, 106, 20069-
hierarchical structures. Journal of Mathematical Psy- 20083. DOI: 10.1029/2000JD000115
chology, 15, 234-281.
Zoccali P., Malacrinò A., Campolo O., Laudani F., Algeri
Saaty, T.L. (1980). The Analytical Hierarchy Process. G.M., Giunti G., Palmeri V. (2017). A novel GIS-based
New York: Wiley. approach to assess beekeeping suitability of Medi-
terranean lands. Saudi Journal of Biological Science,
Saaty, T.L. (1994). Fundamentals of Deci- 24(5), 1045-1050. DOI: 10.1016/j.sjbs.2017.01.062
sion Making and Priority Theory With The
Analytical Hierarchy Process, RWS Publ. Pittsburg,
69-84.
Saaty, T.L. (2001). Decision Making with Dependence
and Feedback: The Analytic Network Process, 2nd
edition, PRWS Publications, Pittsburgh PA.
Saaty, T.L., & Vargas, L.G. (1991). Prediction, Projec-
tion and Forecasting. Kluwer Academic Publishers,
Dordrecht, 25.
Schmidt, M., Udelhoven, T., Gill, T., & Roder, A. (2012).
Long term data fusion for a dense time series analy-
sis with MODIS and Landsat imagery in an Australian
savanna. Journal of Applied Remote Sensing, 6, 1-18.
http://dx.doi.org/10.1117/1.jrs.6.063512
121You can also read