Distribution and Spatial Pattern Analysis on Dengue Cases in Seremban District, Negeri Sembilan, Malaysia - MDPI
←
→
Page content transcription
If your browser does not render page correctly, please read the page content below
sustainability

Article
Distribution and Spatial Pattern Analysis on Dengue
Cases in Seremban District, Negeri Sembilan, Malaysia
Nuriah Abd Majid *, Nurafiqah Muhamad Nazi and Ahmad Fariz Mohamed
 Institute for Environment and Development (LESTARI), University Kebangsaan Malaysia,
 Bangi 43600, Selangor Darul Ehsan, Malaysia
 * Correspondence: nuriah@ukm.edu.my; Tel.: +603-89217639

 Received: 24 April 2019; Accepted: 28 May 2019; Published: 28 June 2019

 Abstract: Dengue fever disease increases alongside urbanization rate in tropical countries. Hence,
 the need to visualize the distribution pattern of increases is vital for the management of dengue
 cases, especially in Malaysia. Thus, the dengue surveillance system is proposed for the monitoring of
 dengue cases using computer-generated modeling for spatial distribution patterns, which is important
 for management and control. The present study performed distribution and spatial pattern analysis
 of dengue cases reported in the growing Seremban district in Negeri Sembilan, Malaysia in 2008 and
 2009. The purpose of the study is to evaluate the pattern of distribution and determine whether it is
 clustered or dispersed. A total of 1401 and 1056 cases for dengue-related diseases were reported by
 the Ministry of Health Malaysia in Seremban district in the years 2008 and 2009, respectively. Three
 spatial statistical analysis were conducted: Spatial mean center, directional distribution, and standard
 distant on distribution of dengue cases reported. This study found that the distribution pattern for
 dengue cases is clustered. Spatial mean center and directional distribution for both sets of years
 have slight differences. Meanwhile, standard distance for dengue cases reported in the year 2008
 is 22,085.82 m, which is bigger than dengue cases reported in 2009, showing a standard distance of
 20,318.35 m. More sets of cases throughout years are required in further studies to identify factors
 that contribute to dengue epidemiology in the Seremban district undergoing urbanization.

 Keywords: dengue; spatial mean center; standard distance; directional distribution

1. Introduction
      Dengue is a mosquito-borne disease spreading globally and increasing gradually every year.
There was about 2.2 million dengue reported globally in 2010, which rose up to 3.2 million cases
in 2015 [1]. Intensified dengue cases among the human population in 128 countries has become a
major threat, as dengue transmission shows negative signs of decline even though many researches
and mitigation programs have been worked on. Dengue fever is one of the major vector-borne viral
diseases in the world, mainly in the tropical and subtropical regions [2,3]. It is a most significant public
health issue globally, and approximately one-third of the population of the tropical and subtropical
regions are exposed to the risk of dengue [4]. About 40% of the world’s population is now at dengue
risk, as estimated by the World Health Organization (WHO) [5]. Dengue cases have been reported
in tropical areas, especially in the Asia Pacific countries such as Cambodia, China, Laos, Malaysia,
Philippine, Singapore, Vietnam, and Australia, as well as countries in the Pacific Islands [6]. It is
found that the main vectors of dengue are active through Aedes mosquitoes when the surrounding
temperature is less than 28 ◦ C. Aedes mosquitoes also require clean stagnant water to lay eggs and
reproduce [7]. Thus, the tropical and subtropical countries are the most suitable areas for the spread of
dengue cases. Dengue fever was first reported in Malaysia in the early 1900s. Later on, in 1962, dengue
hemorrhagic fever emerged in Penang [8–10]. Malaysia is a developing country with climate category

Sustainability 2019, 11, 3572; doi:10.3390/su11133572                      www.mdpi.com/journal/sustainability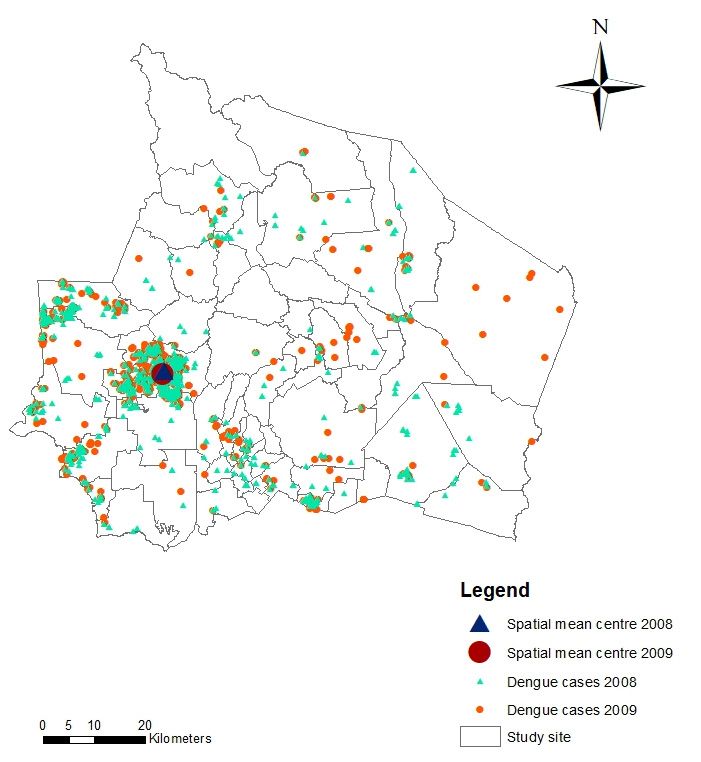
Sustainability 2019, 11, 3572                                                                      2 of 14

of hot and humid throughout the year. Malaysia receives on average 250 centimeters of rainfall in a
year and the average temperature is 27 ◦ C [11]. This condition is favored by domestic Aedes mosquitoes
that live with the human population and reside under the roof, balcony, and porch [12]. It is known
that the dengue virus spreads briskly due to the high adaptive tendency of the Aedes species with
climate change, common areas suitable as breeding sites, strong population mobility, and international
trade [13–15]. There are two female Aedes mosquito species, namely Aedes aegypti as the main dengue
vector and Aedes albopictus as the secondary vector, which prefer to breed outdoors. Female Aedes
mosquitoes bite and suck on human blood to obtain protein and iron mineral, thus increasing the
chances to transmit dengue viruses [12,16,17]. The bite of Aedes mosquitoes transmits dengue viruses
from four flavivirus (DEN-1, DEN-2, DEN-3, and DEN-4) and causes dengue fever and dengue
hemorrhagic fever that can lead to death [18]. Early symptoms of dengue fever include high body
temperature up to 40 ◦ C, headache, eye pain, muscle or joint pain, nausea, swollen gland, and petechial
rash. Abdominal symptoms, bleeding tendencies, and respiratory or circulatory disturbances are
typical symptoms of dengue hemorrhagic fever [5]. Multiple dengue prevention programs conducted
from different perspective, from the field of clinical, engineering, and vector control biology have been
done each year.
     As part of rigorous efforts in dengue epidemiology control and assessment in Malaysia, the Ministry
of Health (MOH) has collaborated with the Ministry of Science, Technology, and Innovation (MOSTI)
to implement dengue transmission monitoring using remote sensing (RS), namely iDengue (idengue.
remotesensing.gov.my), under supervision of Remote Sensing Agency Malaysia [19]. This surveillance
system monitors dengue transmission across the country by updating dengue fevers reported in every
hospital and medical institution on daily basis. This initiative was established to deliver information
on dengue cases statistics and dengue hotspots to the public for further preventive measure to combat
Aedes mosquitoes and dengue fever.
     Prior to that, researchers have worked together in the academic analysis on dengue surveillance
with aims to estimate dengue transmission using predictive mathematical-based modeling and
spatial-temporal analysis of mosquito distribution and localities. The outcomes of these researches
proposed great potential for cost-efficiency on dengue surveillance and control in regional and national
scales [20].
     Therefore, the epidemic transmission monitoring using GIS-based mapping is gradually become
important for disease control and management [21–24]. GIS and spatial statistical analysis are two
important tools used for monitoring and mapping the vector-borne study and its geographical
pattern [25,26]. Over the years, geoprocessing and digital mapping techniques were applied for
public health issues analysis, as well as the use of spatial analysis programs to visualize the spatial
distribution patterns of epidemiological data [27,28]. These techniques allow the development of
models to predict the possibilities of risk of disease and territorial infestation, mapping environmental
and social conditions associated with such patterns [29]. Most of the studies analyzed spatial pattern
of dengue cases reported using GIS software to determine the correlation between diseases statistical
analysis with factors contributing to dengue outbreak [30–33]. Moreover, spatial statistics is a useful
technique for the disease mapping, intensity, and environmental factor analysis. For example, cluster
analysis, hotspot analysis, and spatial autocorrelation are commonly used by the researchers [34–38].
     The purpose of this study is to evaluate the pattern of distribution of dengue cases and determine
whether it is clustered or dispersed in the Seremban district in order to contribute to the effective
decision-making process to control dengue outbreak in the district. Geographic information system (GIS)
software ArcMap, version 10.5 was used to analyze and visualize the cluster pattern in geographical
context [39]. Three approaches were performed to test the null hypothesis that there were no differences
between dengue cases reported in the years 2008 and 2009. Spatial statistical analysis was conducted
for both sets of year, focusing on spatial mean center, directional distribution, and standard distant
analysis. Application of this knowledge would strengthen disease surveillance system in the field of
health and GIS technology.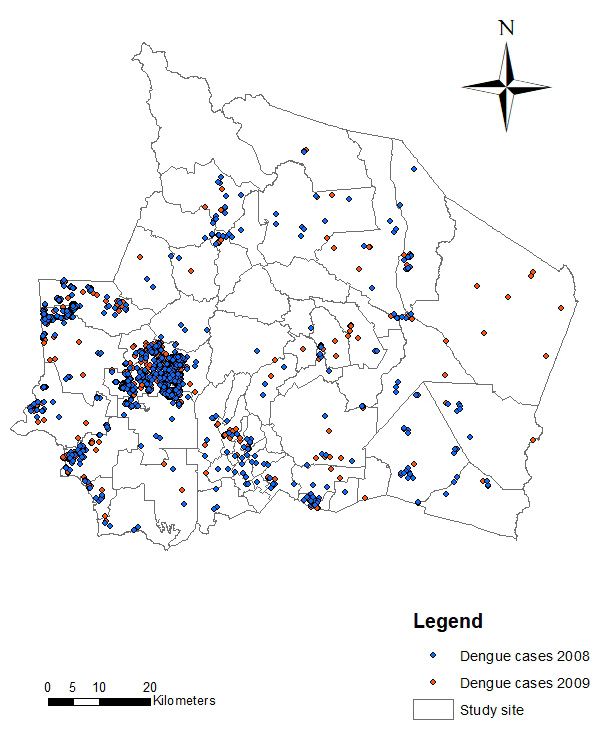
Sustainability 2019, 11, x FOR PEER REVIEW                                                          3 of 16

and standard
Sustainability 2019,distant
                     11, 3572analysis.
                                Application of this knowledge would strengthen disease surveillance
                                                                                              3 of 14
system in the field of health and GIS technology.

2. Materials
2. Materials and
             and Methods
                 Methods

2.1. Study Area
2.1. Study Area
      This study is focused in the Seremban district, which is the capital of Negeri Sembilan, Malaysia
      This study is focused in the Seremban district, which is the capital of Negeri Sembilan, Malaysia
and located 60 km south of Kuala Lumpur with coordinates of 02◦ 430 20”N and 101◦ 560 30”E that covers
and located 602km south of Kuala Lumpur with coordinates of 02°43′20″N and 101°56′30″E          that covers
about 959 km of land area (Figure 1). The average temperature in Seremban is 31 ◦ C, with rainfall
about 959 km2 of land area (Figure 1). The average temperature in Seremban is 31° C, with rainfall
precipitation ranging from 250 mm to 320 mm [40]. Seremban, which is located east of Negeri Sembilan,
precipitation ranging from 250 mm to 320 mm [41]. Seremban, which is located east of Negeri
has less slope than the middle part of the state. It is the significant district where extensive land use
Sembilan, has less slope than the middle part of the state. It is the significant district where extensive
changes and human activities increase every year, which in turn promote population growth [41]. With
land use changes and human activities increase every year, which in turn promote population growth
a population of 620,100 in 2015, Seremban currently has the highest dengue hotspot localities within
[42]. With a population of 620,100 in 2015, Seremban currently has the highest dengue hotspot
the district, mainly in the residential areas [19]. It is reported that a cumulative 1864 patients were
localities within the district, mainly in the residential areas [20]. It is reported that a cumulative 1864
admitted due to dengue-related diseases with death toll of six at the end of 2018 [42] Along with the
patients were admitted due to dengue-related diseases with death toll of six at the end of 2018 [43]
rise of development growth in the Seremban district that has been identified as part of Kuala Lumpur
Along with the rise of development growth in the Seremban district that has been identified as part
Extended Mega Urban Region (KLEMUR), which attracts population concentration to reside within its
of Kuala Lumpur Extended Mega Urban Region (KLEMUR), which attracts population concentration
urbanized town, dengue epidemiology needs to be controlled for its urban dwellers to be free from
to reside within its urbanized town, dengue epidemiology needs to be controlled for its urban
fear of health problems in this district [43].
dwellers to be free from fear of health problems in this district [44].

                                             Figure 1. Study site.

                                             Figure 1. Study site.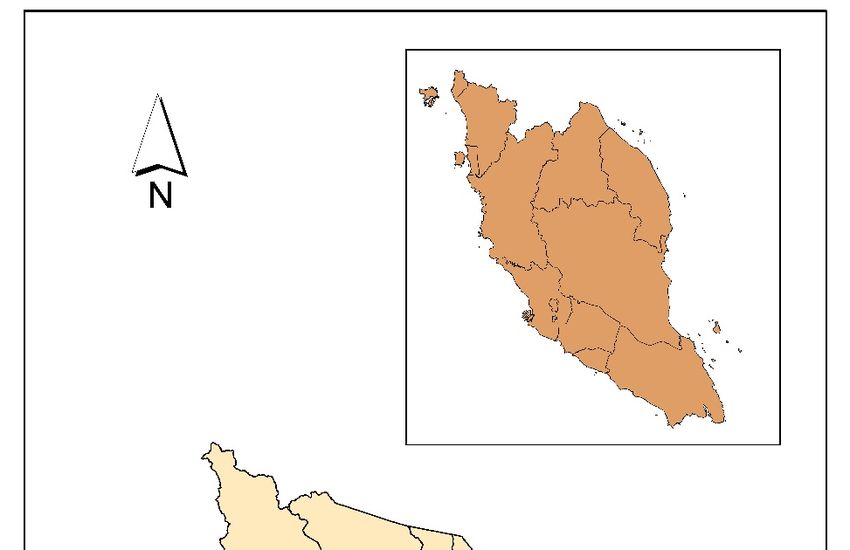
Sustainability 2019, 11, 3572                                                                        4 of 14

2.2. Data Collection
     Demographic data of dengue cases reported from hospitalized patients in every government and
private hospital in Seremban in the years 2008 and 2009 obtained from Ministry of Health Malaysia
contains: (1) Location; (2) number of cases; and (3) date start and last case recorded. During the years
surveyed, a total of 2457 dengue cases were reported throughout the city of Seremban, with positive
dengue fever selected for this study. Latitude and longitude coordinates of patients’ locality were
extracted from the data collection to perform distribution and spatial analysis.

2.3. Statistical Analysis
     Statistical analysis is used to identify and confirm spatial patterns, such as the center of a group of
features, the directional trend, and whether features form clusters. It also classifies and symbolizes the
data can obscure or overemphasize patterns. Statistical functions analyze the underlying data and
measures that can be used to confirm the existence and strength of the pattern [39]. Thus, the statistical
analyses in this study will help to provide answers for linking distribution pattern of dengue cases
with cause of the dengue.
     Geographical distribution is to measure a set of features for calculation of value which represents
a characteristic of the distribution, such as the center, orientation, or compactness [39]. This study
focused on two methods: Spatial distribution and spatial distribution pattern analysis. Spatial
distribution includes spatial mean center, standard distance, and directional distribution analysis.
Spatial distribution pattern analysis is the average nearest neighbor method. Mapping of dengue
epidemiology distribution trend identifies relationship with specific physical characteristics. Spatial
pattern analysis was performed using the average nearest neighbor method. Distribution and pattern
analysis were conducted to understand whether there were any dominant distributions and patterns
for the dengue outbreak [44,45]. Pattern distribution details were minimized using pattern analysis.
Clustered pattern showed there was a factor that causes dengue epidemiology in that area.

2.4. Spatial Mean Center
     Spatial mean center is the average coordinates x and y of all features in the study area. It is
useful to detect any changes in distribution or to compare features of distribution. This analysis
shows leaning-centered phenomena, especially, to visualize the means of dengue cases reported in
Seremban. Spatial mean center is to study changes in distribution detection to compare type and
feature of distributions. Spatial mean center is able to create a new feature point classification where
every feature represents mean center. The mean of x and y show the value of mean center, it means
that the dimensional field was included as the product of features.
     Mean center calculated as below:                Pn
                                                       i=1 xi
                                              X=                                                     (1)
                                                         n
                                                     Pn
                                                       i=1 yi
                                              Y=                                                     (2)
                                                         n
where xi and yi are coordinates for i, and n is the total number of the features.
     Weighted mean is as below:                     Pn
                                                           Wi xi
                                           Xw = Pi=n 1                                               (3)
                                                        i=1 Wi
                                                    Pn
                                                           Wi yi
                                           Yw = Pi=n1                                                (4)
                                                        i=1 Wi
where wi is the weigh on characteristic i.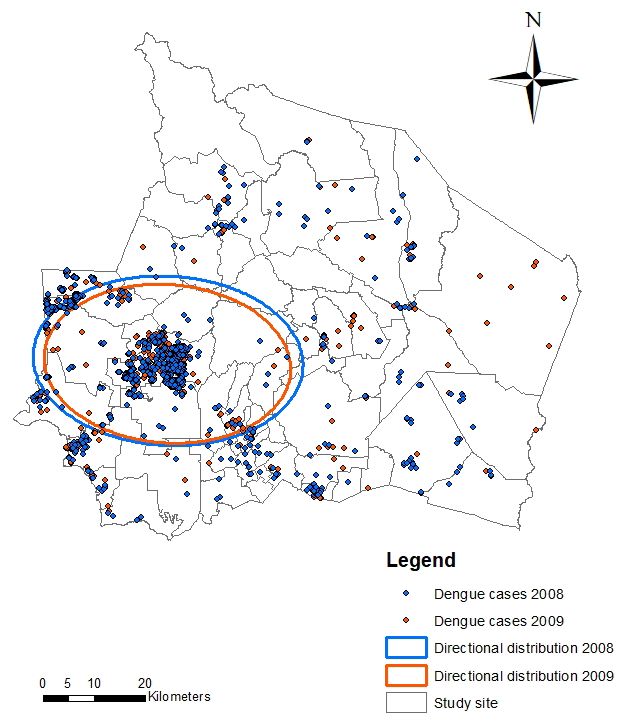
Sustainability 2019, 11, 3572                                                                       5 of 14

      Method to calculate center for three dimension is the z attribute for every feature:
                                                      Pn
                                                         i   = Zi
                                               Z=                                                      (5)
                                                             n
                                                       Pn
                                                                 Wi zi
                                             Zw =       Pi=n 1                                         (6)
                                                             i=1 Wi

2.5. Standard Distant
     Standard distant measure distribution density, which provides a single value, represents the
distribution around the mean center. The scatter of points around the center needs measurement.
The value is the distance represented by deviations. Therefore, measures of spatial dispersion give
information about the dengue spread around a center. The expression used is standard distance, which
is equivalent to the statistician’s standard deviation. Standard distant is a tool used to create a round
polygon of points dispersed around a center. In this study, a round of polygon represent dispersed
dengue cases reported in each year from the mean center [39].
     Standard distant shows a new feature class which includes a round, centered polygon on mean
center (a single mean and a circle for every case). Every round polygon is created with radii that
have the same value as the standard distant value. The attribute value for every round polygon is the
x-coordinate mean centered polygon, y-coordinate mean centered, and standard distant (radius circle).
     Calculation of standard distance is as follows:
                                         s              2 P           2
                                           Pn               n
                                             i=1 xi − X      i=1 yi − Y
                                 SD =                     +                                            (7)
                                                 n               n

where xi and yi is the coordinates for feature i, {X, Y} show mean center features, and n is equal to the
total of feature number.
      Weighted standard distance is as follows:
                                        v
                                        u
                                        tP                2                            2
                                         n                             Pn
                                         i=1 W i   x i − X              i=1 W i   yi − Yw
                                SDw =      Pn                    +         Pn                          (8)
                                             i=1 Wi                          i=1 Wi

where wi is the weigh on feature i and {Xw, Yw} indicates mean center.

2.6. Standard Deviational Ellipse
     As a GIS tool for delineating spatial point data, standard deviational Ellipse (SDE) was used to
summarize spatial characteristics of geographical features, which are the central tendency, dispersion,
and directional trends [39]. The common method to measure trend of one set location is to calculate
standard distance separately on axis x and y. Both steps determine ellipse axis while including
distribution characteristics. Ellipse is also known as standard deviational ellipse as it is calculated
by standard deviation from the x-coordinate and y-coordinate from mean center to determine ellipse
axis. Ellipse allows distribution characteristics to go longitudinally and have certain orientation.
Graphing ellipses was used in disease surveillance studies to predict spatial spread trends, since
the central tendency and dispersion are two principal aspects concerned by epidemiologists [46,47].
The calculations are as in Equations 9a and 9b below:
                                                    s                       2
                                                        Pn
                                                             i=1   xi − X
                                         SDEx =                                                      (9a)
                                                                   n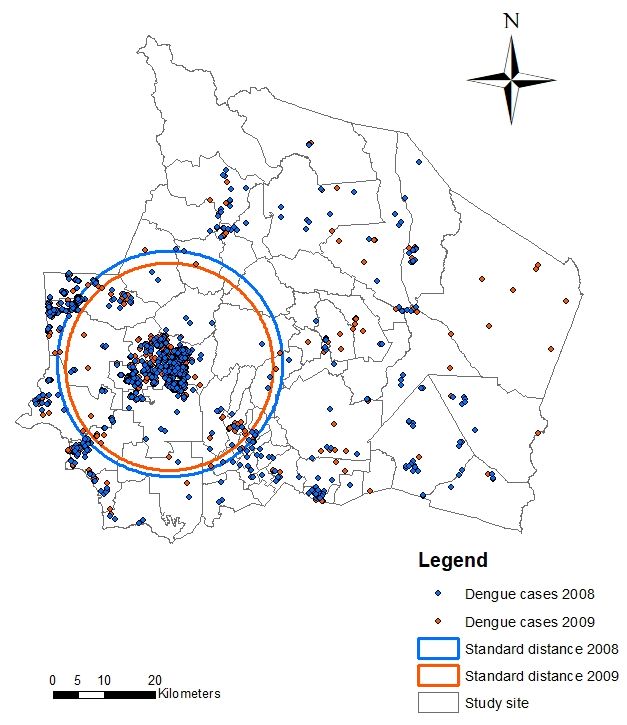
Sustainability 2019, 11, 3572                                                                      6 of 14

                                                    s                     2
                                                         Pn
                                                          i=1    yi − Y
                                       SDEy =                                                       (9b)
                                                                n
where xi and yi are the coordinates for feature i, {X, Y} shows mean center, and n is the total number
of features.
     Angle of rotation calculated as Equation (2) below:

                                                             A+B
                                              tan θ =
                                                               C
                                              Xn               Xn
                                       A=                x2i −            y2i
                                                   i=1              i=1
                                        r
                                              Xn           2        Xn               2
                                   B=     (           x2i ) − (              y2i )
                                                i=1                    i=1
                                                    Xn
                                              C=                xiyi                                (10)
                                                          i=1
where xi and yi deviation derived from xy coordinates from mean center.
    Standard deviation for x and y-axis are as follows:
                                          q
                                                          cos θ − ( y sin θ)2
                                              Pn
                                    √          i=1 (xi
                                σx = 2                                                              (11)
                                                                n
                                          q
                                                          sin θ − ( y cos θ)2
                                              Pn
                                    √          i=1 (xi
                                σy = 2                                                               (12)
                                                         n
     Standard deviational ellipse creates new feature class that includes centered ellipse polygon on
mean center for all characteristics (or for cases when values were defined) [39]. Attribute values from
ellipse polygon included standard distance (long and short axis) and ellipse orientation. Orientation
represents long axis rotation measured clockwise from noon. In this study, SDE was conducted to
analyze quantitatively on the orientation of dengue fever cases for identifying to what extent that
those dengue outbreak might have spread. Other than that, it also identified the number of standard
deviation (1, 2, or 3). When features have normal spatial distribution (means density in center and
becoming less dense towards the edge), one standard deviation makes up to 68% from all centroid
input features. Two standard deviations will make up about 95% from all features, and three standard
deviations will cover about 99% of all centroid features.
     Spatial distribution pattern mapping was conducted by pattern analysis using average nearest
neighbor (ANN) analysis that measures the average distance from each point in the study area to
its nearest point. The average distance is compared to the expected average distance. In doing so,
an ANN ratio is created, which, in simple terms, is the ratio of observed/expected. If the ratio is less
than 1, we can say that the data exhibits a clustered pattern, whereas a value greater than 1 indicates a
dispersed pattern in our data [39]. In this study, this distribution pattern mapping of dengue fever
cases was observed, and the shape of the ANN curve as a function of neighbor order can provide
insight into the spatial arrangement of points relative to one another whether it is clustered, random,
or dispersed. ArcMap 10.5 software was used to perform these statistical analyses. The application
formula used in ArcMap 10.5 uses mathematical equations in the software to develop every analysis
with different functions.
Sustainability 2019, 11, 3572 7 of 14
3. Results
Statistical analysis is important to evaluate the spatial distribution of dengue and to understand
the factors that may be related to the occurrence of the cases. Spatial distribution pattern is used to
identify geographic patterns. It is important to understand how geographic phenomena behave using
formulation spatial mean center, directional distribution, and standard distance. It was found in the
study area that 1401 dengue cases were reported in 2008. Dengue cases decline about 28% in 2009 from
previous year, when 1056 patients were hospitalized with dengue symptoms.
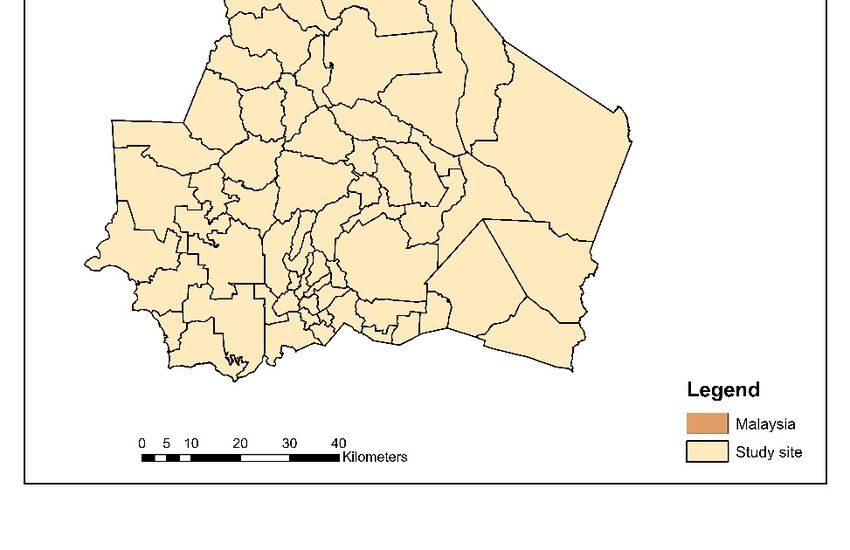
Spatial mean center is the analysis where phenomena leans to be centered. It is the average
of x and y that sync all features in the study area. It is useful to detect changes in distribution or
to compare types of feature distribution. Mean center point create new point feature class where
every feature represent mean center. X and Y means show the value of center, case and dimension
field means included as the product of features. Figure 2 shows the location of every dengue cases
reported in the years 2008 and 2009 with their mean centers, respectively. Spatial mean center for both
dengue cases overlap with each other and are located on the west of this study site. Mean center for
dengue cases in the year 2008 is located at x-coordinate 441919.907209 and y-coordinate 299749.74661.
Meanwhile, the mean center for dengue cases for the year 2009 is located at x-coordinate 441789.096591
and y-coordinate 299165.549242. This is parallel to the distribution of the primary dengue cases
Sustainability 2019, 11, x FOR PEER REVIEW 8 of 16
reported in both years.
Figure 2. Spatial mean centers for dengue cases in the years 2008 and 2009.
Figure 2. Spatial mean centers for dengue cases in the years 2008 and 2009.
Figure 3 shows the directional distribution for dengue cases reported. The directions for
distribution of dengue cases in both years shows slight differences. Ellipse polygon of the year 2008
is bigger than the year 2009 derived from analysis, that covers 68% of the features with rotation 93.05°
and 94.34° on the long axis, respectively. Both ellipses situated at the east of the study site. Hence,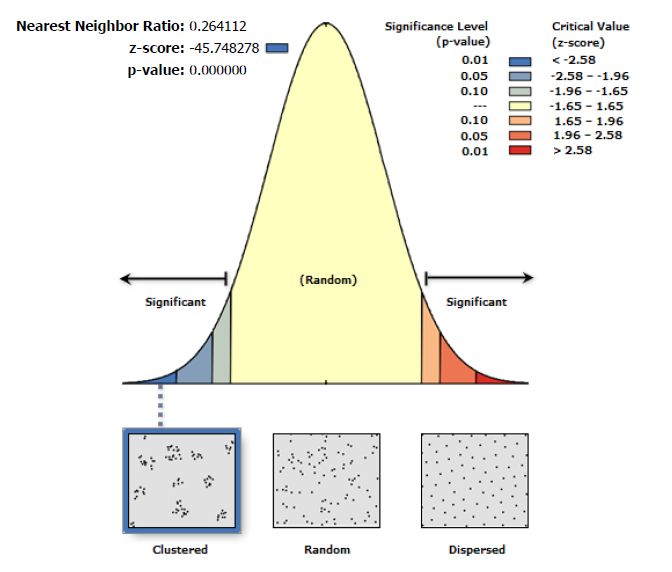
Sustainability 2019, 11, 3572                                                                              8 of 14

         Figure 3 shows the directional distribution for dengue cases reported. The directions for
   distribution of dengue cases in both years shows slight differences. Ellipse polygon of the year 2008 is
   bigger than the year 2009 derived from analysis, that covers 68% of the features with rotation 93.05◦
   and 94.34◦ on the long axis, respectively. Both ellipses situated at the east of the study site. Hence,
   this shows that dengue fever outbreak distribution in both years have the same directions, which are
Sustainability
   centered2019,   11, west
               at the  x FORof
                             PEER
                               theREVIEW
                                   Seremban district.                                             9 of 16

                        Figure
                     Figure    3. Directional
                            3. Directional    distribution
                                           distribution    of dengue
                                                        of dengue    cases
                                                                  cases    in the
                                                                        in the    Seremban
                                                                               Seremban    district.
                                                                                        district.

        Figure
     Figure     4 shows
             4 shows      standard
                       standard     distant
                                  distant of of  dengue
                                             dengue       cases
                                                       cases in in
                                                                thethe Seremban
                                                                    Seremban      district.
                                                                                district.    Standard
                                                                                          Standard    distance
                                                                                                   distance  forfor
  dengue   cases  reported  in the year 2008  is 22,085.82  m. Meanwhile,    dengue  cases  reported
dengue cases reported in the year 2008 is 22,085.82 m. Meanwhile, dengue cases reported in 2009      in 2009 show
  standard
show         distance
       standard        of 20,318.35
                   distance          m. This
                             of 20,318.35   m.analysis   shows that
                                                  This analysis       boththat
                                                                  shows     years develop
                                                                                both  years adevelop
                                                                                               minor difference
                                                                                                       a minor of
difference of dengue transmission with smaller dispersal of standard distance in the yearto2009
  dengue   transmission    with  smaller dispersal   of standard   distance in the year   2009 compared     2008.
compared to 2008.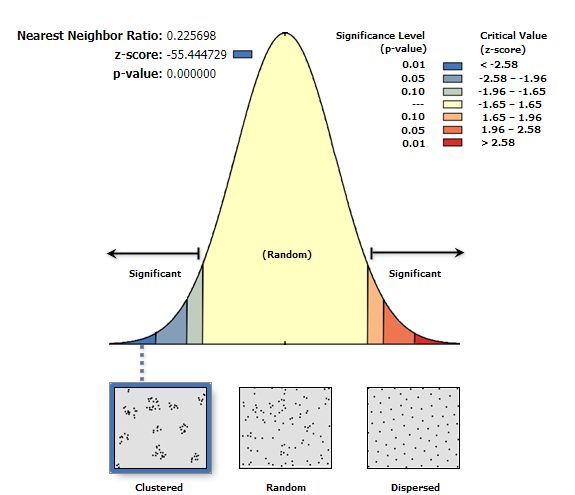
Sustainability 2019, 11, 3572                                                                                        9 of 14
Sustainability 2019, 11, x FOR PEER REVIEW                                                                         10 of 16

                          Figure 4. Standard distant of dengue cases in the years 2008 and 2009.
                       Figure 4. Standard distant of dengue cases in the years 2008 and 2009.
   4. Discussion
4. Discussion
   Dengue Cases Distribution Pattern Analysis
4.1. Dengue Cases Distribution Pattern Analysis
         Figure 5 shows the spatial distribution pattern map. This pattern mapping was conducted by
      Figureanalysis
   pattern    5 shows     the spatial
                        using  averagedistribution       pattern
                                          nearest neighbor         map. This
                                                                 method.         pattern
                                                                            Figure        mapping
                                                                                    5 represent        was distance
                                                                                                  nearest   conducted     by
                                                                                                                      analysis
pattern  analysis
   method.     Theusing     average
                      z-score         nearest
                               is -55.4447    andneighbor
                                                    there ismethod.    Figure
                                                              a less than    1%5likelihood.
                                                                                   represent nearest
                                                                                                 Nearest distance  analysis
                                                                                                            neighbor    ratio is
method.    The  z-score   is -55.4447   and   there  is a less  than  1%   likelihood.  Nearest    neighbor
   0.22 (Figure 6). According to theory, if the index (nearest neighbor ratio) is less than 1, the pattern     ratio is 0.22
(Figure   6). According
   displayed    is clustered.to Meanwhile,
                                 theory, if the     index
                                                if the index(nearest   neighbor
                                                               is bigger            ratio)direction
                                                                          than 1, trend    is less than     1, thethe
                                                                                                      is toward     pattern
                                                                                                                      disperse
displayed   is clustered.
   distribution              Meanwhile,
                   [39]. In this  case, theifpattern
                                               the index   is bigger
                                                       of this        than
                                                                analysis  is 1, trend direction
                                                                             clustered.           is toward the
                                                                                         This phenomenon           dispersethat
                                                                                                                indicates
distribution
   the hotspot [40].
                   forIndengue
                         this case, the to
                                  cases  pattern
                                           occurofinthisbothanalysis  is clustered.
                                                               the years   2008 andThis2009phenomenon
                                                                                             is located at indicates
                                                                                                             the west that
                                                                                                                         of this
thestudy
     hotspot  for dengue cases to occur in both the years 2008 and 2009 is located at the west of this
           area.
study area.
Sustainability 2019, 11, x FOR PEER REVIEW 11 of 16
Sustainability 2019, 11, 3572 10 of 14
Sustainability 2019, 11, x FOR PEER REVIEW 11 of 16
Figure 5. Spatial distribution of dengue cases in the Seremban district.
Figure 5. Spatial distribution of dengue cases in the Seremban district.
Figure 5. Spatial distribution of dengue cases in the Seremban district.
Figure6.6. Distribution
Figure Distributionpattern
patternof
ofdengue
denguecases
casesin
inthe
theyears
years2008
2008and
and2009.
2009.
Pattern Figure 6.analysis
Pattern distribution
distribution Distribution
analysis waspattern
was of dengue
performed
performed cases in the
totodetermine
determine and years
and 2008 and whether
understand
understand 2009.
whether therethere
are are
any
any dominant patterns in dengue case distribution. Details of pattern distribution
dominant patterns in dengue case distribution. Details of pattern distribution were filtered by were filtered
by Pattern distribution
conducting pattern analysis was
analysis. performed
Clustered to determine
pattern and
indicatesthere
thereunderstand
were aa factorwhether
factor there are any
causing
conducting pattern analysis. Clustered pattern indicates were causing dengue
dengue
dominant
epidemiology patterns
in the in dengue
study area case
(Figure distribution.
7). High Details
density of of pattern
population distribution
located at the were
west of filtered
Seremban by
epidemiology in the study area (Figure 7). High density of population located at the west of Seremban
conducting pattern
district analysis.high
Clustered incidence
pattern indicates there were a factor Thus,
causing dengue
districtcould
couldbebethe
thereason
reasonofof highdengue
dengue incidencebetween betweenthese
thesetwo
twoyears
years[46].
[47]. Thus,this
thiswould
would
epidemiology
help in the study area (Figure 7). High density of population located at the west of Seremban
help the authority to enhance prevention and control over dengue spread at the specific location by
the authority to enhance prevention and control over dengue spread at the specific location by
district could
planning be the reason of high dengue incidence betweeninthese two years [47]. Thus, this would
planning ofof care
care provisions
provisions inin areas
areas of
of greater
greater vulnerability
vulnerability in orderorder to
to reduce
reduce the
the severity
severity of of the
the
help the authority to enhance prevention and control over dengue spread at the specific location by
disease
diseasespread.
spread.
planning of care provisions in areas of greater vulnerability in order to reduce the severity of the
disease spread.Sustainability 2019, 11,
Sustainability 2019, 11, 3572
x FOR PEER REVIEW 11 of 14
12 16
Figure 7. Spatial patterns of dengue cases in the years 2008 and 2009.
Figure 7. Spatial patterns of dengue cases in the years 2008 and 2009.
Table 1 summarized nearest distance method analysis. Z-score reading shows that pattern less
than Table 1 summarized
1% likelihood nearest distance
are significant. method
According analysis.
to theory, whenZ-score reading
the index showsnearest
(average that pattern less
neighbor
than 1%
ratio) likelihood
is less are pattern
than 1, the significant. According
shown to theory,
is clustered. when the
Meanwhile, index
if the (average
index is biggernearest
than 1,neighbor
pattern
ratio) is less
direction than 1, theThus,
is dispersed. pattern shown is clustered.
distribution pattern of Meanwhile,
dengue cases if reported
the indexinisthis
bigger than
study is 1, pattern
clustered.
direction
Z-score is dispersed.
reading Thus,1%
is less than distribution pattern of dengue
indicates distribution patterncases reported
of dengue inisthis
cases study is clustered.
significant.
Z-score reading is less than 1% indicates distribution pattern of dengue cases is significant.
Table 1. Spatial pattern for dengue cases in the Seremban district.
Table 1. Spatial pattern for dengue cases in the Seremban district.
Year Dengue Cases Reported Nearest Neighbor Ratio z-Score p-Value
Year dengue cases2008 Nearest neighbor 0.225698
z-score −55.444729 0.000000
p-value
reported 2009 ratio 0.264112 −45.748278 0.000000
2008 0.225698 -55.444729 0.000000
Every dengue case reported displayed clustered pattern. However, dengue cases0.000000
2009 0.264112 -45.748278 in the year 2008
Everythe
were dengue
morecase reported compared
clustered displayed clustered pattern.
to the year However,
2009. dengue
This shows cases
that in the
there isyear 2008 were
a factor the more
affecting the
clusteredtransmission
dengue compared to the year that
during 2009.year
This that
shows that there
causes is adengue
higher factor affecting
outbreakthecompared
dengue transmission
to the nextduring
year.
that year
Rapid that growth
urban causes higher dengue outbreak
with extensive land usecompared to the nextthrough
change processes year. Rapid urban growth
development withtownship
of new extensive
and infrastructure, along with the needs of population growth, caused breeding ecosystemneeds
land use change processes through development of new township and infrastructure, along with the of
for the
population
dengue growth,
vector, caused Aedes
especially breeding ecosystem [48].
mosquitoes for the dengue
The urbanvector,
growth especially
providesAedes
goodmosquitoes
spaces and[49]. The
places
urban growth provides good spaces and places for breeding, while higher population
for breeding, while higher population of humans and animals provides good food sources for the of humans and animals
provides good food sources for the Aedes mosquitoes [7,16]. Thus, this could be the key factor, as the cluster
Aedes mosquitoes [7,16]. Thus, this could be the key factor, as the cluster areas are located within the
areas are located within the city center of the Seremban district.
city center of the Seremban district.
5. Conclusions
5. Conclusions
Spatial statistical
Spatial statisticaldistribution
distribution andand pattern
pattern analyses
analyses play play important
important roles inroles in understanding
understanding dengue
dengue cases epidemiology in the study area. This is because distribution
cases epidemiology in the study area. This is because distribution and spatial pattern are derived and spatial pattern are
derived from certain processes. These three spatial statistical analyses (spatial mean
from certain processes. These three spatial statistical analyses (spatial mean center, standard distance, center, standard
distance,
and and directional
directional distribution)distribution)
show thatshow that the
the dengue dengue
cases cases
in the yearsin 2008
the years 2008 are
and 2009 andboth
2009clustered
are both
at the west of the study site. This analysis found that there are differences between the directionthe
clustered at the west of the study site. This analysis found that there are differences between of
direction
dengue of dengue
cases cases distribution,
distribution, even it is
even it is minimal. minimal.
Pattern Pattern distribution
distribution analysis wasanalysis
conductedwas toconducted
enhance
to enhance
the the finding
finding results, and results, and itthat
it was found wasthefound that the
clustered clustered
pattern pattern in
is dominant is dominant
this study in areathis study
with an
area with an average nearest neighbor ratio of less than 1. This proved that there
average nearest neighbor ratio of less than 1. This proved that there is a factor affecting the rise in is a factor affecting
the rise in
dengue dengue
cases casesinreported
reported the yearin thecompared
2008 year 2008 compared to 2009.
to 2009. Above all, Above all, this
this shows thatshows
spatialthat spatial
modeling
modeling
should take should take into
into account of account
dengue of dengue
cases casesinreported
reported in other
other years years for
for further further studies.
studies.
We observed that the population in this region frequently migrates
We observed that the population in this region frequently migrates and rapidly urbanizes,and rapidly urbanizes, which
which
may be
may becontributing
contributing factors
factors in the
in the emergence
emergence of centered
of centered denguedengue
epidemic epidemic at the
at the west west
of the of the
Seremban
Seremban district [49]. The future urbanization, globalization, environment,
district [48]. The future urbanization, globalization, environment, human behavior, and lack of control human behavior, and
lack of control of vectors have contributed to the global distribution of dengue. Furthermore, ifSustainability 2019, 11, 3572 12 of 14
of vectors have contributed to the global distribution of dengue. Furthermore, if unprecedented
population growth and continued urbanization continue as projected, there will be gradual increases
in the severity, frequency, geographical distribution, and magnitude of dengue epidemics in the
future [13].
Dengue fever outbreaks in Malaysia reached 80,615 cases reported in the year 2018, with a death
toll of 147. The Seremban district recorded a total of 1864 dengue fever cases with six deaths caused by
dengue virus, which is 2.31% from cumulative of cases reported across the country [42]. Although this
number contributed to the rise of dengue transmission in Malaysia on a small scale, it still requires
monitoring to ensure the quality of public health in the urbanized Seremban district and preventive
measure should be applied to reduce the number.
The lack of numbers on data sets per year for dengue fever cases reported was been found to
create a gap of knowledge in this study. Further studies conducted should include a range of at least
five years of data sets for dengue outbreak in the country to analyze the distribution pattern and
direction of the transmission. Studies on factors affecting dengue outbreak in the Seremban district
would also help as a tool in mitigating dengue fever.
Author Contributions: N.A.M. conceived and designed the research. N.M.N. did most of the analysis, contributed
extensively to data processing and preparation. A.F.M. has given many suggestions for improving the article for
language editing. All authors read and approved the final manuscript.
Funding: This project was funded by the project under the University Kebangsaan Malaysia research funds with
grant no. (GGPM-2018-030).
Acknowledgments: This study honor the late researcher Shaharudin Idrus from Institute for Environment
and Development (LESTARI), Universiti Kebangsaan Malaysia for his contribution towards the knowledge of
this study.
Conflicts of Interest: The authors declare no conflicts of interest.
References
1. World Health Organization. Dengue and Severe Dengue. Retrieved from World Health Organization. Available
online: https://www.who.int/news-room/fact-sheets/detail/dengue-and-severe-dengue (accessed on 8 April 2019).
2. Atique, S.; Abdul, S.S.; Hsu, C.; Chuang, T. Meteorological influences on dengue transmission in Pakistan.
Asian Pac. J. Trop. Med. 2016, 9, 954–961. [CrossRef]
3. Dhiman, S.; Rabha, B.; Yadav, K.; Baruah, I.; Veer, V. Insecticide susceptibility and dengue vector status of
wild Stegomyia albopicta in a strategically important area of Assam, India. Parasit. Vectors 2014, 7, 295.
[CrossRef]
4. Rogers, D.J.; Wilson, A.J.; Hay, S.I.; Graham, A.J. The global distribution of yellow fever and dengue.
Adv. Parasitol. 2006, 62, 181–220. [CrossRef]
5. World Health Organization. Dengue: Guidelines for Diagnosis, Treatment, Prevention and Control; World
Health Organization: Geneva, Switzerland, 2009. Available online: http://www.who.int/rpc/guidelines/
9789241547871/en/ (accessed on 10 April 2019).
6. Stanaway, J.D.; Shepard, D.S.; Undurraga, E.A.; Halasa, Y.A.; Coffeng, L.E.; Brady, O.J.; Hay, S.I.; Bedi, N.;
Bensenor, I.M.; Castañeda-Orjuela, C.A.; et al. The global burden of dengue: An analysis from the Global
Burden of Disease Study 2013. Lancet Infect. Dis. 2016, 16, 712–723. [CrossRef]
7. Hasnan, S.N.A.; Che-Dom, N.; Abd-Latif, Z.; Madzlan, F. Surveillance of Aedes mosquitoes in different
residential types in central zone of Shah Alam, Selangor. Asian Pac. J. Trop. Dis. 2017, 7, 332–340. [CrossRef]
8. Skae, F.M.T. Dengue fever in Penang. Br. Med J. 1902, 2, 1581–1583. [CrossRef]
9. Rudnick, A.; Tan, E.E.; Lucas, J.K.; Omar, M. Mosquito-borne haemorrhagic fever in Malaya. Br. Med J. 1965,
1, 1269–1272. [CrossRef]
10. Poovaneswari, S. Dengue situation in Malaysia. Malays. J. Pathol. 1993, 15, 3–7.
11. Meteorological Department Malaysia. Available online: www.met.gov.my (accessed on 8 April 2019).
12. Ali, M.Z. Aedes biak lebih cepat dalam cuaca panas. Rencana 2016. Available online: https://www.bharian.
com.my/node/120966 (accessed on 1 March 2019).Sustainability 2019, 11, 3572 13 of 14
13. Gubler, D. Dengue, urbanization and globalization: The unholytrinity of the 21st century. Trop. Med.
Int. Health 2011, 39, 3–11. [CrossRef]
14. Schmidt, W.-P.; Suzuki, M.; Dinh Thiem, V.; White, R.G.; Tsuzuki, A.; Yoshida, L.-M.; Yanai, H.; Haque, U.;
Huu Tho, L.; Anh, D.D.; et al. Population density, water supply, and the risk of dengue fever in Vietnam:
Cohort study and spatial analysis. PLoS Med. 2011, 8, e1001082. [CrossRef]
15. Bouzid, M.; Colón-González, F.J.; Lung, T.; Lake, I.R.; Hunter, P.R. Climate change and the emergence of
vector-borne diseases in Europe: Case study of dengue fever. BMC Public Health 2014, 14, 781. [CrossRef]
16. Mohiddin, A.; Jaal, Z.; Md-Lasim, A.; Dieng, H.; Zuharah, W.F. Assessing dengue outbreak areas using
vector surveillance in north east district, Penang Island, Malaysia. Asian Pac. J. Trop. Dis. 2015, 5, 869–876.
[CrossRef]
17. Rohani, A.; Suzilah, I.; Wan-Najdah WM, A.; Topek, O.; Mustafakamal, I.; Lee, H.L. Factors determining
dengue outbreak in Malaysia. PLoS ONE 2018, 13, e0193326. [CrossRef]
18. Centers for Disease Control and Prevention. Available online: https://www.cdc.gov/dengue/index.html
(accessed on 8 April 2019).
19. Agensi Remote Sensing Malaysia (ARSM); Kementerian Sains Teknologi dan Inovasi (MOSTI). Available
online: http://idengue.remotesensing.gov.my/idengue/index.php (accessed on 10 April 2019).
20. Ling, C.Y. Dengue Disease in Malaysia: Vulnerability Mapping and Environmental Risk Assessment.
Master’s Thesis, Humboldt University of Berlin, Berlin, Germany, 28 April 2015.
21. Bhoomiboonchoo, P.; Gibbons, R.V.; Huang, A.; Yoon, I.K.; Buddhari, D.; Nisalak, A. The spatial dynamics of
dengue virus in Kamphaeng Phet, Thailand. PLoS Negl. Trop. Dis. 2014, 8, e3138. [CrossRef]
22. Khormi, H.M.; Kumar, L.; Elzahrany, R.A. Modeling spatio-temporal risk changes in the incidence of dengue
fever in Saudi Arabia: A geographical information system case study. Geospat. Health 2011, 6, 77–84.
[CrossRef]
23. Srivastava, A.; Nagpal, B.N.; Joshi, P.L.; Paliwal, J.C.; Dash, A.P. Identification of malaria hot spots for focused
intervention in tribal state of India: A GIS based approach. Int. J. Health Geogr. 2009, 8, 30. [CrossRef]
24. Gilruth, P.; Kalluri, S.; Rogers, D.; Szczur, M. Surveillance of arthropod vector-borne infectious diseases using
remote sensing techniques: A review. PLoS Pathog. 2007, 3, 1361–1371. [CrossRef]
25. Rogers, D.J.; Suk, J.E.; Semenza, J.C. Using global maps to predict the risk of dengue in Europe. Acta Trop.
2014, 129, 1–14. [CrossRef]
26. Stevens, K.B.; Pfeiffer, D.U. Spatial modelling of disease using data- and knowledge-driven approaches.
Spat. Spatio-Temporal Epidemiol. 2011, 2, 125–133. [CrossRef]
27. Rojas, L.I.; Barcellos, C.; Peiter, P. Utilizaçäo de mapas no campo da epidemiologia no Brasil reflexöes sobre
trabalhos apresentados no IV Congresso Brasileiro de Epidemiologia. Inf. Epidemiol. Sus. 1999, 8, 27–35.
[CrossRef]
28. Carvalho, M.S.; Souza-Santos, R. Análise de dados espaciais em saúde pública: Métodos, problemas,
perspectivas. Cad SaúDe PúBlica 2005, 21, 361–378. [CrossRef] [PubMed]
29. Eisen, L.; Lozano-Fuentes, S. Use of Mapping and Spatial and Space-Time Modeling Approaches in
Operational Control of Aedes aegypti and Dengue. PLoS Negl. Trop. Dis. 2009, 3, e411. [CrossRef] [PubMed]
30. Galli, B.; Chiaravalloti-Neto, F. Modelo de risco tempo-espacial para identificação de áreas de risco para
ocorrência de dengue. Rev. Saúde Pública 2008, 42, 656–663. [CrossRef] [PubMed]
31. Barbosa, G.L.; Lourenço, R.W. Análise da distribuição espaço-temporal de dengue e da infestação larvária no
município de Tupã, Estado de São Paulo. Rev. Soc. Bras. Med. Trop. 2010, 43, 145–151. [CrossRef]
32. Morrison, A.C.; Getis, A.; Santiago, M.; Rigau-Perez, J.G.; Reiter, P. Exploratory space-time analysis of
reported dengue cases during an outbreak in Florida, Puerto Rico, 1991–1992. Am. J. Trop. Med. Hyg. 1998,
58, 287–298. [CrossRef] [PubMed]
33. Kan, C.-C.; Lee, P.-F.; Wen, T.-H.; Chao, D.-Y.; Wu, M.-H. Two clustering diffusion patterns identified from
the 2001–2003 dengue epidemic, Kaohsiung, Taiwan. Am. J. Trop. Med. Hyg. 2008, 79, 344–352. [CrossRef]
[PubMed]
34. Oliveira, F.L.P.; Cançado, A.L.F.; de Souza, G.; Moreira, G.J.P.; Kulldorff, M. Border analysis for spatial
clusters. Int. J. Health Geogr. 2018, 17, 5. [CrossRef]
35. Lawson, A. Statistical Methods in Spatial Epidemiology; Wiley: Chichester, UK, 2001.
36. Pfeiffer, D.U.; Robinson, T.; Stevenson, M.; Stevens, K.; Rogers, D.; Clement, A. Spatial analysis in epidemiology.
Oxf. Biol. 2008, 19, 148–149, (Paperback). [CrossRef]Sustainability 2019, 11, 3572 14 of 14
37. Kulldorff, M. An isotonic spatial scan statistic for geographical disease surveillance. J. Natl. Inst. Public Health
1999, 48, 94–101.
38. Duncan, E.W.; White, N.M.; Mengersen, K. Spatial smoothing in Bayesian models: A comparison of weights
matrix specifications and their impact on inference. Int. J. Health Geogr. 2017, 16. [CrossRef] [PubMed]
39. ESRI. 2018. Available online: https://pro.arcgis.com/en/pro-app/tool-reference/spatial-statistics/an-overview-
of-the-spatial-statistics-toolbox.htm (accessed on 10 April 2019).
40. Choy, E.A.; Mohd-Khair, E.; Atan, A.; Sahani, M.; Mohd-Ali, Z. Perubahan Cuaca Dan Penyakit Denggi:
Kajian Kes Di Daerah Seremban, Negeri Sembilan, Malaysia. J. E-Bangi 2011, 8, 38–48.
41. Nasir-Ahmad, N.S.B.; Mustafa, F.B. Analisis perubahan guna tanah Negeri Sembilan melalui aplikasi Sistem
Maklumat Geografi (GIS). GEOGRAFIA Online. Malays. J. Soc. Space 2019, 15, 113–131. [CrossRef]
42. Ministry of Health Malaysia. Kenyataan Akhbar Ketua Pengarah Kesihatan Malaysia. Situasi Semasa
Demam Denggi Zika dan Chikungunya di Malaysia. 2018. Available online: http://www.moh.gov.my/index.
php/database_stores/store_view_page/17/1119 (accessed on 11 March 2019).
43. Abdul Samad, H.; Shaharudin, I. The Emerging Kuala Lumpur Extended Mega Urban Region (KLEMUR):
Implications on Urban Prosperity in Malaysia. Int. J. Malay World Civilis. 2017, 5, 67–74.
44. Mutheneni, S.R.; Mopuri, R.; Naish, S.; Gunti, D.; Upadhyayula, S.M. Spatial distribution and cluster analysis
of dengue using self organizing maps in Andhra Pradesh, India, 2011–2013. Parasite Epidemiol. Control 2018,
3, 52–61. [CrossRef] [PubMed]
45. Barbosa, G.L.; Donalisio, M.R.; Stephan, C.; Lourenco, R.W.; Andrade, V.R.; de Brito Arduino, M.; de-Lima
VL, C. Spatial Distribution of the Risk of Dengue and the Entomological Indicators in Sumare, State of Sao
Paulo, Brazil. Plos Negl. Trop. Dis. 2014, 8, e2873. [CrossRef] [PubMed]
46. Eryando, T.; Susanna, D.; Pratiwi, D.; Nugraha, F. Standard Deviational Ellipse (SDE) models for malaria
surveillance, case study: Sukabumi district-Indonesia, in 2012. Malar. J. 2012, 11 (Suppl. 1), P130. [CrossRef]
47. Alexandersson, A. Graphing confidence ellipses: An update of ellip for Stata 8. Stata J. 2004, 4, 242–256.
[CrossRef]
48. Jabatan Perancangan Bandar dan Desa. Data Digital; Jabatan Perancangan Bandar dan Desa: Kuala Lumpur,
Malaysia, 2017.
© 2019 by the authors. Licensee MDPI, Basel, Switzerland. This article is an open access
article distributed under the terms and conditions of the Creative Commons Attribution
(CC BY) license (http://creativecommons.org/licenses/by/4.0/).You can also read