THE BRIDGE CENTER Offering Memorandum - Lone Tree, Colorado - LoopNet
←
→
Page content transcription
If your browser does not render page correctly, please read the page content below
THE BRIDGE CENTER
           Lo ne Tree, C o lo rad o

          Offering Memorandum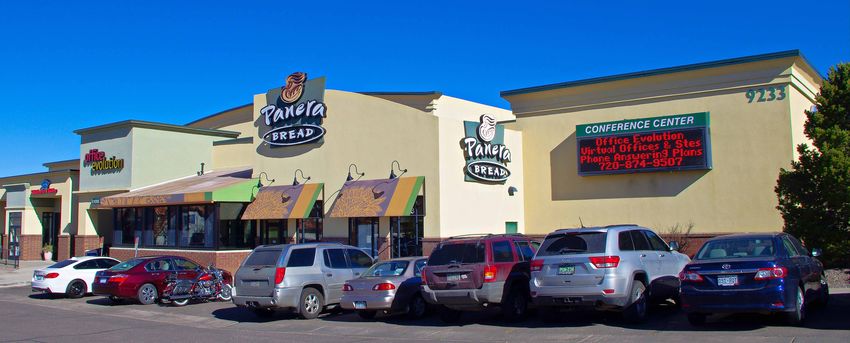
NON-ENDORSEMENT
& DISCLAIMER NOTICE
C ON F ID E N T IA LITY & DIS CLA IMER
The information contained in the following Marketing Brochure is proprietary and strictly confidential. It is intended to be reviewed only by
the party receiving it from Marcus & Millichap and should not be made available to any other person or entity without the written consent of
Marcus & Millichap. This Marketing Brochure has been prepared to provide summary, unverified information to prospective purchasers, and
to establish only a preliminary level of interest in the subject property. The information contained herein is not a substitute for a thorough due
diligence investigation. Marcus & Millichap has not made any investigation, and makes no warranty or representation, with respect to the income
or expenses for the subject property, the future projected financial performance of the property, the size and square footage of the property and
improvements, the presence or absence of contaminating substances, PCB’s or asbestos, the compliance with State and Federal regulations, the
physical condition of the improvements thereon, or the financial condition or business prospects of any tenant, or any tenant’s plans or intentions
to continue its occupancy of the subject property. The information contained in this Marketing Brochure has been obtained from sources we
believe to be reliable; however, Marcus & Millichap has not verified, and will not verify, any of the information contained herein, nor has Marcus
& Millichap conducted any investigation regarding these matters and makes no warranty or representation whatsoever regarding the accuracy
or completeness of the information provided. All potential buyers must take appropriate measures to verify all of the information set forth herein.
Marcus & Millichap is a service mark of Marcus & Millichap Real Estate Investment Services, Inc.
© 2017 Marcus & Millichap. All rights reserved.

N ON - ENDOR S EMENT NOTICE
Marcus & Millichap is not affiliated with, sponsored by, or endorsed by any commercial tenant or lessee identified in this marketing package. The
presence of any corporation’s logo or name is not intended to indicate or imply affiliation with, or sponsorship or endorsement by, said corporation
of Marcus & Millichap, its affiliates or subsidiaries, or any agent, product, service, or commercial listing of Marcus & Millichap, and is solely
included for the purpose of providing tenant lessee information about this listing to prospective customers.

ALL PROPE RTY SHOW ING S A RE BY A P P OI NTM ENT ONLY.
PLEASE C ONSULT YO UR MA RCUS & M I LLI CHA P A G ENT FOR M ORE DETA I L S.
THE BRIDGE CENTER
         LONE TREE, COLORADO

EXCLUSIVELY LISTED BY

                    BARRY HIGGINS
            Senior Vice President Investments
                     Denver, Colorado
                   Office 303.328.2012
           Barry.Higgins@marcusmillichap.com
                  License CO EA 748415

 O F F I C E S N AT I O N W I D E A N D T H R O U G H O U T C A N A D A

             WWW.MARCUSMILLICHAP.COM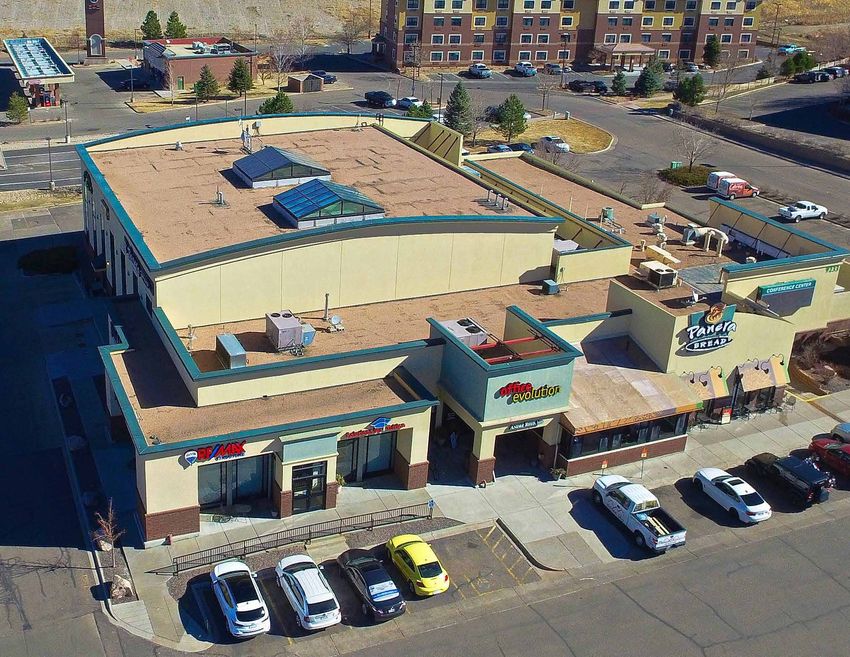
THE BRIDGE CENTER
                                                     LONE TREE, COLORADO

                                            TABLE OF CONTENTS

01   EXECUTIVE SUMMARY
     SECTION 1
     Investment Overview           •   Investment Highlights           23   COMPETITIVE COMPARABLES
                                                                            SECTION 4
                                                                            Sales Comparables   •   Rent Comparables

07   PROPERTY DESCRIPTION
     SECTION 2
     Property Details       •    Regional Map    •   Property Photos   33   MARKET OVERVIEW
                                                                            SECTION 5
                                                                            Location Overview • Location Highlights
                                                                            Market Aerial • Demographics

15   FINANCIAL ANALYSIS
     SECTION 3
     Pricing Details    •       Operating Data   •   Rent Roll

                                                                                                EXCLUSIVELY LISTED BY: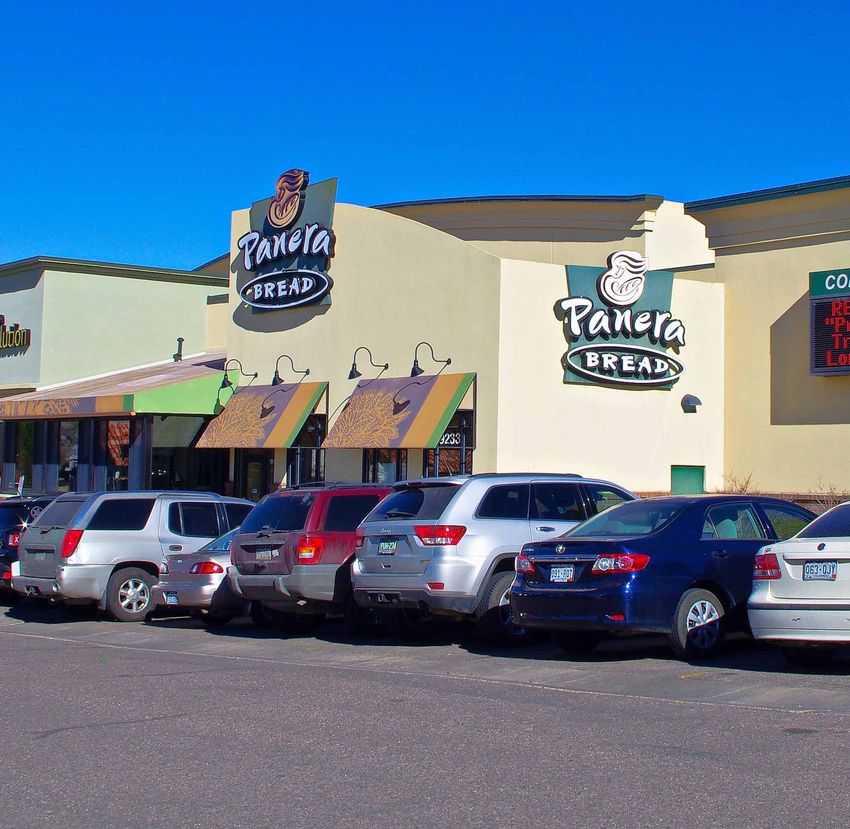
This information has been secured from sources we believe to be reliable, but we make no representations or warranties, expressed or implied, as to the accuracy of the
information. References to square footage or age are approximate. Buyer must verify the information and bears all risk for any inaccuracies. Any projections, opinions, as-
sumptions or estimates used herein are for example purposes only and do not represent the current or future performance of the property. Marcus & Millichap Real Estate
           Investment Services is a service mark of Marcus & Millichap Real Estate Investment Services, Inc. © 2017 Marcus & Millichap ACT ID Y0050314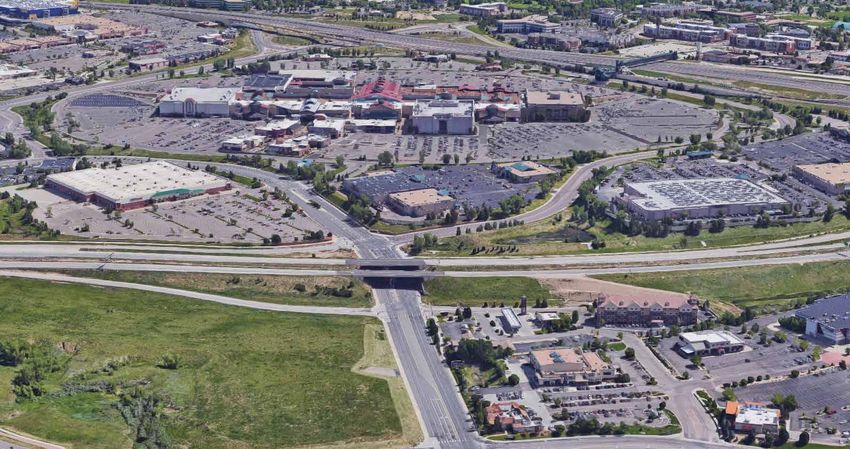
THE BRIDGE CENTER
                                                          SUMMARY
                                                         EXECUTIVE

    T H E   B R I D G E   C E N T E R              //   E X E C U T I V E   S U M M A R Y
1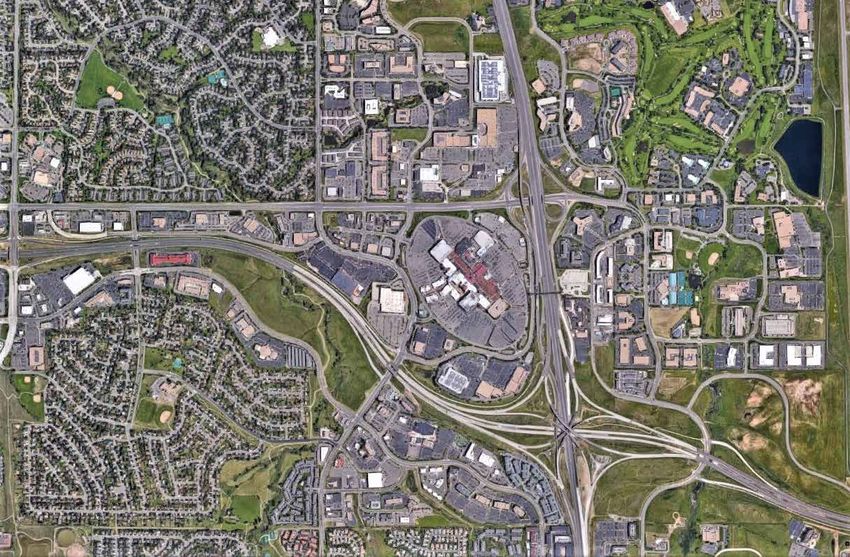
INVESTMENT OVER VIEW
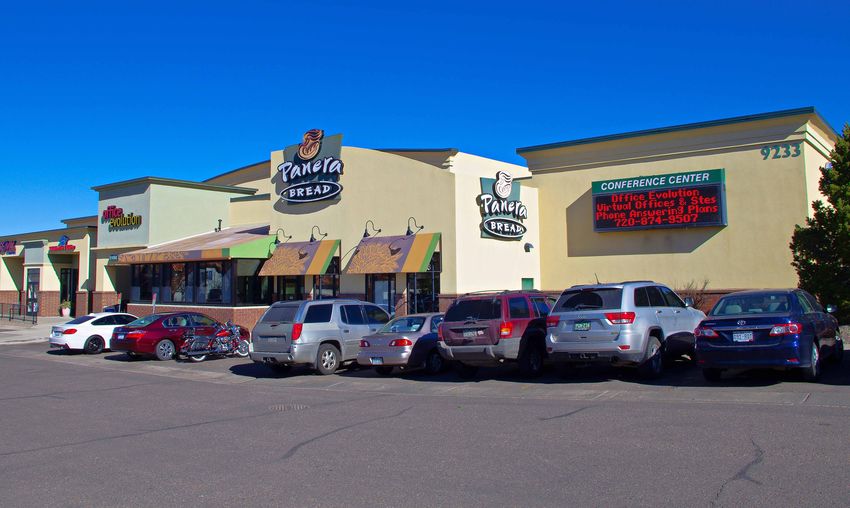
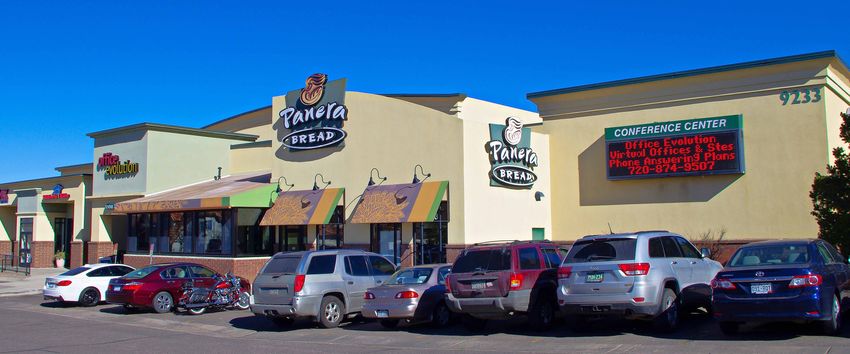
Marcus & Millichap is pleased to exclusively present to qualified investors the Bridge Center, located in the Park Meadows
T H E
Entertainment District of Lone Tree, Colorado. This 98 percent occupied office/retail investment opportunity is anchored by
Panera Bread, a national brand restaurant retailer.
B R I D G E
Bridge Center is a highly visible asset just south of the General Growth Park Meadows Mall, a 1.6 million square foot shopping
mall including anchor tenants such as Dillard’s, JCPenney, Macy’s and Nordstrom. The average household income is above
$140,000 within a three mile radius, and the population is estimated to increase over nine percent over the next five years.
C E N T E R
It sits just off South Yosemite Street and Park Meadows Boulevard just two blocks from the
C-470 interchange. Bridge Center is virtually in the heart of shopping, entertainment and
the major employment district of Lone Tree.
//
The anchor, Panera Bread, has been in occupancy for 15 years and in 2017 extended their
lease for an additional ten years. The Panera Bread system consists of approximately 2,200
E X E C U T I V E
locations in the United States and Canada. Having been publicly traded on NASDAQ (PNRA)
for many years, Panera was recently acquired by JAB Holding Company, in a $7.5 billion
transaction. The Franchisee who owns and operates this location also owns and operates all
38 Panera Bread locations Colorado along with 98 other Panera Bread locations in several
other states.
S U M M A R Y
24,486 SQUARE FOOT
SHOPPING CENTER IN This investment opportunity is being offered free of debt thus allowing a new purchaser the
LONE TREE, CO
opportunity to place new financing on the property at today’s historically low interest rates.
2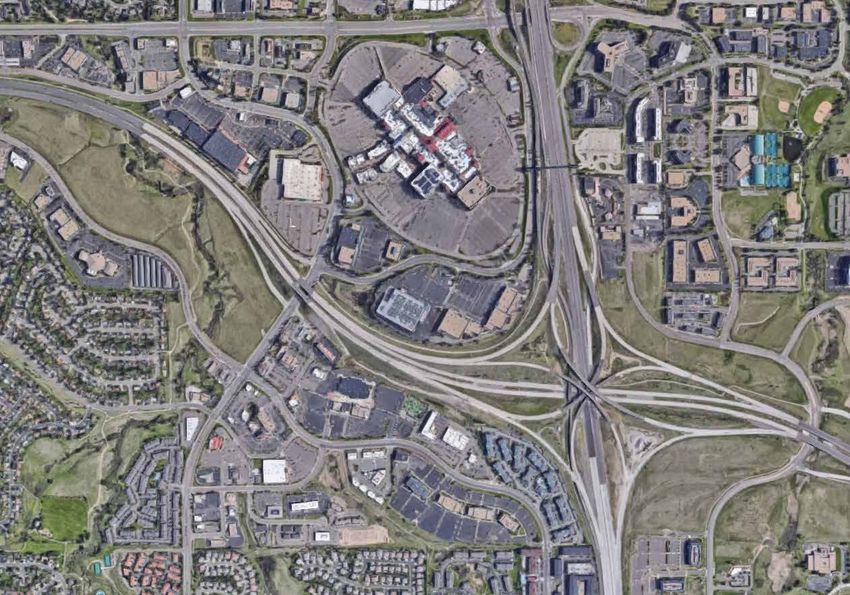
INVESTMENT
                                                             HIGHLIGHTS

►►   Satellite Retail/Office Space to Park Meadows Mall
►►   98.98% Occupied
►►   Anchored by Panera Bread
 Panera Bread’s lease Extended to 04/2027 with Options, 5%
►►

Escalator in Year Six and Options

►►   Some Medical Tenants On Site

►►   Highly Visible with High Traffic Counts
 Outstanding Demographics with Average Household Income
►►

Exceeding $140,000

►►   One of the Most Dense Retail Areas in the Denver MSA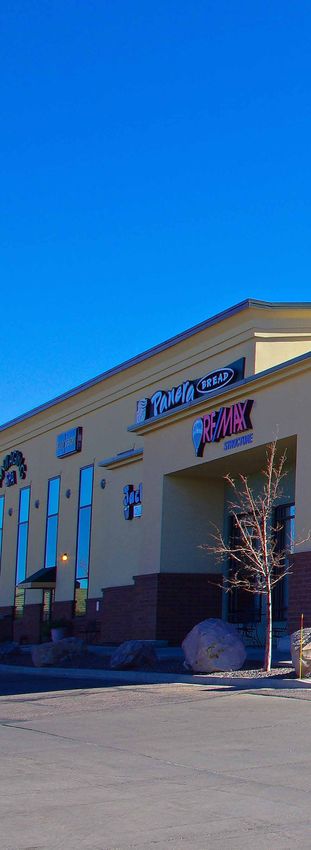
OFFERING HIGHLIGHTS

                    THE BRIDGE CENTER
T H E

                    9233 Park Meadows Drive, Lone Tree, CO 80124
B R I D G E

                              O F F E RIN G P RIC E                   C A P RAT E             CASH FLOW

                    $6,800,000                                       7.17%             9.07%
C E N T E R
//
E X E C U T I V E

                                                 Price/SF                                      $277.71

                                                 Occupancy                                     98.98%

                                                 Net Leasable Area                              24,486

                                                 Year Built                                       1999
S U M M A R Y

                                                 Lot Size                                      3.50 AC

                                                 Construction                       Reinforced Concrete

                                                                                     2231-03-3-05-019
                                                 Assessor APN                        2231-03-3-05-020
                                                                                      (Douglas County)

                                                 Zoning                                             PD

4
THE BRIDGE CENTER
Regional Map
T H E B R I D G E C E N T E R // P R O P E R T Y D E S C R I P T I O N
5Local Map
THE BRIDGE CENTER
T H E B R I D G E C E N T E R // P R O P E R T Y D E S C R I P T I O N
6SUBJECT
RETAIL MARKET AERIAL
T H E B R I D G E C E N T E R // E X E C U T I V E S U M M A R Y
7AERIAL
T H E
B R I D G E
QUEBEC VILLAGE CENTENNIAL PROMENADE
C E N T E R
MEADOWS MARKETPLACE
PARK MEADOWS MALL
//
E X E C U T I V E
PROPOSED RE-DEVELOPMENT SITE
SOUTH DENVER MARKETPLACE
S U M M A R Y
SUBJECT PROPERTY
COSTCO
ENTERTAINMENT DISTRICT
8AERIAL
Located less than one mile from Bridge Center, Park Meadows Mall is Colorado’s biggest and best shopping mall and known as “Colorado’s
only retail resort”. It boasts 185 stores and restaurants, and is anchored by Dillard’s, Nordstrom, Dick’s Sporting Goods and Macy’s. Park
Meadows is also home to the Colorado flagship stores of several national tenants, including Arhaus Furniture, Nordstrom and Pottery
S U M M A R Y
Barn. In addition to the 12 quick-serve restaurants in the dining hall, there are 14 full-service restaurants on premise. Park Meadows
Mall is a recipient of ICSC’s International Design and Development Award and the Urban Land Institutes Award of Excellence, and is
currently owned by General Growth Properties.
E X E C U T I V E
PARK MEADOWS MALL
//
C E N T E R
B R I D G E
COSTCO
T H E
PROPOSED RE-DEVELOPMENT SITE
SUBJECT PROPERTY
9This information has been secured from sources we believe to be reliable, but we make no representations or warranties, expressed or implied, as to the accuracy of the
information. References to square footage or age are approximate. Buyer must verify the information and bears all risk for any inaccuracies. Any projections, opinions, as-
sumptions or estimates used herein are for example purposes only and do not represent the current or future performance of the property. Marcus & Millichap Real Estate
Investment Services is a service mark of Marcus & Millichap Real Estate Investment Services, Inc. © 2017 Marcus & Millichap ACT ID Y0050314A N A LY S I S
FINANCIAL
FINANCIAL
ANALYSIS
ANALYSIS
F I N A N C I A L
//
THEBRIDGE
THE BRIDGECENTER
CENTER
C E N T E R
B R I D G E
T H E
17
11PRICING DETAILS OPERATING DATA
PRICE $6,800,000 INCOME YEAR 1
Down Payment 30% / $2,040,000 Scheduled Base Income $766,284
T H E
Price Per SqFt $277.81 Expense Reimbursements $140,512
Effective Gross Income $906,796
Rentable Built Area (RBA) 24,486
B R I D G E
Vacancy (2.5%) ($22,670)
Occupancy 98.98%
Gross Effective Income $884,126
RETURNS
Total Operating Expenses $396,734
CAP Rate 7.17%
C E N T E R
Net Operating Income $487,392
Cash-on-Cash 9.07%. Debt Service $302,284
Debt Coverage Ratio 1.61 Net Cash Flow After Debt Service $185,108 (9.07%)
FINANCING OPERATING EXPENSES YEAR 1
//
Loan Amount 70% / $4,760,000 Real Estate Taxes* $219,000
F I N A N C I A L
Loan Type New Loan Insurance $8,000
Interest Type 4.875% Repairs & Maintenance $10,207
Trash $3,594
Amortization 30 Years
Water & Sewer $10,771
Term 10 Years
Gas & Electric $83,258
A N A LY S I S
*Loan information is subject to change. Contact your Marcus and
Janitorial $18,951
Millichap Capital Corporation representative.
HVAC Maintenance $6,291
Professional Fees $6,275
Fire, Security & Misc. $3,720
Management Fee (3% of EGI) $26,667
Total Expenses $396,734
Expenses/SF $16.20
*Lone Tree Business Improvement District includes real estate taxes, snow
removal, lot sweeping, landscaping and sprinkler repair and maintenance.
12RENT ROLL
SQUARE ANNUAL $/ ESCALATION ESCALATED EXPENSE
TENANT LEASE COMM. LEASE EXP. RENT/MO. LEASE TYPE OPTIONS
FEET SF DATE(S) RENT(S) REIMB.
A N A LY S I S
Vacant 250 $24.00 $500 NNN $338
Dr. Allison Fall 500 03/01/2016 04/30/2019 $33.60 $1,400 Gross One, 3 Year Option
06/01/2019 $7,800
Eco Salon 2,216 06/01/2016 02/28/2021 $40.61 $7,500 Gross Two, 5 Year Options
06/01/2020 $8,112
F I N A N C I A L
Allstate Insurance 1,000 07/01/2018 06/30/2023 $24.00 $2,000 Gross N/A Base Year One, 5 Year Option
06/01/2019 $23,809
06/01/2020 $24,195
06/01/2021 $24,581
2015 Base
//
Office Evolution 9,266 06/01/2016 05/31/2026 $29.08 $23,423 06/01/2022 $24,967
Year
06/01/2023 $25,353
C E N T E R
06/01/2024 $25,739
06/01/2025 $26,125
Panera Bread 4,000 04/01/2017 03/31/2027 $27.83 $9,276 NNN 04/01/2022 $9,833.33 $4,460 Four, 5 Year Options
B R I D G E
Panera Bread* N/A 04/01/2017 03/31/2027 N/A $1,686
T H E
Sandler 250 06/01/2014 05/31/2019 $75.59 $1,638 Gross One, 5 Year Option
01/01/2019 $2,021
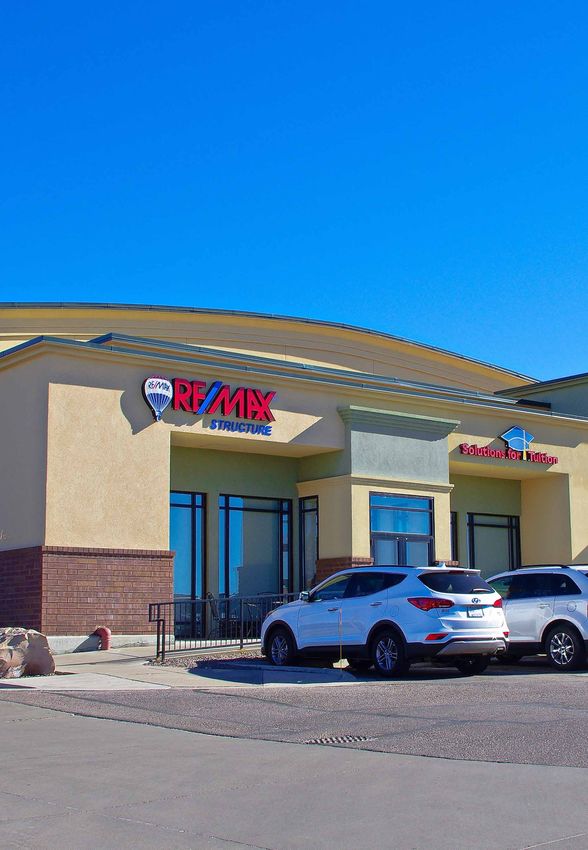
Solution for Tuition 500 01/01/2018 12/31/2020 $48.00 $2,000 Gross One, 5 Year Option
01/01/2020 $2,042
*Additional Rent for Catering Area, Exterior Facilities, and Common Area Bathrooms
13RENT ROLL CONT’D.
SQUARE ANNUAL $/ ESCALATION ESCALATED EXPENSE
TENANT LEASE COMM. LEASE EXP. RENT/MO. LEASE TYPE OPTIONS
FEET SF DATE(S) RENT(S) REIMB.
T H E
09/04/2019 $3,957.69
B R I D G E
09/04/2020 $4,155.57
RE/MAX 2,004 09/05/2015 09/04/2023 $21.50 $3,769 NNN $2,508 One, 5 Year Option
09/04/2021 $4,363.35
09/04/2022 $4,581.52
04/30/2019 $4,616.63
C E N T E R
04/30/2020 $4,801.30
RE/MAX 2,500 05/01/2016 09/04/2023 $20.49 $4,439 NNN $3,129
04/30/2021 $4,993.35
04/01/2022 $5,193.08
//
Waxing the City 2,000 01/01/2014 09/30/2019 $20.92 $3,626 Gross 01/01/2019 $3,771.00 One, 5 Year Option
F I N A N C I A L
Key Bank ATM
N/A 06/01/2018 5/31/2021 N/A $2,600 Gross Two, 5 Year Options
Drive-Thru
Total Square Feet: 24,486 Total Monthly Income: $63,857 Monthly Expense Reimbursement: $10,435
Total Occupied
24,236 Total Annual Income: $766,284 Annual Expense Reimbursement: $125,220
Square Feet:
A N A LY S I S
Total Occupancy: 98.98%
14This information has been secured from sources we believe to be reliable, but we make no representations or warranties, expressed or implied, as to the accuracy of the
information. References to square footage or age are approximate. Buyer must verify the information and bears all risk for any inaccuracies. Any projections, opinions, as-
sumptions or estimates used herein are for example purposes only and do not represent the current or future performance of the property. Marcus & Millichap Real Estate
Investment Services is a service mark of Marcus & Millichap Real Estate Investment Services, Inc. © 2017 Marcus & Millichap ACT ID Y0050314THE BRIDGE CENTER
PROPERTIES
COMPARABLE
T H E B R I D G E C E N T E R // C O M P A R A B L E P R O P E R T I E S
175
2
3
4
1
18
T H E B R I D G E C E N T E R // C O M P A R A B L E P R O P E R T I E SLEASE COMPARABLES – SUMMARY
P R O P E R T I E S
C O M P A R A B L E
TH E BRI DGE CE NT E R
1
M E A DO WS SHO PPI NG CE NTE R
2
L O N E TR E E E NTE RTAI NME NT DI STR IC T 1
//
3
M E LL O W MUSHR O O M
C E N T E R
4
S T RAWB E R RY HI L L
5
PA RK ME ADO WS STR I P CE NTE R
B R I D G E
T H E
19T H E
B R I D G E
C E N T E R LEASE COMPARABLES
1 MEAD OWS S H O P P I N G C E N TE R
THE BRIDGE CENT E R
//
8848 Maximus Dr. Lone Tree, CO
9233 Park Meadows Dr. Lone Tree, CO
C O M P A R A B L E
ASKING RENT/SF $20.00-$25.00
Occupancy 87.00%
ASKING RENT/SF $24.00-$35.00
Available SF 2,587 SF
Occupancy 98.98%
Lease Type NNN
Available SF 250 SF
Date of Survey 8/14/2018
Lease Type NNN
P R O P E R T I E S
ADDITIONAL INFO
Year Built 1986 / 2005
ADDITIONAL INFO Gross Leasable Area 19,755 SF
Year Built 1999
KEY TENANTS
Gross Leasable Area 24,486 SF
Clothes Mentor Arch Pizza
California Closets Mr. Donut
20P R O P E R T I E S
C O M P A R A B L E
2 L ONE T R EE EN T ERTA IN M ENT D I S T R I C T 1 3 MELLOW MU S H RO O M
9535 Park Meadows Dr. Lone Tree, CO 9271 Park Meadows Dr. Lone Tree, CO
ASKING RENT/SF $22.00-$26.00 ASKING RENT/SF $24.00
//
Occupancy 87.27% Occupancy 100%
C E N T E R
Available SF 2,600 SF Available SF 6,795 SF
Lease Type NNN Lease Type NNN
Date of Survey 8/14/2018 Date of Survey 8/14/2018
B R I D G E
ADDITIONAL INFO ADDITIONAL INFO
Year Built 2000 Year Built 2000
Gross Leasable Area 20,416 SF Gross Leasable Area 6,795 SF
T H E
KEY TENANTS KEY TENANTS
Rio Grande Mexican Restaurant Xanadu Total Wellness
Robusto Room Woodhouse Day Spa
Swingers Lounge and Indoor Golf
21T H E
B R I D G E
C E N T E R
4 S TRAW BE RRY H IL L 5 PARK MEADO W S S TRI P C E N TE R
//
9068 Frosstrom Dr. Lone Tree, CO 10025 Park Meadows Dr. Lone Tree, CO
C O M P A R A B L E
ASKING RENT/SF $20.00 ASKING RENT/SF $18.00
Occupancy 100% Occupancy 100%
Available SF 0 SF Available SF 0 SF
Lease Type NNN Lease Type NNN
Date of Survey 8/14/2018 Date of Survey 8/14/2018
P R O P E R T I E S
ADDITIONAL INFO ADDITIONAL INFO
Year Built 2006 Year Built 2001 / 2012
Gross Leasable Area 10,000 SF Gross Leasable Area 7,314 SF
KEY TENANTS KEY TENANTS
State Farm Insurance Nail Salon Rocky Mountain Law Enforcement
Karate Studio Physical Therapy Clinic Federal Credit Union
22SA LES COMPARABLES – SUMMARY
T H E
B R I D G E
C E N T E R
THE BRIDGE CE NT E R
//
1
M E A D O W S S H OPPI NG CE NTE R
C O M P A R A B L E
2
M E L L O W M U S HR O O M
3
T H E M E A D O W S AT L O NE TR E E
4
L A K E W O O D C I T Y CE NTE R
P R O P E R T I E S
242
4
1
2
3
P TR HO EP EB RR TI Y
D GNEA M
C E N HT EE RR E // // C CO OMMP PA AR RA AB BL LE E P PR RO OP PE ER RT TI E
I ES S
25T H E
B R I D G E
C E N T E R SALES COMPARABLES
THE BRIDGE CENT E R
//
1 MEAD OWS S H O P P I N G C E N TE R
9233 Park Meadows Dr. Lone Tree, CO 8848 Maximus Dr. Lone Tree, CO
C O M P A R A B L E
SALES PRICE $6,800,000 SALES PRICE $5,128,000
Year Built 1990 Sale Date 5/30/2018
Cap Rate 7.17% Year Built 1986 / 2005
Cap Rate 6.50%
P R O P E R T I E S
Price Per SF $277.81
Price Per SF $259.58
NOT ES
Meadows Shopping Center was 100 percent occupied at the time of sale. .
26P R O P E R T I E S
C O M P A R A B L E
2 M E LL OW MU SH ROOM 3 T HE MEAD O W S AT LO N E TRE E
9271 Park Meadows Dr. Lone Tree, CO 9234 Park Meadows Dr. Lone Tree, CO
//
C E N T E R
SALES PRICE $3,215,000 SALES PRICE $5,150,000
Sale Date 6/21/2018 Sale Date 1/7/2017
Year Built 2000 Year Built 1986 / 2005
Cap Rate 6.60%
B R I D G E
Cap Rate Owner/User
Price Per SF $386.14 Price Per SF $321.25
N OTE S NOT ES
T H E
The building was vacant at the time of sale and sold to an owner user, and is The Meadows at Lone Tree is directly across the street from The Bridge Center.
next door to Subject.
27T H E
B R I D G E
C E N T E R
//
4 L A K E W OOD C ITY C E N TER
650-670 Wadsworth Blvd. Lakewood, CO
C O M P A R A B L E
SALES PRICE $8,400,000
Sale Date 2/12/2017
Year Built 1993
P R O P E R T I E S
Cap Rate 7.01%
Price Per SF $192.00
N O TE S
Lakewood City Center is located across the street from the Belmar Shopping
Center, which is Lakewood’s largest shopping destination.
28This information has been secured from sources we believe to be reliable, but we make no representations or warranties, expressed or implied, as to the accuracy of the
information. References to square footage or age are approximate. Buyer must verify the information and bears all risk for any inaccuracies. Any projections, opinions, as-
sumptions or estimates used herein are for example purposes only and do not represent the current or future performance of the property. Marcus & Millichap Real Estate
Investment Services is a service mark of Marcus & Millichap Real Estate Investment Services, Inc. © 2017 Marcus & Millichap ACT ID Y0050314THE BRIDGE CENTER
OVERVIEW
MARKET
T H E B R I D G E C E N T E R // M A R K E T O V E R V I E W
31DENVER METRO AREA
Developers Encouraged by Denver’s Strong Demographic Trends
Tight vacancy in and around urban core triggers strong rent growth. Aided by sub- Construction
4 percent retail vacancy in the Central Denver and Colorado Boulevard/Cherry Development reaches its highest level since
Creek submarkets, the metro’s overall rate continued to plummet over the past
1.6 million sq. ft. 2009 with the delivery of 1.6 million square feet.
12 months. Household growth well above national levels and intense apartment will be completed Northern submarkets receive much of this year’s
development lured retailers to the Front Range, contributing to Denver’s shrinking new supply.
T H E
vacancy. Rent growth corresponded to the strong space demand by eclipsing 4.5
percent for the second straight year ending in March. Asking rent gains in Aurora
Vacancy
B R I D G E
and West Denver were most pronounced, as the measure surpassed 10 percent in
Strong pre-leasing activity in 2018 contributes
both areas. Aurora carries potential for considerably more rent growth in the near 30 basis point to metrowide vacancy sliding to 4.8 percent. The
future, as the area’s rents are among the lowest in the metro.
decrease in vacancy decrease will mark the ninth straight year-end
vacancy drop.
Foot traffic driving retailers to set up shop in Denver. As job creation advanced at a
C E N T E R
brisk pace in the past four quarters, Denver’s retail development remained robust.
Grocery chains continued to expand their footprint with the addition of several Rents
Average asking rent logs strong growth as the figure
King Soopers and Natural Grocers locations. Fitness centers also strengthened 5.1% increase in
their presence within the metro as VASA Fitness and 24 Hour Fitness constructed climbs to $19.07 per square foot. This rise exceeds
asking rents
space in Lakewood and Castle Rock, respectively. the prior five-year growth rate of 3.6 percent.
//
M A R K E T
Investment Trends
►► Sales tempo remained steady over the past 12 months as single-tenant assets in
high-traffic locations garner extensive investor interest. Buyers place emphasis on
quick-service restaurants on Broadway and Colfax Avenue extending from the city
O V E R V I E W
center to outer-ring suburbs. Initial returns for these properties may reach into the
low-6 percent band.
►► Community centers and grocery-anchored strip centers remain attractive to out-of-
state buyers as many of these assets provide value-add opportunities. Neighborhoods
near the Denver Boulder Turnpike were areas of focus for investors, as household
formation in these parts is intense and the need for modern retail establishments
continues to grow.
* Cap rates trailing 12 months through 1Q18; 10-Year Treasury up to March 29, 2018 ►► Average cap rates for multi-tenant assets compressed 30 basis points to 6.6 percent
Sources: CoStar Group, Inc.; Real Capital Analytics
in the past four quarters as bidding intensified for well-located properties. The average
price per square foot increased 12 percent to $316 during the same period.
32DENVER METRO AREA
1st Q 18 - 12-Month Trend
O V E R V I E W
M A R K E T
EMPLOYMENT CONSTRUCTION VACANCY RENTS
2.4% increase in total
employment Y-O-Y
860,000 square feet
completed Y-O-Y
20 basis point decrease in
vacancy Y-O-Y
4.8% increase in the
average asking rent
Y-O-Y
//
• Job creation in Denver remained • Deliveries nearly doubled in the • Net absorption of more than 1 • With tightening vacancy, market
C E N T E R
strong over the past four quarters past 12 months compared with million square feet drove metro rents posted a notable gain,
as roughly 35,000 new workers the previous yearlong time frame. vacancy down to 5.1 percent. putting the average asking rent at
were staffed. Trade, transportation Northern outer-ring suburbs Vacancy has decreased by an $18.08 per square foot. This
and utilities added about 8,000 received much of the new supply, average of 50 basis points each increase sits well above the
positions, supported by amplified specifically the Northeast Denver year ending in March since the previous five-year average of 3.2
industrial development. submarket, where roughly start of the economic expansion. percent.
B R I D G E
• Employment growth in the leisure 360,000 square feet was added • Despite more than 170,000 • With revitalization efforts planned
and hospitality sector gained to inventory. square feet completed in Central for parts of West Denver,
momentum in the past 12 months • About 1.2 million square feet of Denver, strong demand helped specifically in the Sun Valley
as approximately 6,500 jobs were retail space is underway, with the submarket retain one of the neighborhood, the area’s strong
created. completions extending into late lowest vacancy rates in the rent growth should persist in the
T H E
2019. metro. near future.
2nd most highly educated #1 Best Places 6th Highest
2nd Best State to live
STATE IN THE NATION – FORBES
FOR BUSINESS AND Income County
– CENSUS BUREAU
CAREERS In The U.S.
– FORBES – CNN MONEY
33DENVER METRO AREA
Submarket Trends
Lowest Vacancy Rates 2Q18
T H E
Y-O-Y
Vacancy Asking Y-O-Y %
Submarket BasisPoint
Rate Rent Change
Change
B R I D G E
Colorado Boulevard-
2.5% -20 $28.99 2.6%
Cherry Creek
C E N T E R
*Forecast **2017-2022
Sales Trends Central 3.6% -20 $20.32 3.7%
Investor Sentiment Remains Positive Despite Retail’s Evolving Climate
Downtown 3.8% -170 $25.37 4.5%
►► Multi-Tenant: Limited listings have kept sales activity among multi-tenant properties
//
restrained yet consistent in the past five years as owners opted to hold assets amid
tight vacancy. Southwest 4.3% -140 $14.36 -14.4%
M A R K E T
►► Single-Tenant: Investor demand for single-tenant assets continued to strengthen in
the past 12 months. Fast-casual restaurants generating initial yields in the high-5 West 5.0% 110 $17.04 10.1%
percent range garnered considerable interest
Northeast 5.2% 10 $16.46 1.7%
O V E R V I E W
Outlook: Strong household formation in the Southeast 5.5% 60 $19.87 2.8%
outermost suburbs will lure retailers to the
area, leading to continued investor interest Aurora 5.7% -170 $15.44 14.3%
in Denver’s retail market.
South 5.7% 100 $19.24 7.5%
Northwest 6.7% -140 $15.65 8.2%
Overall Metro 5.1% -20 $18.08 4.8%
* Trailing 12 months through 1Q18 over previous time period
Pricing trend sources: CoStar Group, Inc.; Real Capital Analytics
34CITY OF LONE TREE
The City of Lone Tree was incorporated in 1995 and is 10 square miles in size and
currently boasts a Median Household Income of $149,232. It is a premier Colorado
community connected by great neighborhoods, vibrant public spaces, a beautiful
natural environment, and thriving businesses.
O V E R V I E W
The City of Lone Tree is part of the Denver South Economic Development Partnership,
and at the strategic crossroads of C-470 and I-25. 2016 will be a record year for
transportation and community investment projects within the City of Lone Tree. Over
$500 million expected in current and upcoming projects. Part of this investment will
M A R K E T
result in an increased I-25 capacity from six lanes to eight lanes and expanded Lincoln
RidgeGate East
Avenue north-bound on-ramp to two lanes. Other improvements as a result of this
investment are a new Lincoln Pedestrian Bridge, Lone Tree Library and RTD Southeast
Light-Rail
Light Rail•Extension to name a few. Construction Begins
RidgeGate East Project
//
The median Single Family Home Sales Price is $675,000 and the Average Single
C E N T E R
• Lone Tree City Center will be the
Family Home Sales Price is $764,315. The unemployment rate is 2.6 percent with city
population doubling during business hours from a resident population of 13,175 to a
primary
daytime population TOD
of 25,216. There is 3.6location and
million square feet include
of Retail space and 3.1
up to 11 million SF office space
million square feet of Office space. The 2015 vacancy rates were 3.6 percent and 9.2
B R I D G E
percent respectively. In 2015 there was $1.6 Billion in total Retail Sales.
• RidgeGate East Village will
There are over 39,000,00 square feet of office space, attracting employers including
Charles Schwab, include up to 2.3
Level 3 Communications million
and Sky SF Center.
Ridge Medical retailCharles
T H E
sector employerand upCounty.
to Level
7,000 new homes
Schwab has 3,200 employees as of January 1, 2016 and they are the largest private
in Douglas 3 Communications, a Fortune 500 employer,
has 1,200 employees in the Lone Tree community. Sky Ridge Medical Center has
3,000 employees including both staff and contract positions. As more residential and
commercial development continues to flourish in the area we see a continued demand
for employment expansion and growth in Retail sales driving new retailers to the area
and maintaining a steady increase in rental rates for existing and future Retail space.
35design stage with a master plan expected to be upg
approved in 2016. Thanks to support from Douglas cre
County, Entertainment District visitors will also sid
enjoy a new trail connection providing direct access sin
LONE TREE BUSINESS IMPROVEMENT DISTRICT between the Entertainment District and the Lincoln on
Light Rail Station. an
In 2015, property owners in the Entertainment District came together for
the first time as a unified group to establish a new Business Improvement Pri
Ma
District (BID). A BID is a public-private partnership designed to enhance
–f
economic development within its boundaries. The BID boundary includes
and
T H E
most of the businesses located on the north side of Park Meadows Drive. Art
As a statutorily authorized entity, a BID has the authority to maintain and am
B R I D G E
construct improvements and promote and market its facilities. To raise the
revenue, a BID can levy ad valorem property taxes, charge fees or tolls, Bru
and create special assessments. ow
ext
C E N T E R
int
In the summer of 2015, the Lone Tree BID was initiated by a petition
rec
from property owners that owned more than 50 percent of the land and Mu
assessed value of the District. As a result of the petition, the City Council Sta
//
incorporated the BID by ordinance on September 1, 2015. Subsequently, ar
the BID Board of Directors referred tax questions to its voters to provide Sky
M A R K E T
revenue for its operations. In the November election, property owners Ent
voted to unanimously approve the BID’s taxing authority. On December Creating
2, 2015, a Business
the BID Board Improvement District
of Directors approved a 15 millon inc
In 2015, property owners in the Entertainment Thi
dollar property tax on their own properties to support property maintenance and upgrades within the designated BID area. The
District came together for the first time as a unified
O V E R V I E W
creation of a BID sets the groundwork for the north side of the Entertainment District, to operate as a single, unified destination
group to establish a new Business Improvement
and enables collaboration on projects throughout the Entertainment District
District in(BID).
an organized
A BIDsetting.
is a public-private partnership
designed to enhance economic development within
Many businesses have made recent improvements – further evidence its boundaries. The BID
of their commitment boundary
to the area andincludes
the visionmost of
for the
Entertainment District. United Artists Theater renewed its lease andthehas
businesses
completed located on thedollar
a multi-million north side of
interior Park
renovation,
including the installation of premium stadium seating. The BrunswickMeadows Drive.
Zone bowling centerAs a statutorily
is under authorized
new ownership entity,
by Bowlero Bowl a
BID has the authority to maintain and construct
and has completed exterior improvements, and is underway with interior improvements. Other businesses with recent enhancements
improvements and promote and market its
include Mimi’s Cafe, Mellow Mushroom, Fox and Hound Sports Tavern and Starbucks.
facilities. To raise revenue, a BID can levy ad
valorem property taxes, charge fees or tolls, and
create special assessments.
36
In the summer of 2015, the Lone Tree BID wasLONE TREE ENTER TAINMENT DISTRICT
Recent public and private investments in the Lone Tree Entertainment District show a commitment to a new vision
for the area. The Entertainment District is home to a variety of attractions, including a movie theater, bowling center,
indoor skydiving, miniature golf, hotels, an athletic club, health spas, several restaurants and financial institutions.
O V E R V I E W
The District is located east of Yosemite Street along both the north and south sides of Park Meadows Drive.
The City of Lone Tree has long recognized the value of the Entertainment DistrictEntertainment
and has always seen the potential District Im
for creating a more cohesive district and gathering place. Originally developed in the 1990s, the area has many
Recent
successful businesses, but has been challenged with fractured ownership; public and
multiple private
property investments in
management the Lone
companies; (TAP). The
M A R K E T
Tree Entertainment District show a commitment to developme
no sense of place or focal point; uncertain entries and vague boundaries;
a newnovision
champion
for the for implementing
area. a vision for
The Entertainment market ana
the District; and a lack of safe pedestrian connections. District is home to a variety of attractions, including and intervi
a movie theater, bowling center, indoor skydiving, representa
miniature golf, hotels, an athletic club, health spas, officials. Th
Over the years, there were several attempts by the City and propertyseveral
owners restaurants and a
to organize financial institutions.
collaborative The
approach City Counc
//
District is located east of Yosemite Street along the Enterta
to solving common problems. However, because there was no common bothvision,
the norththose
and efforts were
south sides of never sustained.
Park Meadows was never
C E N T E R
Still committed to the District, in 2012 the City Council engaged Drive. never well
continued p
the services of the Colorado Chapter of the Urban Land Institute’s only after a
Technical Advisory Panel (TAP). The panel included experts in real
Following t
B R I D G E
estate development, urban design, traffic engineering and market pursuit of t
analysis. They reviewed technical reports and interviewed property of a consul
Design, Ric
owners, business representatives, Lone Tree residents and elected consultants
officials. The panel then presented its findings to City Council, with focus
T H E
stakeholde
concluding that the original intent of the Entertainment District makes it un
as a destination venue was never realized in part because the District cou
the commu
vision was never well articulated. The panel encouraged continued creation in
public investment and leadership, but only after a more specific define the
several pot
vision was created. in the area
Public Commitment and Investment In 2015, ex
The City of Lone Tree has long recognized the value 37
Currently u
of the Entertainment District and has always seen in late Dec
the potential for creating a more cohesive district intersectionDEMOGRAPHICS OVER VIEW
POPULATION 1 Miles 3 Miles 5 Miles HOUSEHOLDS BY EXPENDITURE 1 Miles 3 Miles 5 Miles
2022 Projection Total Average Household Retail
$86,105 $93,148 $95,491
Expenditure
Total Population 10,650 75,454 225,612 Consumer Expenditure Top 10
2017 Estimate Categories
Total Population 9,305 70,177 204,516 Housing $22,782 $24,561 $24,994
T H E
2010 Census Transportation $14,947 $16,818 $17,204
Total Population 8,251 63,035 184,376 Shelter $14,455 $15,489 $15,766
2000 Census Personal Insurance and Pensions $8,859 $9,625 $9,850
B R I D G E
Total Population 5,171 52,582 140,806 Food $8,279 $8,937 $9,106
Current Daytime Population Health Care $5,024 $5,962 $6,154
2017 Estimate 17,972 113,111 269,293 Cash Contributions $4,051 $5,088 $5,249
HOUSEHOLDS 1 Miles 3 Miles 5 Miles Entertainment $3,932 $4,364 $4,459
Utilities $3,708 $4,102 $4,195
C E N T E R
2022 Projection
Household Furnishings and
Total Households 4,873 32,094 89,583 $2,388 $2,515 $2,544
Equipment
2017 Estimate POPULATION PROFILE 1 Miles 3 Miles 5 Miles
Total Households 4,062 28,832 79,452 Population By Age
Average (Mean) Household Size 2.38 2.45 2.55 2017 Estimate Total Population 9,305 70,177 204,516
2010 Census Under 20 23.94% 25.37% 27.32%
//
Total Households 3,625 25,551 71,149 20 to 34 Years 28.18% 20.01% 18.12%
2000 Census 35 to 39 Years 6.48% 6.68% 6.98%
M A R K E T
Total Households 1,965 19,125 50,653 40 to 49 Years 13.74% 14.88% 15.22%
Occupied Units 50 to 64 Years 18.18% 20.55% 20.20%
2022 Projection 4,873 32,094 89,583 Age 65+ 9.47% 12.54% 12.15%
2017 Estimate 4,144 29,401 81,000 Median Age 33.68 38.50 38.30
HOUSEHOLDS BY INCOME 1 Miles 3 Miles 5 Miles Population 25+ by Education Level
O V E R V I E W
2017 Estimate 2017 Estimate Population Age 25+ 6,320 48,326 137,500
$150,000 or More 29.77% 28.94% 28.77% Elementary (0-8) 0.14% 0.32% 0.35%
$100,000 - $149,000 20.78% 23.73% 24.30% Some High School (9-11) 0.99% 1.07% 1.17%
$75,000 - $99,999 10.82% 13.63% 13.51% High School Graduate (12) 15.74% 11.97% 11.90%
$50,000 - $74,999 16.31% 14.48% 14.66% Some College (13-15) 23.89% 19.19% 19.12%
$35,000 - $49,999 9.62% 7.95% 7.61% Associate Degree Only 6.74% 6.47% 6.78%
Under $35,000 12.69% 11.29% 11.14% Bachelors Degree Only 33.91% 38.19% 38.02%
Average Household Income $145,086 $141,147 $140,550 Graduate Degree 18.44% 22.35% 22.28%
Median Household Income $101,121 $104,926 $105,556
Per Capita Income $63,337 $58,007 $54,737
38THE BRIDGE CENTER
E X C L U S I V E LY L I S T E D B Y
BARRY HIGGINS
Senior Vice President Investments
Denver, Colorado
Office 303.328.2012
Barry.Higgins@marcusmillichap.com
License CO EA 748415You can also read