ASCENDAS REIT
Maybank-REITAS-SGX Singapore REIT conference
25 May 2021
←
→
Page content transcription
If your browser does not render page correctly, please read the page content below
ASCENDAS REIT Maybank-REITAS-SGX Singapore REIT conference 25 May 2021
Disclaimers
•   This presentation may contain forward-looking statements. Actual future performance, outcomes and results may differ materially from
    those expressed in forward-looking statements as a result of a number of risks, uncertainties and assumptions. Representative examples
    of these factors include (without limitation) general industry and economic conditions, interest rate trends, cost of capital and capital
    availability, availability of real estate properties, competition from other developments or companies, shifts in customer demands, shifts in
    expected levels of occupancy rate, property rental income, charge out collections, changes in operating expenses (including
    employee wages, benefits and training, property operating expenses), governmental and public policy changes and the continued
    availability of financing in the amounts and the terms necessary to support future business.

•   You are cautioned not to place undue reliance on these forward-looking statements, which are based on the current view of
    management regarding future events. No representation or warranty express or implied is made as to, and no reliance should be
    placed on, the fairness, accuracy, completeness or correctness of the information or opinions contained in this presentation. Neither
    Ascendas Funds Management (S) Ltd (“Manager”) nor any of its affiliates, advisers or representatives shall have any liability whatsoever
    (in negligence or otherwise) for any loss howsoever arising, whether directly or indirectly, from any use of, reliance on or distribution of this
    presentation or its contents or otherwise arising in connection with this presentation.

•   The past performance of Ascendas Reit is not indicative of future performance. The listing of the units in the Ascendas Reit (“Units”) on
    the Singapore Exchange Securities Trading Limited (the “SGX-ST”) does not guarantee a liquid market for the Units. The value of the Units
    and the income derived from them may fall as well as rise. Units are not obligations of, deposits in, or guaranteed by, the Manager. An
    investment in the Units is subject to investment risks, including the possible loss of the principal amount invested. Investors have no right to
    request that the Manager redeem or purchase their Units while the Units are listed on the SGX-ST. It is intended that holders of Units may
    only deal in their Units through trading on the SGX-ST.

•   This presentation is for information only and does not constitute an invitation or offer to acquire, purchase or subscribe for the Units.

                                                                                                                                                        2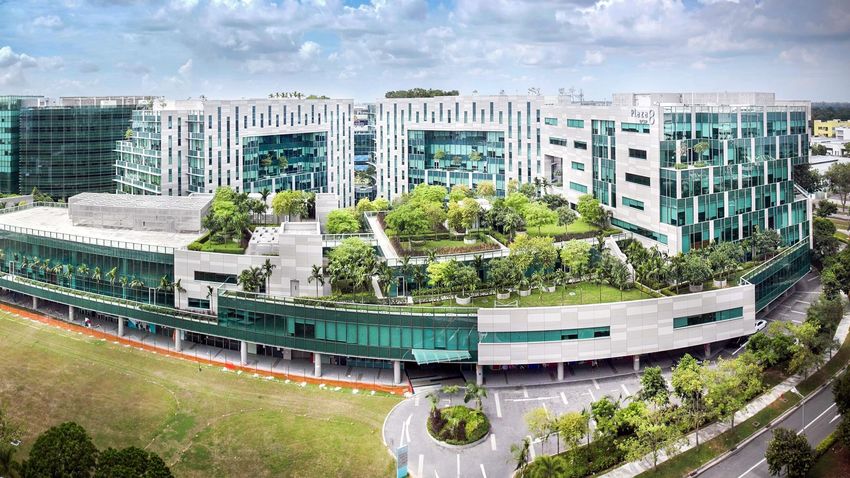
Agenda

Overview of Ascendas Reit                                   4

1Q FY2021 Key Highlights                                    15

Investment Management                                       17

Proposed Acquisition of remaining 75% interest in Galaxis   22

Capital Management                                          28

Asset Management                                            32

Market Outlook                                              41

Sustainability                                              44
                                                                 3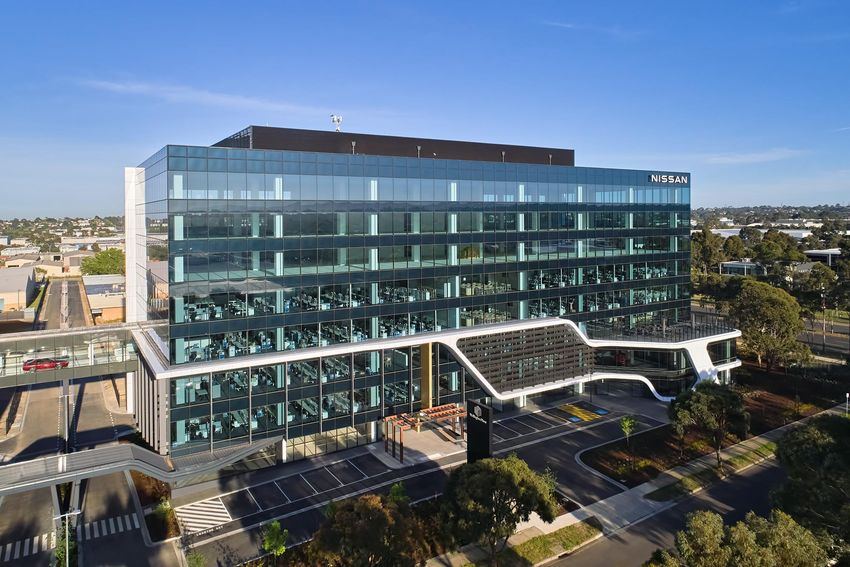
Overview of
Ascendas Reit

                ONE@Changi City, Singapore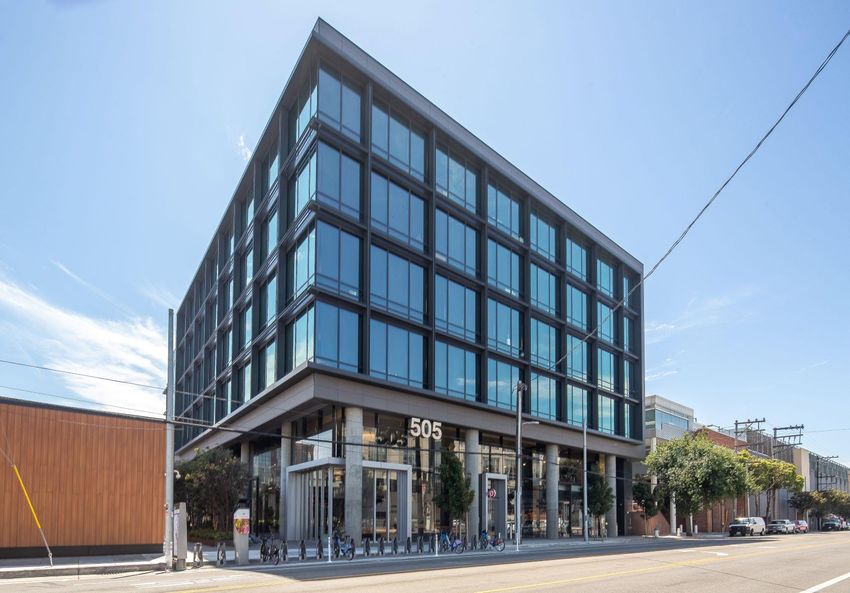
0
5,000
10,000
15,000
20,000
25,000
S$m
Sabana REIT 931
Soilbuild Business Space REIT 1,345
ARA Logos Logistics Trust 1,412
EC World REIT 1,816
Source: Bloomberg
AIMS AMP Capital REIT 1,824
Ascendas India Trust 2,651
ESR REIT 3,187
Industrial
Keppel DC REIT 3,350
Ave: S$4.5b
Cromwell European Reit 3,635
Mapletree Industrial 6,168
Frasers Logistics & Commercial Trust 6,735
Mapletree Logistics Trust 10,548
Ascendas REIT 15,123
Elite Commercial Reit 589
IREIT Global 1,242
Keppel KBS US Reit 1,806
Prime US REIT 1,912
Manulife US REIT 2,759
Commercial
OUE Commercial REIT 6,766
Ave: S$6.3b
Keppel REIT 7,764
Largest Singapore Industrial REIT
Suntec REIT 11,227
CapitaLand Integrated
Commercial Trust
22,416
United Hampshire US Reit 833
BHG Retail REIT 995
Lendlease Global Commercial REIT 1,578
LippoMalls Indo REIT 1,637
Sassuer REIT 1,858
Dasin Retail Trust 2,509
Total Assets Under Management (As at 31 December 2020)
Retail
Starhill Global REIT 3,121
▪ Largest Singapore Industrial Reit by AUM and Market Capitalisation
Ave: S$3.7b
SPH REIT 4,281
CapitaLand China Trust 4,310
Frasers Centrepoint Trust 6,650
Mapletree North Asia Commercial
Trust
8,255
Mapletree Commercial Trust 8,881
ARA US Hospitality Trust 973
▪ A constituent of many indices such as MSCI, FTSE, EPRA/NAREIT, Straits Times Index
Frasers Hospitality Trust 2,361
▪ First and largest business space and industrial REIT listed on the Singapore Exchange
Far East Hospitality Trust 2,581
Hospitality
CDL Hospitality Trust 2,854
Ave: S$3.0b
Ascott Residence Trust 6,182
First REIT 1,005
5
Parkway Life 2,067
Ave: S$1.5b
Healthcare & Others
Largest Singapore Industrial REIT
▪ Ascendas Reit’s business space and industrial properties are located across 4   Investment Properties
  developed markets – Singapore, Australia, the United States (US) and the
  United Kingdom (UK)/Europe                                                       ~ S$15 b

                United Kingdom /
                Europe
                                                                                  Market Capitalisation
United States

                                                                                   > S$12 b
                                         Singapore

                                             Australia

                                                                                      As at 31 March 2021

                                                                                                            6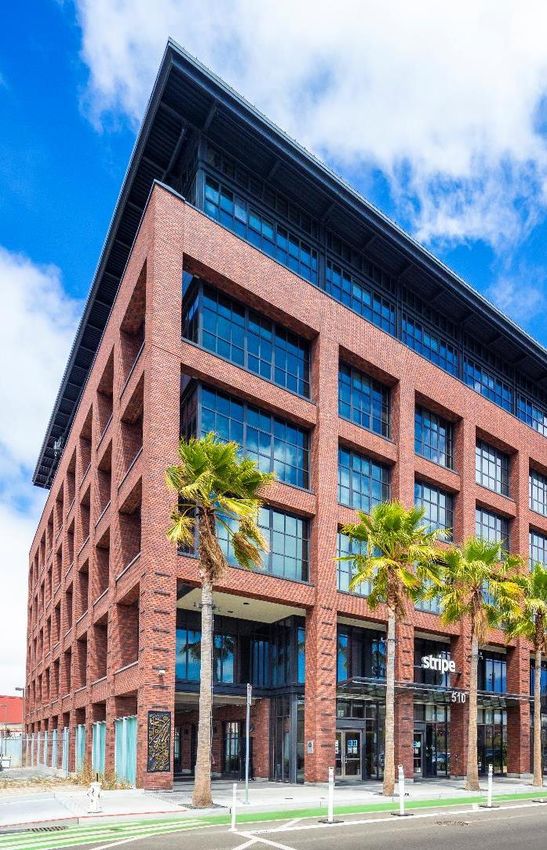
Achieved Steady Growth since IPO
Investment Properties and Distributions per Unit (DPU) has grown via
▪ Third party acquisitions: 51%
▪ Acquisitions from Sponsor: 38%
▪ Developments: 11%
              Investment Properties (S$ b)                            Distribution per Unit (cents)

                                               15.1                                               14.688
                                12.9

                                                                8.050

        0.6

    31 DEC 2003             31 DEC 2020   3 1 M AR 2 0 2 1       2003                             FY 2020
                                                             (J AN - D E C)
                                                                                                            7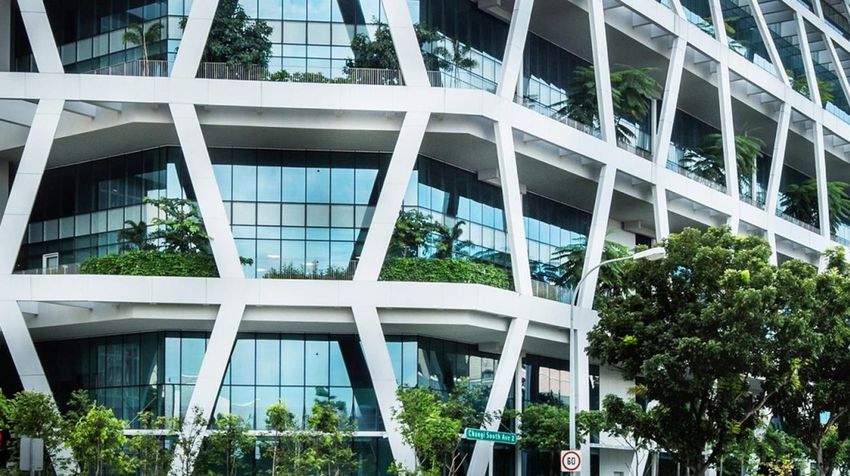
Diversified Portfolio
      By Value of Investment Properties                                                                                                                  Australia,
                                                                                                                                                         15%                                       Singapore,
       ▪ As at 31 Mar 2021, total investment properties stood at                                                                                                                                   60%
         S$15.1 b (209 properties(1))
       ▪ Diversified geographically:                                                                                                                United
                                                                                                                                                                               Total Investment
                                                                                                                                                    States, 14%                  Properties(5)
             ▪     Singapore portfolio: S$9.0 b                                                                                                                                   ~S$15.1 b
             ▪     Australia portfolio: S$2.2 b
                                                                                                                                                     United
             ▪     United States portfolio: S$2.1 b                                                                                                  Kingdom/Europe,
                                                                                                                                                     11%
             ▪     United Kingdom/Europe portfolio: S$1.8 b

       ▪ Diversified by asset class:                                                                                                                                                               Business  (2)
                                                                                                                                                                                                   Space, 46%
            ▪     Business Space(2): 46%
            ▪     Logistics & Distribution Centre(3): 23%                                                                                         Logistics, 23%
                                                                                                                                                                   (3)

            ▪     Industrial(4): 21%                                                                                                                                           Total Investment
            ▪     Data Centre: 10%                                                                                                                                               Properties(5)
                                                                                                                                                                                  ~S$15.1 b

(1) Excludes 3 properties in Singapore which are under redevelopment
(2) Business Space includes business & science park properties/offices (Singapore 27%, US 14%), suburban offices (Australia 5%)                                                                   Data Centre,
(3) Comprises logistics properties in Singapore (8%), Australia (10%) and UK (5%).
                                                                                                                                                     Industrial , 21%
                                                                                                                                                                         (4)
                                                                                                                                                                                                      10%
(4) Comprises high specifications industrial properties (10%), light industrial properties & flatted factories (6%) and integrated development,
    amenities & retail (5%) in Singapore
(5) Multi-tenant buildings account for 67.9% of Ascendas Reit’s total investment properties (by asset value) as at 31 Mar 2021.
                                                                                                                                                                                                        8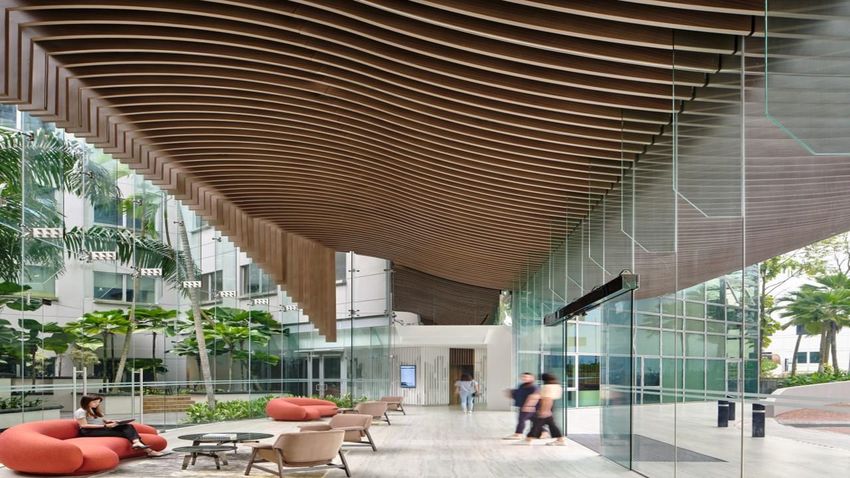
Singapore: 96 properties
       Widest variety of industrial                       Properties are well-located along major
               properties                               expressways, airport, seaport and proximity to
                                                                        MRT stations
                             Integrated
                           Development,
            Light industrial Amenities &
                                         Logistics &
              and Flatted       Retail
                                         Distribution
               Factories         8%
                 10%                      Centres
                                         Singapore
                                             13%

        High-
    Specifications
                       Investment
    Industrial and
    Data Centres
                        Properties
        23%
                          S$9.0b

                        Business & Science
                              Parks
                               46%

                                                                   Business & Science Parks (859,173 sqm)
                                                                   Integrated Development, Amenities & Retail (157,300 sqm)
                                                                   High-Specifications Industrial and Data Centres (676,916 sqm)
                     as at 31 Mar 2021                             Light Industrial and Flatted Factories (495,988 sqm)
                                                                   Logistics & Distribution Centres Singapore (811,916 sqm)

                                                                                                                                   9
Australia: 37 properties
(32 logistics, 5 suburban offices)
           Breakdown by City                    Located in 4 key cities: Sydney, Melbourne,
                                                            Brisbane and Perth
                         Melbourne
                           26%                                                 Brisbane          206,825 sqm
                                                                               Logistics         9 properties
                                                Perth       20,895 sqm         Suburban Office   2 Properties
                                        Perth
                                                Logistics   1 property
                                         2%
         Brisbane    Investment
            24%
                      Properties
                        S$2.2b

                               Sydney
                                48%

                                                                                       Queensland
       Breakdown by Asset Class                      Western Australia
                         Suburb
                           an
                         Office
                          35%                                                               New South
                                                                                              Wales

                     Investment
                      Properties                                                          Victoria
                        S$2.2b                  Melbourne      338,849 sqm
                                                Logistics      12 properties
                                                Suburban Office 1 property           Sydney             300,816 sqm
                         Logistic                                                    Logistics          10 properties
                            s                                                        Suburban Office     2 properties
                           65%

                    As at 31 Mar 2021                                                                                   10
United Kingdom/Europe: 49 properties
(38 logistics, 11 data centres)
38 Logistics 509,908 sqm
Breakdown by Geography 3 Data Centres 29,189 sqm
France The
11% Netherlands
Switzerland
14%
2%
3 Data Centres 22,006 sqm
Investment
Properties
S$1.8b
United Kingdom
73%
Breakdown by Asset Class
Logistics
54%
1 Data Centre 6,114 sqm
Investment
Properties
S$1.8b 3 Data Centres 18,380 sqm
Data Centre
46%
As at 31 Mar 2021 11United States: 30 Business Park Properties
Breakdown by City Portland, Oregon 106,506 sqm
Business Park 15 properties
San Francisco
37%
Investment San Francisco, California 44,006 sqm
Office 2 properties
Properties
San Diego S$2.1b
Raleigh
29%
20%
Portland
14%
Raleigh, North Carolina 110,093 sqm
Business Park 5 properties
San Diego, California 96,460 sqm
As at 31 Mar 2021 Business Park 8 properties
12Customers’ Industry Diversification
(By Monthly Rental Income)
▪ Diversified customer base across more than 20 industries
More than
20 industries
13Quality and Diversified Customer Base
▪ Total customer base of more than 1,460 tenants
▪ Top 10 customers (as at 31 Mar 2021) account for about 19.3% of monthly portfolio gross revenue*
▪ On a portfolio basis, weighted average security deposit is about 4.8 months of rental income.
geographical location(s) of property
141Q FY2021
Key Highlights
The Capricorn, Singapore1Q FY2021 Key Highlights
Investment Management
• Acquired 11 data centres across 5 key European cities for S$904.6 m
• Completed the acquisition of a suburban office at 1-5 Thomas Holt Drive,
Sydney, Australia, for S$284.0 m
Capital Management Asset Management
Healthy Aggregate High Level of Portfolio Portfolio
Leverage Natural Hedge Occupancy Rental Reversion#
38.0% >70% 90.6% 3.0%
31 Dec 2020: 32.8% 31 Dec 2020: >60% 31 Dec 2020: 91.7% 4Q FY2020: +2.5%
# Percentage change of the average gross rent over the lease period of the renewed leases against the preceding average gross rent from lease start date. Takes into account renewed
leases in multi-tenant buildings that were signed in 3Q FY2020 and average gross rents are weighted by area renewed. 16Investment
Management
Croydon, London, United KingdomInvestment Highlights: Acquisitions
▪ Completed S$1,188.6 m worth of acquisitions in 1Q FY2021
▪ An additional S$251.2 m worth of investments under development were secured and expected to complete
within the next two years
Purchase Consideration / Completion
1Q FY2021 City/Country Sub-segment
Land & Development Cost (S$m) Date
Completed Acquisitions 1,188.6
1-5 Thomas Holt Drive,
Sydney, Australia Suburban Office 284.0(1) 13 Jan 2021
Macquarie Park
Across 5 cities(2),
11 Data Centres in Europe Data Centre 904.6(3) 17 Mar 2021
UK & Europe
Acquisitions (under development) 251.2
Lot 7, Kiora Crescent, Yennora Sydney, Australia Logistics 21.1(4) 3Q 2021 (est.)
500 Green Road, Crestmead Brisbane, Australia Logistics 69.1(1) 4Q 2021 (est.)
MQX4, Macquarie Park Sydney, Australia Suburban Office 161.0(5) Mid 2022 (est.)
TOTAL : 1,439.8
(1) Based on exchange rate of A$1.000: S$0.9830 as at 30 Sep 2020
(2) Cities include: London & Manchester (UK), Amsterdam (Netherlands), Paris (France), Geneva (Switzerland)
(3) Comprising approximately £250.25 m for the data centres located in the UK and approximately €276.85 m for the data centres located in the Netherlands, France and Switzerland. Illustrative exchange rates of
£1.0000: S$1.8395 and €1.0000: S$1.6047
(4) Based on exchange rate of A$1.00: S$0.89957 as at 31 May 2020
(5) Based on exchange rate of A$1.000: S$0.9628 as at 31 Jul 2020
18Acquisition (Completed):
1 – 5 Thomas Holt Drive, Macquarie Park, Sydney, Australia
Purchase Consideration(1)(2) S$284.0 m (A$288.9 m)
3 THD
Acquisition Fee(3),
Stamp Duty and S$19.3 m (A$19.6 m)
Other Transaction Costs
5 THD
Total Acquisition Cost S$303.3 m (A$308.5 m) 1 THD
Vendor AMP Capital
Valuation (as at 1 December 2020) (4) S$284.0 m (A$288.9 m)
Land Tenure Freehold Aerial view of 1 – 5 Thomas Holt Drive
Net Lettable Area 39,188 sqm The Property:
▪ The good quality office blocks sit on freehold land and are
Occupancy Rate (as at acquisition) 100%(5) (physical occupancy: 93%) equipped with tenant-friendly amenities such as a café,
two tennis courts, a swimming pool, BBQ area and a total
Weighted Average Lease to Expiry 4.5 years of 1,107 carpark spaces.
(as at acquisition) ▪ 1 & 3 THD each have 5-Star NABERS energy rating.
Location:
Key tenants Metcash, Foxtel ▪ Well connected via multiple transport nodes and home to
global players across resilient industries such as the
Initial Net Property Income (NPI) Yield 5.9% (5.6% post-transaction cost) pharmaceutical, technology, electronics and
Completion Date 13 Jan 2021 telecommunications sectors.
▪ Well located within Macquarie park and approx. 250m
from MQX4, a suburban office building owned by
(1) All S$ amounts are based on exchange rate of A$1.000: S$0.983 as at 30 Sep 2020. Ascendas Reit which is currently under development.
(2) Includes a two-year rental guarantee provided by the Vendor for vacant space.
(3) In accordance to Ascendas Reit’s Trust Deed, the Manager is entitled to an acquisition fee of 1.0% of the Purchase Consideration, which will be paid in cash.
(4) The valuation dated 1 Dec 2020 was commissioned by the Manager and Perpetual Corporate Trust Limited (in its capacity as trustee of Ascendas REIT Australia) and was carried out by Jones Lang LaSalle Advisory Services
Pty Limited using the capitalisation and discounted cash flow methods.
(5) Includes two-year rental guarantee provided by the Vendor for vacant space.
19Acquisition (Completed):
11 Data Centres in Europe
S$904.6 m
Total Consideration (1) 4 data centres in UK: £250.25 m
7 data centres in Netherlands/France/Switzerland: €276.85 m
Acquisition Fee (2), Stamp Duty London Amsterdam
S$55.4 m
and Other Transaction Costs
Paris Geneva
Total Acquisition Cost S$960.0 m
Vendor Subsidiaries of Digital Realty Trust, Inc.
S$905.0 m
Valuation (3) 4 data centres in UK: £250.25 m
7 data centres in Netherlands/France/Switzerland: €277.10 m
6 data centres: freehold The Data Centres:
Land Tenure (as at 31 Dec ▪ Comprises 8 triple net powered shell data centres and 3
5 data centres(4): leasehold with weighted average land
2020) colocation data centres
lease expiry of 42.9 years
Net lettable area 61,637 sqm Location:
▪ 93% of Target Portfolio (by asset value) are strategically
Occupancy Rate (as at located in London (UK), Amsterdam (Netherlands) and
97.9%
acquisition Paris (France), which are top data centre markets in
Weighted Average Lease to Europe. The remaining 7% are located in Manchester (UK)
4.6 years (4.2 years to break) and Geneva (Switzerland)
Expiry (as at 31 Dec 2020)
Key Tenants HSBC Bank, Entserv UK, Bouygues Telecom
Initial NPI Yield 6.0% (5.7% post-transaction cost)
Completion Date 17 Mar 2021
(1) Illustrative exchange rates of £1.0000: S$1.8395 and €1.0000: S$1.6047 have been used for conversions from Pounds Sterling and Euro amounts into Singapore Dollar respectively..
(2) In accordance with Ascendas Reit’s Trust Deed, the Manager is entitled to receive an acquisition fee of 1.0% of the Total Consideration, which will be paid by cash.
(3) The valuations dated October 2020/February 2021, were commissioned by HSBC Institutional Trust Services (Singapore) Limited (in its capacity as trustee of Ascendas Reit), and were carried out by Newmark Knight
Frank Valuation & Advisory, LLC, using the using the sales comparison and income capitalisation approaches. Please refer to the announcement titled “Proposed Acquisition of a Portfolio of 11 Data Centres in
Europe” dated 17 March 2021 for the exact dates of the valuations. 20
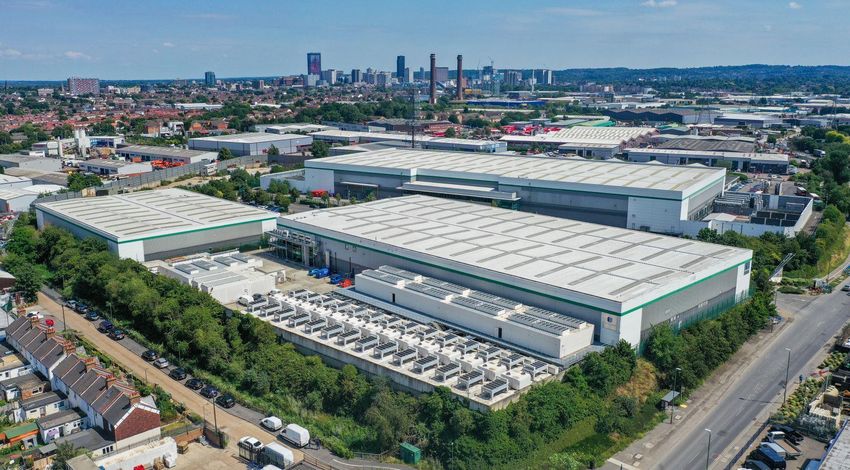
(4) Includes two data centres on perpetual leasehold basis.Divestment (Newly Completed in 2Q 2021):
11 Changi North Way, Singapore
Sales Price(1) S$16.0 m
Buyer Hafary Pte Ltd
Book Value/Valuation(2) (as at 31 Dec 2020) S$15.0 m
Acquisition Year / Purchase Price 2005/ S$11.0 m
Remaining Land Tenure
42 years
(at point of sale)
Net Lettable Area 9,494 sqm 11 Changi North Way, Singapore
Occupancy Rate (as at 31 Mar 2021) 0%
The Property:
▪ 2-storey warehouse with 4-storey ancillary office
Completion Date 16 Apr 2021
building within Changi International LogisPark
Location:
▪ It is located at Changi North Way, in close proximity
to Changi International Airport
(1) In accordance to Ascendas Reit’s Trust Deed, the Manager is entitled to a divestment fee of 0.5% of the sale price of the
properties.
(2) The valuation was commissioned by the Manager and the Trustee, and was carried out by Colliers International
Consultancy & Valuation (Singapore) Pte Ltd using the capitalisation approach and discounted cash flow approach.
(3) Assuming the proposed divestment of 11 Changi North Way was completed on 31 December 2020.
21Proposed Acquisition of
remaining 75% interest
in Galaxis
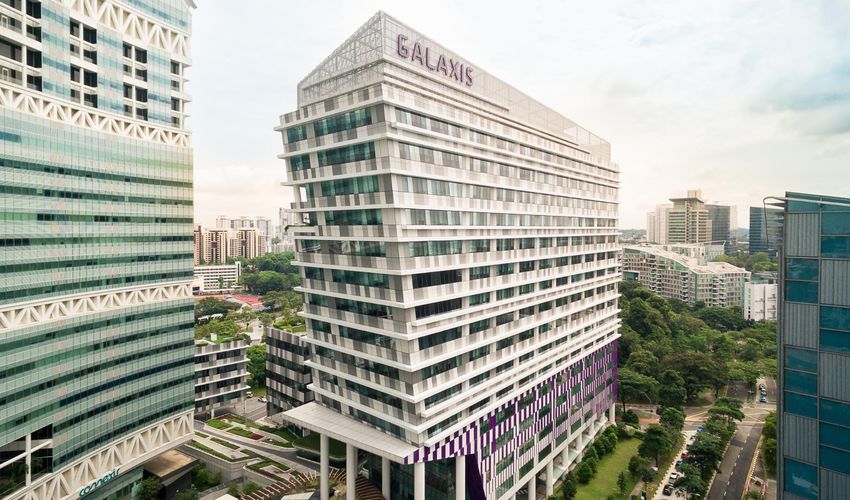
Galaxis, SingaporeProposed Acquisition:
75% interest in Galaxis, Singapore, a top-notch high-end business park in one-north
Purchase Consideration (1) S$534.4 m
Acquisition Fee(2), Stamp Duty and
S$9.4 m
Other Transaction Costs
Total Acquisition Cost S$543.8 m
Vendor Ascendas Fusion 5 Holding Pte Ltd (3)
Agreed Property Value (based on 100% basis) S$720.0 m (~2% discount to avg. valuation)
Valuations as at 30 Apr 2021(4) JLL: S$734.1 m and Savills: S$736.0 m
(based on 100% basis) Avg: S$735.1 m
Land Area 19,283 sq m
Land Tenure Approx. 51 years remaining 17-storey business park and office building
at Galaxis, Singapore
Gross Floor Area 68,835 sq m
Net lettable area (NLA) 60,935 sq m
Occupancy rate (as at 31 Mar 2021) 98.6%
Weighted Average Lease Expiry
2.4 years
(WALE) (as at 31 Mar 2021)
Key Tenants Sea, Canon, Oracle
Initial Net Property Income (NPI) Yield 5.4% (5.3% post-transaction cost)
(1) The Purchase Consideration comprises a) the estimated consideration for the 75% equity stake in Ascendas Fusion 5 Pte. Ltd (“AF5PL”) of S$372.8
million (subject to post-completion adjustments), which is based on 75% of the adjusted net asset value (“NAV”) of AF5PL, the holding entity for
Galaxis, taking into account the agreed value of the Property (on a 100.0% basis) of S$720.0 million, and b) the 75% share of the existing bank loans of
AF5PL of S$161.6 million which the Vendor would otherwise would have to contribute to AF5PL for the repayment of such existing bank loans. For more
details, please refer to the announcement “Proposed Acquisition of 75% of the Total Issued Share Capital of Ascendas Fusion 5 Pte. Ltd.” dated 4 May
2021.
(2) In accordance to Ascendas Reit’s Trust Deed, the Manager is entitled to receive an acquisition fee, payable in Units, of 1% of 75% of the Agreed Five-storey work lofts building at Galaxis, Singapore
Property Value, which amounts to approximately S$5.4 m.
(3) An indirectly wholly-owned subsidiary of CapitaLand Limited (the Sponsor).
(4) The independent valuers Jones Lang LaSalle Property Consultants Pte Ltd (JLL) and Savills Valuation and Professional Services (S) Pte Ltd were BCA Green Mark Platinum
commissioned by HSBC Institutional Trust Services (Singapore) Limited (as trustee of Ascendas Reit) and the Manager respectively. Both valuers’
valuations were carried out using the Discounted Cash Flow approach and the income capitalisation method.Key Merits of the Investment
Buona Vista
one-north
▪ Enlarges Ascendas Reit’s business park portfolio in one-north,
Singapore
• Asset value of the Business & Science Park segment in Singapore will
grow by 17.6% from ~S$4.1 b to ~S$4.9 b (1)
• Total NLA of the business and science park segment in Singapore will
increase by 8.8% from 689,980 sq m to 750,915 sq m (1)
Neuros & Immunos
• Including the Property, Ascendas Reit is expected to own five
properties(2) with a total NLA of 188,225 sq m within one-north by the Nucleos
end of 2021 one-north
▪ Strategic location Galaxis Nexus @one-north
• Property is strategically located right in the heart of the one-north, a
vibrant business park in Singapore
• one-north houses key growth sectors such as biomedical sciences,
information and communications technologies and media, science
and research institutes, as well as start-ups. The area has a plethora
of food & beverage options and amenities such as hotels,
supermarkets, clinics, gyms and childcare facilities
• Direct access to the one-north MRT station and is a 5-minute drive to
Ayer Rajah Expressway and a 15-minute drive to the Central Business
District Grab’s Headquarters
(under development)
~15 mins drive
Location map Galaxis, one-north, Singapore
to CBD
(1) Pro Forma as at 31 Mar 2021.
(2) Includes Grab’s Headquarters which is under development and expected to complete in 2021. Ascendas Reit’s existing property/property under development. 24Key Merits of the Investment
▪ Rare opportunity to acquire and achieve full control of a Singapore property
with long remaining land lease tenure
• Long remaining land lease tenure of about 51 years, which is rare given JTC
Corporation’s current practice of releasing shorter tenure land plots of between 20 to
30 years under the Industrial Government Land Sales Programme
• 100% ownership of the Property i.e. better operational and tax efficiency
Lift Lobby at Galaxis, Singapore
▪ A high quality and green certified business park property with high White
Component
• Completed in 2015, the Property is zoned for Business Park usage with a 30% White
Component(1) which is higher than the typical 15% White Component, allowing for
higher flexibility in the use of space such as having more office and retail space within
the development
• Comprises 44,556 sqm (~73%) of business park space, 10,305 sqm (~17%) of office
space, 4,106 sqm (~7%) of retail and F&B space, 1,968 sqm (~3%) of work lofts, and a
two-storey basement carpark
• Highest BCA Green Mark Platinum rating: green features include high efficiency multi-
Reception area at Galaxis, tiered chiller plant and air-conditioning system, intelligent lighting control and eco-
Singapore friendly interior fittings and materials which are expected to attract high quality
tenants
(1) Allowable uses within the White component under the Urban Redevelopment Authority of Singapore’s development control guidelines include office, restaurant, shop etc. Source: Urban Redevelopment
Authority of Singapore. 25Key Merits of the Investment
▪ High occupancy rate underpinned by renowned tenants
• Key tenants include renowned companies such as Sea, Canon and Oracle
• Higher rental contributions from Information & Communications Technology and Electronics customers
• Enjoys high occupancy rate of 98.6% as at 31 Mar 2021
▪ Distribution per Unit (DPU) and Net Asset Value (NAV) per Unit accretive to Unitholders
26Pro Forma Financial Impact
(Based on 75% interest of Galaxis)
Pro Forma
In Singapore cents Before Acquisition After Acquisition
Financial Impact
+0.059
DPU (1) 14.688 14.747
(0.40% accretion)
+2
NAV per Unit (2) 221 223
(0.90% accretion)
NPI Yield in Year 1 (3)
Pre-transaction cost 5.4%
Post-transaction cost 5.3%
(1) The annualised pro forma DPU impact is calculated based on the following assumptions a) Ascendas Reit had completed the Proposed Acquisition on 1 Jan 2020, held and operated the Property from 1 Jan
2020 to 31 Dec 2020, b) the Proposed Acquisition is funded based on a funding structure of 40% debt and 60% equity, and c)the Manager elects to receive its base fee 80% in cash and 20% in units.
(2) The pro forma NAV per Unit impact is calculated as at 31 Dec 2020 and assumes the Proposed Acquisition is funded based on a funding structure of 40% debt and 60% equity, and the Manager elects to
receive its base fee 80% in cash and 20% in units.
(3) The NPI Yield is derived using the estimated NPI in the first year of acquisition.
27Capital Management
1,3 & 5 Changi Business Park Crescent, SingaporeHealthy Balance Sheet
▪ Aggregate leverage is healthy at 38.0% (1)(2)
▪ Robust financial metrics that exceed bank loan covenants by a healthy margin
▪ A3 credit rating facilitates good access to wider funding options at competitive rates
▪ Available debt headroom of ~S$3.8 b (1)(2) to reach MAS’s aggregate leverage limit of 50.0%
As at As at
31 Mar 2021 31 Dec 2020
Aggregate Leverage (1)(2) 38.0% 32.8%
Unencumbered Properties as % of Total Investment Properties (3) 92.1% 91.7%
Interest Cover Ratio (4) 4.6 x 4.3 x
Net Debt / Annualised EBITDA (5) 8.1 x 7.3 x
Weighted Average Tenure of Debt (years) 3.3 3.7
Fixed rate debt as % of total debt 69.4% 78.1%
Weighted Average all-in Debt Cost 2.2% 2.7%
Issuer Rating by Moody’s A3 A3
(1) Excludes the effects of FRS 116 for properties held before 31 March 2019.
(2) In accordance with Property Funds Appendix, Ascendas Reit’s proportionate share of its joint ventures’ borrowings and deposited property values are included when computing the aggregate leverage. The ratio of
total gross borrowings to total net assets is 68.0%.
(3) Total investment properties exclude properties reported as finance lease receivable.
(4) Based on the trailing 12 months EBITDA (excluding effects of any fair value changes of derivatives and investment properties, and foreign exchange translation), divided by the trailing 12 months interest expense and
borrowing-related fees.
(5) Net debt includes lease liabilities arising from FRS 116, 50% of perpetual securities, offset by cash and fixed deposits, while annualised EBITDA does not pro-rate for full year EBITDA from new acquisitions. 29Well-spread Debt Maturity Profile
▪ Well-spread debt maturity with the longest debt maturing in FY2030
▪ Average debt maturity stable at 3.3 years
▪ Secured new green loans of US$448.6m (S$593.6m) in 1Q 2021
▪ To date, green financing of S$994m (1) accounts for about 16% of total borrowing of S$6.3 b (1)
16%
1400 31%
963 5%
1200 S$237m of Diversified
237 Revolving Credit Financial
S$ million
1000 940 Resources
841 855 877 Facilities were
refinanced in April
800 290
631 48%
370
600 701 552
281 641 435
395 365
400 154
237
200 132 350 331 325 365 100
200 254 198
130 100
0 -
FY2021 FY2022 FY2023 FY2024 FY2025 FY2026 FY2027 FY2028 FY2029 FY2030
Committed Revolving Credit Facilities Medium Term Notes Green Debt
Term Loan Facilities Revolving Credit Facilities
(1) Includes Green perpetual Securities of S$300m. 30High Natural Hedge
▪ Maintained high level of natural hedge for Australia (72.3%), the United Kingdom (70.7%), the United
States (89.0%) and Europe(75.4%) to minimise the effects of adverse exchange rate fluctuations
A$ Natural Hedge US$ Natural Hedge £ Natural Hedge € Natural Hedge
72.3% 89.0% 70.7% 75.4%
A$2.2 b
2.5 US$1.5 b
(S$ 2.2 b)
(S$ 2.0 b) US$1.4 b
2.0 A$1.6 b (S$ 1.8 b)
S$ billion
(S$ 1.6 b) £0.7 b
1.5 (S$ 1.3 b)
£0.5 b
1.0 (S$ 0.9 b)
€0.3 b
€0.2 b
(S$ 0.5 b)
0.5 (S$ 0.4 b)
0.0
Total Australia Total Australia Total United Total United Total United Total United Total Europe Total Europe
Assets Borrowings States Assets States Kingdom Assets Kingdom Assets Borrowings
Borrowings Borrowings
31Asset
Management
254 Wellington, Melbourne, AustraliaOverview of Portfolio Occupancy
98.6% 97.5%(1) 97.5%(1)
94.9% 97.4% 97.3% 92.5% 92.9% 92.9% 90.6% 91.7% 91.7%
86.9% 88.4% 88.6%
Singapore Australia United States United Kingdom / Europe Total
Mar-21 Dec-20 Mar-20
Gross Floor
3,001,293 867,383 (3) 357,065 590,377 (4) 4,816,118
Area (sqm) (2)
(1) Refers to logistics portfolio in the UK only and does not include the data centres which were acquired in March 2021.
(2) Gross Floor Area as at 31 Mar 2021.
(3) Gross Floor Area for Australia portfolio refers to the Gross Lettable Area/Net Lettable Area. 33
(4) Gross Floor Area for United Kingdom/Europe portfolio refers to the Gross Internal Area.Singapore: Sources of New Demand in 1Q FY2021
▪ Continues to attract demand from a wide spectrum of industries
3.6%
4.4%
2.3% 3.0%
5.8%
6.5%6.4% 8.1% 4.4%
7.0% 1.1% 1.4%
7.2% 1.1% 9.7% 0.6%
By Gross Rental
By NLA
Income
31.8% 32.1% 29.3% 34.0%
Electronics Biomedical and Agri/Aquaculture
Distributors & Trading Company Engineering
Financial & Professional Services Logistics & Supply Chain Management
Lifestyle, Retail and Consumer Products Education and Media
Energy, Chemicals and Materials IT & Data Centers
Note: Customers’ Industry classifications have been updated to better reflect the organisation’s primary industry sector. Previous industry classifications were based on the
34
Singapore Standard Industrial Classification (SSIC) which may be outdated due to changes in business activities.Portfolio Rental Reversions
▪ Average portfolio rent reversion of 3.0% was recorded for leases renewed in 1Q FY2021.
▪ Rental reversion for FY2021 is expected to be in the positive low single-digit range in view of current market uncertainties
% Change in Renewal Rates for Multi-tenant Buildings (1) 1Q FY2021 4Q FY2020 1Q FY2020
Singapore 2.9% 0.9% 7.7%
Business & Science Parks 2.8% -1.1% 7.0%
High-Specifications Industrial and Data Centres -0.9% -0.1% 12.2%
Light Industrial and Flatted Factories 0.8% -5.0% 4.2%
Logistics & Distribution Centres 5.6% -7.1% 0.3%
Integrated Development, Amenities & Retail -2.7% 11.5% 15.6%
Australia -(2) -(2) 13.7%
Suburban Offices -(2) -(2) 15.7%
Logistics & Distribution Centres -(2) -(2) 13.2%
United States 6.2% 18.8% 7.4%
Business Parks & Office 6.2% 18.8% 7.4%
United Kingdom/Europe -(2) -(2) -(2)
Data Centres -(2) N.A. N.A.
Logistics & Distribution Centres -(2) -(2) -(2)
Total Portfolio : 3.0% 2.5% 8.0%
(1) Percentage change of the average gross rent over the lease period of the renewed leases against the preceding average gross rent from lease start date. Takes into account renewed leases
that were signed in their respective periods and average gross rents are weighted by area renewed. 35
(2) There were no renewals signed in the period for the respective segments.Weighted Average Lease Expiry
(By gross revenue)
▪ Portfolio Weighted Average Lease Expiry (WALE) stood at 4.1 years
WALE (as at 31 Mar 2021) Years
Singapore 3.6
Australia 4.0
United States 4.9
United Kingdom/Europe 6.2
Portfolio 4.1
36Portfolio Lease Expiry Profile
(as at 31 Mar 2021) Breakdown of expiring leases for
FY2021 and FY2022
▪ Portfolio WALE of 4.1 years.
▪ Lease expiry is well-spread, extending beyond FY2035 13% 2%6%
29% 13%
▪ About 9.9% of gross rental income is due for renewal in the remaining of 7%
8% 43%
FY2021 FY2021
4%
FY2022
▪ Weighted average lease term of new leases (1) signed in 1Q FY2021 was 3.5 5%
13%
10%
years and contributed 3.0% of 1Q FY2021 total gross revenue 15% 7%
10% 16%
25%
20.6% 20.6%
% of Gross Rental Income (Total Portfolio)
20% Business and Science Parks
High-Specifications Industrial and Data
15% Centres
Multi-tenant Buildings Light Industrial and Flatted Factories
9.9% 17.0% 16.4% 10.7% Single-tenant Buildings
10% 8.8% 8.7% Logistics & Distribution Centres
7.0% 3.4% Integrated Development, Amenities &
4.5% Retail
5% 9.4% 6.7% 3.7%
2.1% 2.5% 2.4% 0.0%
2.0% 1.3% Logistics & Suburban Offices
4.2% 5.3% 1.2%
0.7%
1.0% 1.1% 4.5% 0.0%
(Australia)
3.6% 3.7%
2.1% 2.5% 0.6% 1.5%
0.0% 0.2%
0.0% 2.0% 0.2% Logistics & Data Centres (UK/Europe)
1.5% 1.0% 1.7% 1.0% 0.9% 1.1%
0% 0.5% 0.0%
Business Parks (US)
FY30
FY21
FY22
FY23
FY24
FY25
FY26
FY27
FY28
FY29
FY31
FY32
FY33
FY34
FY35
> FY35
(1) New leases refer to new, expansion and renewal leases. Excludes leases from new acquisitions. 37Ongoing Projects:
Improving Portfolio Quality
Estimated
City/Country Estimated Total Cost (S$m)
Completion Date
Development 184.6
Built-to-suit business park
Singapore 184.6 3Q 2021(1)
development for Grab
Redevelopments 119.3
UBIX (formerly 25 & 27 Ubi Road 4) Singapore 35.0 4Q 2021
iQuest@IBP Singapore 84.3 1Q 2023
Asset Enhancement Initiatives 33.6
21 Changi South Avenue 2 Singapore 4.7 2Q 2021
100 & 108 Wickham Street Brisbane, Australia 10.1 2Q 2021(2)
Changi Logistics Centre Singapore 11.3 2Q 2022
Hansapoint (New) Singapore 7.5 1Q 2022
TOTAL: 337.5
(1) Delayed from 2Q 2021.
(2) Delayed from 1Q 2021. 38Asset Enhancement Initiative (New):
Hansapoint, Singapore
The asset enhancement works include
upgrading of the main entrance and lift
lobby, upgrading of the common corridors
Description and toilets, driveway upgrading works,
erection of new driveway canopy, and
construction of a new gymnasium and end-
of-trip facilities in the building.
Property Segment Business & Science Park New Driveway and Canopy
Net Lettable Area 16,571 sqm
Estimated Cost S$7.5 m
Estimated Completion Date 1Q FY2022
Main Entrance Lobby
39Expanding Flexible Workspace Solutions
• Launched Ascendas Reit’s third flexible workspace location, The Workshop @ Bukit Merah, in Apr 2021 at
Pacific Tech Centre, Singapore
• The Workshop offers workpods, storage solutions, event spaces, broadcast and photography studios(1)
2018 2020 2021
1 The Workshop @ Ang Mo Kio 2 The Workshop @ Lavender 3 The Workshop @ Bukit Merah
Located at Located at Located at
Techplace II Aperia Pacific Tech
Centre
Website: https://www.theworkshop.sg/en
(1) Facilities vary in the three locations. 40Market Outlook
505 Brannan Street
San Francisco, United StatesMarket Outlook
• In Apr 2021, the International Monetary Fund (IMF) projected the global economy to grow by a stronger 6.0% y-o-y
in 2021 (revised from Jan 2021 forecast of 5.5%) supported by government policies and COVID-19 vaccines.
However, until the pandemic is brought under control globally, many risks and uncertainties remain. New strains of
the virus and diverging economic recoveries across countries may weigh on global recovery.
• The Singapore economy contracted 5.4% y-o-y in 2020 but recovered to an estimated growth of 0.2% y-o-y in 1Q
2021. The Ministry of Trade and Industry (MTI) expects the economy to grow by between 4.0% to 6.0% in 2021.
➢ Demand is expected to remain subdued as companies are likely to stay cautious amidst the lingering global
uncertainties. Excess supply in some industrial property segments is also expected to curb rental growth.
➢ Ascendas Reit continues to have access to its Sponsor’s pipeline of business & science park properties in Singapore.
• Australia's economy contracted 1.1% in 2020. The Reserve Bank of Australia expects the positive momentum to
continue into 2021 with an estimated GDP growth of 3.5%.
➢ The portfolio continues to deliver stable performance due to good locations in the key cities of Sydney, Melbourne and
Brisbane, long WALE of 4.0 years and average rent escalations of approximately 3% per annum.
Source for Singapore GDP and GDP growth forecast: MTI
Source for Australia GDP: Australian Bureau of Statistics; Source for Australia GDP growth forecast: Australian Government Mid-Year Economic and Fiscal Outlook 42Market Outlook
• The US economy recorded a contraction of 3.5% y-o-y in 2020 and is expected to rebound to a growth of 6.4% in
2021.
➢ The US portfolio is located in the US technology cities of San Francisco, San Diego, Raleigh and Portland and is well-
positioned to benefit from the growing technology and healthcare sectors. The strength of the US portfolio is also
underpinned by its WALE of 4.9 years and the high proportion of leases with rent escalation clauses of between 2.5% to
4.0% per annum.
• In 2020, the UK economy contracted by 9.8% y-o-y whilst the Euro area is estimated to have contracted by 6.6% y-o-y.
The IMF estimates that GDP growth for the UK and the Euro area may rebound to 5.3% and 4.4% respectively in 2021.
➢ The recently acquired 11 European data centres are well-located in key cities and are expected to benefit from the
acceleration of digitalisation. The data centres are expected to provide Ascendas Reit with steady long-term returns.
➢ The UK/Europe portfolio has a long WALE of 6.2 years, which should help to mitigate any near term leasing challenges.
• Our priority is to keep building a stronger and profitable portfolio for the longer term. Ascendas Reit’s strong financial
profile allows us to seize good opportunities to grow. We will maintain our long-standing strategy of diversifying across
multiple developed countries and asset classes.
• At the same time, we will exercise prudence, maintain a strong balance sheet and proactively manage the portfolio
to deliver sustainable returns for Unitholders.
Source for US GDP: US Bureau of Economic Analysis; Source for GDP growth forecast: IMF
Source for UK GDP: Office for National Statistics; Source for UK GDP growth forecast, Euro area GDP and GDP growth forecast: IMF
43Sustainability
The Galen, SingaporeGreen Initiatives
Green Financing Renewable Energy
• Established Green Finance • Largest no. of public Electric Vehicle
Framework in FY2020 (EV) charging points in Singapore by a
• Issued maiden Green Bond (S$100 S-REIT: 40
million), Green Perpetual Securities • 10,385 MWh of solar power generated
(S$300 million), four Green USD and in 2020 from solar farms on 6 of our
AUD Loans (S$830 million) and Green properties. It is the largest combined
Interest Rate Swap (US$150 million) solar installation in Singapore for a real
estate company
Green Buildings Leveraging Technology
• Largest number of BCA Green Mark • Smart Urban Co-Innovation Lab
properties amongst S-REITs: 34^ located at The Galen, is Southeast
• Total portfolio comprises 40 Green Asia’s first industry-led innovation lab
certified properties for smart cities solutions development
• LogisTech is the first industrial building • Brings together industry leaders to co-
in Singapore awarded Green Mark create and test innovations within the
Platinum Super Low Energy (SLE) Singapore Science Parks
status
45
^ Includes 3 single-tenant propertiesCommitted to Reduce Carbon Footprint
• In 2020, common facilities’ electricity usage at Neuros & Immunos was 100% powered by renewable
energy generated from solar farms installed on the roofs of 6 of Ascendas Reit’s properties
• By 2022, Ascendas Reit aims to power the common facilities’ electricity usage at 3 properties located at
one-north (including Neuros & Immunos) with renewable energy
Neuros & Immunos Nexus @one-north Nucleos
Achieved in 2020 By 2021 By 2022
Power 1,300 four-room Avoid 2.4 mil
HDB flats for a year kg of CO2
46Recent Acquisitions of Green Buildings
Under
Development
510 Townsend Street, San Francisco, US 505 Brannan Street, San Francisco, US 254 Wellington Road, Melbourne, Australia MQX4, Sydney, Australia
5 Star Green Star Design & 6 Star Green Star Design & As-Built rating
LEED Platinum (Building Design & Construction)
As-Built rating and 5.5 Star NABERS Energy rating (target)
Under
Development
• The Manager is committed to ensure that
new properties to be acquired or new
developments undertaken will achieve
green certifications.
• If this is not achievable immediately,
capital expenditure will be set aside to
1 & 3 Thomas Holt Drive, Sydney, Australia 500 Green Road, Brisbane, Australia
enhance the properties to attain green
5 Star NABERS Energy rating
5 Star Green Star Design & As-Built certifications in the future.
rating (target)
47Thank you
You can also read