2020 Midyear Outlook - Freddie Mac Multifamily
←
→
Page content transcription
If your browser does not render page correctly, please read the page content below

2020 Midyear Outlook

January 2019            0
Multifamily 2020 Midyear Outlook

Multifamily 2020 Midyear Outlook

The effects of the Covid-19 pandemic has led to a recession in the first quarter of 2020 and will continue to drive
changes in macroeconomic and multifamily forecasts for the remainder of the year. Growth will slow for the rest
of the year due to the higher unemployment rate and greater uncertainty, but the apartment market was on solid
footing entering the recession. While the pandemic took hold in the second half of March, first quarter 2020
fundamentals remained strong and in line with the prior few years.

    •   Performance in the multifamily market was solid through the end of 2019 and into the first quarter of
        2020, with stable occupancy and moderate rent growth. RealPage reported first quarter vacancy at
        4.4%, flat over the year, and rents up 2.9% annually.
    •   Investment activity has declined through the second quarter as market participants moved to the
        sidelines. Cap rates remained relatively stable as interest rates dropped and cap rate spreads increased,
        but little movement in property prices indicate that market perception of the multifamily asset
        class continues to favor longer-term fundamentals.
    •   The second quarter started to see demand drop, vacancy rates rise and rent growth slow. Multifamily
        fundamentals for 2020 are expected to weaken due to the negative effects of the virus on the economy;
        vacancy rates up 200-250bps and rents down -1.2% to -1.7%, resulting in gross income growth -3.3%
        to -4.2% for the year. A gross income decline of -4.2% would lower a property’s debt coverage ratio by
        only 0.05 implying those well-positioned properties will be able to make monthly payments.

    •   The National Multifamily Housing Council (NMHC) rent tracker indicated collections by month-end from
        April to June are only 3.1 to 0.1 percentage points off compared with the prior year, relatively strong due
        to added benefits from the CARES Act. Here we show that declining income growth and collections
        are not estimated to impact a well-positioned property especially given the prior several years of
        above average income growth and property price appreciation.

    •   Multifamily fundamentals will differ across metro areas with many of the larger, coastal areas such as
        San Jose, San Francisco and Miami expected to see greater gross income growth declines while
        smaller, interior metros, such as Chicago, St. Louis and Knoxville are expected to see only modest
        declines.

    •   Renters are expected to be more impacted than homeowners from this recession given their
        susceptibility to the industries harder hit from the lockdowns. As the unemployment rate remains elevated
        this year, renters who were already more cost burdened than owner households, could see a greater
        impact to their ability to pay rents.
    •   Given the severity of the recession, total multifamily origination volume is expected to decline by 20-
        40% in 2020 compared to 2019 based on several different macroeconomic forecasts. Despite lower
        overall volume, Freddie Mac’s role in the market to provide liquidity during weaker economic
        environments should keep our volume steady as other financial institutions pull back from the market.
_________________________________________________________________________________________

July 2020                                                                                                             1
Multifamily 2020 Midyear Outlook

First Half of 2020: A Tale of Two Economies
The first half of 2020 is the tale of two economies: pre-Covid-19 pandemic and the                 The
first three months of the pandemic. Leading up to the pandemic, the economy and
multifamily market were on solid ground through most of the first quarter of 2020. The
                                                                                                   multifamily
pandemic hit the US mid-March and brought about the shutdown of most of the                        market started
economy across the nation, reverberating through the labor market. The hit in just the             2020 on solid
last month of the first quarter was enough to drop the US into a recession, with GDP               ground as
down -5% according to The Bureau of Economic Analysis third estimate on June 25th.                 demand has
The longevity and depth of the recession will determine the severity of the impact and             consistently
how the recovery will look. The multifamily market will not be unscathed from the from             outpaced
this recession resulting in occupancy and rent to fall through at least 2020.                      supply for a
The labor market was on strong ground before the pandemic hit in March. The                        decade.
economy added 2.3 million jobs in the 12 months ending February 2020. During that
time the unemployment rate continued to tighten, down 30 basis points (bps) from a
year earlier to 3.5%, matching the lowest level in 50 years. Weekly unemployment claims from the week of March
21 marked the start of the impacts from the pandemic; with claims rising to 3.3 million. In the following two weeks
unemployment claims rose to 6.9 and 6.6 million. Continuous unemployment claims as of July 11 were 30.2
million, while down 1.6 million from the prior week, it compares to only 1.7 million continuous claims this week last
year.
During the second quarter the unemployment rate peaked in April at 14.7% with 23 million out of work. The
losses have been most significant in Leisure and Hospitality which lost nearly half its jobs from February through
April, along with Other Services which lost nearly 23% of jobs over the same period. The subsequent months
have seen some unexpected recoveries as states begin to reopen, but also reflect a significant number of
workers leaving the workforce – which would reduce those seeking work and no longer counted as unemployed.
There will likely continue to be volatility in labor market conditions. The May and June jobs reports indicate over 7
million jobs were added to the economy, however, the unemployment rate still stands at 11.1% per the June Jobs
Report from BLS.
The second quarter advanced GDP estimate reports an annualized decline of -32.9%, the largest decline on
record. GDP fell an estimated 33.6% annualized in the second quarter. March and April of this year were one of
the most volatile economic times in history, with a severe, acute recession. The 10-year treasury rate started the
year at 1.9% and then dropped dramatically given the sudden shift in the economy and hit its low in early March
at 0.3% and as of June 30th sat at 0.6%. The S&P 500 went on a roller coaster ride falling 34% since mid-
February through late March, and then up 38% as of the end of June. As individual states started lifting lockdown
restrictions and opening non-essential businesses, the economy showed signs of improvement. However, as of
the end of June, Covid-19 cases were on the rise again making future trajectory of the economy difficult to predict
and leading many to fear a second round of shutdowns coinciding with the Federal government’s Coronavirus
Aid, Relief, and Economic Security (CARES) Act expiring the end of July.
The unprecedented nature of this crisis will impact the housing market, but to what extent is still being played out.
Very few historical recessions can relate to the current environment, making it difficult to distinguish what the
housing impacts will be. Like the rest of the economy, household demand started the year strong, with nearly 2.1
million new households formed over the 12 months ending March 31, reported by the U.S. Census Bureau.
Owner-occupied households made up all of this growth, which led to the homeownership rate to increase to
65.3%, up 110 bps from a year earlier. Data indicates renter-occupied households decreased 616,000 annually
as of the first quarter 2020. However, this data does not distinguish between multifamily and single-family rental-
occupied units. RealPage data captures the multifamily rental segment of the market and reported healthy
apartment absorptions averaging about 280,200 units over the same period.
Multifamily demand in the second quarter saw a meaningful slowdown given the nationwide shutdown. RealPage
reported demand in the second quarter registered only 34,000 units. Multifamily demand is seasonal with the
second quarter typically the busiest for new leases. Over the prior five years, demand in the second quarter alone
averaged 146,000 units each year. Annualized, demand is down to 177,000 units from 332,000 units, calculated

July 2020                                                                                                               2
Multifamily 2020 Midyear Outlook
as the average over the prior four quarters, seen in Exhibit 1. At the same time, RealPage shows a sizeable
increase in the number of renewals coinciding with a drop in demand. This implies that many people stayed in
their units and re-signed instead of moving out. As states begin to ease their lockdowns, we see some movement
in new leases which will help increase demand. The number of new lease signings saw a substantial increase the
last two weeks of May, up 19.4% in the last week and 7.4% in the prior week of May compared to the same
period a year earlier. However, given the slowdown in April and May, the percentage of new leases from mid-
March through May is 16% lower compared to the same period in the prior year.
Exhibit 1: Annual Multifamily Absorptions
400,000 58%
350,000 56%
300,000
54%
Renewal Conversion
Annual Demand
250,000
52%
200,000
50%
150,000
48%
100,000
50,000 46%
0 44%
Q2'10
Q3'10
Q4'10
Q1'11
Q2'11
Q3'11
Q4'11
Q1'12
Q2'12
Q3'12
Q4'12
Q1'13
Q2'13
Q3'13
Q4'13
Q1'14
Q2'14
Q3'14
Q4'14
Q1'15
Q2'15
Q3'15
Q4'15
Q1'16
Q2'16
Q3'16
Q4'16
Q1'17
Q2'17
Q3'17
Q4'17
Q1'18
Q2'18
Q3'18
Q4'18
Q1'19
Q2'19
Q3'19
Q4'19
Q1'20
Q2'20
Annual Demand Renewal Conversion
Sources: RealPage, Freddie Mac
According to the U.S. Census Bureau, the first quarter of the year started off similarly
to 2019 for multifamily permits and completions but starts were up 29% compared to Second
the average for 2019. In the second quarter, as the threat of virus materialized, quarter
permitting slowed while starts were severely impacted, dropping 41% from the first demand for
quarter of the year, as shown in Exhibit 2. Meanwhile, completions slowed moderately apartment
as well, but given many areas kept construction employment as essential the units is down
slowdown was not as severe as new construction. but new
As the effects of the virus have slowed the construction industry, Reis has adjusted its supply is also
baseline expectations for unit deliveries for 2020. From Reis’s second quarter First expected to
Glance report, completions are tracking lower this year by at least 30% compared with slow given
pre-Covid-19 levels. With fewer units expected to be delivered over the year, that may recent
provide some relief to rents and vacancies that will be impacted from a slowdown in lockdowns
demand.
July 2020 3Multifamily 2020 Midyear Outlook
Exhibit 2: Multifamily Permits, Starts and Completions (5+ Units, thousands)
600
MF Permits, Starts and Completions (thousands)
500
400
300
200
100
0
2005 2006 2007 2008 2009 2010 2011 2012 2013 2014 2015 2016 2017 2018 2019 1Q20 2Q20
MF Permits MF Starts MF Completions
Sources: Freddie Mac, Census Bureau, Moody’s Analytics
Vacancy rates started the year at strong levels despite higher completions over the past several years; 4.4% as
of the first quarter, reported by RealPage, down 30 bps over the prior 12 months. Since the end of March,
vacancy rates increased slightly up 20 bps over the quarter, and 60 bps over the year. The eviction moratoriums
enacted in many parts of the country, however, could be keeping that figure artificially low. Likewise, rent growth
started the year strong, at 2.9% annually over the first quarter, but started to decline in April. RealPage reports
rents declined -1% in the second quarter, and down -0.2% annually – the first annual decline in a decade. Yardi
Matrix reports similar overall market fundamentals in the second quarter but distinguishes a larger hit to higher-
end, luxury property fundamentals compared to working-class properties.
As the pandemic hit and questions arose regarding rent payments, the National Multifamily Housing Council
(NMHC) undertook a project to make that information transparent to the market. They utilize property
management software to report the percentage of renters paying part or all of their rent. The most recent monthly
update from June, reports that 95.9% of the over 11 million rental units surveyed paid some or all of their rent,
which is only 10 bps lower than June of 2019. Collections for the first few weeks of July came in slightly weaker
than June for the same time period, at 87.6% compared to 89%. A significant reason for the relatively strong rent
collections is the support from the federal government through the CARES Act. In addition to extending state
unemployment benefits an additional 13 weeks, it provided an additional $600 weekly through the end of July to
those who lost their job due to Covid-19 and a one-time stimulus check of $1,200 per person based on income.
This additional benefit has undoubtedly helped boost rent collections, the economy as a whole, as well as
significantly helped families struggling during a very difficult time. If the federal aid is not extended, we would
expect to see collections fall significantly as soon as September, and evictions may rise as a result.
The reduced rent collections varies across survey providers, but all show reduced collections over the past few
months compared to pre-pandemic collections. NMHC’s greatest gap was the first two weeks of April which
trailed the prior year by 5.1 percentage points. Throughout the month, collections improved and through June,
total monthly collections ranged from 3.1 to 0.1 percentage points lower than comparable months in 2019.
LeaseLock meanwhile reported 7 percentage points lower in April. Translating these reduced collections to the
property level, a typical property that operates at a debt service coverage ratio (DSCR) of 1.25x - which means
July 2020 4Multifamily 2020 Midyear Outlook
that net income is 25% higher than debt service – with an expense ratio around 50%,
would be able to withstand roughly a 9 percentage point decline in collections before Despite lower
impacting their ability to pay property expenses. Therefore, a property would rental
breakeven on their monthly expense and debt service payments if their rental income collections, the
declined by 9%. Properties with a higher DSCR would have a greater cushion to be shortfalls are
able to absorb more of an impact to rent collections. not expected
The market uncertainty was also evident on the investment side of the multifamily to significantly
market as sales transactions slowed in the second quarter. While falling interest rates impact well-
boosted some demand in the first few weeks of March, many market participants positioned
moved to the sidelines during the height of the pandemic. Real Capital Analytics properties to
(RCA) reported that deal volume in the second quarter was $13.8 billion, off 70% cover their
compared to second quarter 2019. While transaction volume can be volatile, this monthly
annual drop is the largest since 2009. During the same time, there was little payments
movement in cap rates as a result of reduced sales transactions but also from sellers
unwilling to take a price cut given the relative strength of multifamily investments.
Despite the weakening fundamentals in the second quarter, multifamily investments
continued to be viewed more favorably than other commercial property types. Furthermore, the strength over the
past 10 years has helped insulate some concerns of an onslaught of destressed properties hitting the market.
As of the second quarter, the 10-Year Treasury rate was 0.7% and RCA reported cap rates were relatively flat at
5.3%, indicating a cap rate spread of 460 bps; well above the average of 320 bps going back to 2001. As of the
first quarter 2020 the multifamily Commercial Property Price Index (CPPI) is up 10.2% over the past 12 months,
this is due mostly to sharp decline in interest rates and solid apartment market fundamentals at the beginning of
the year. Second quarter preliminary numbers show a relatively flat CPPI growth over the quarter, down -0.1%,
shown in Exhibit 3. While property prices are still up 7.1% over the year, the quarterly slowdown is the first since
the first quarter of 2010. Lower property price appreciation can partially be attributed to a lower number of
transactions but given the volatile few months some impact to property prices is expected but not as severe as
the Great Recession.
Exhibit 3: Multifamily Price Index, Cap Rate Spread and Treasury Rate
10% 200
Commercial Property Price Index
9% 180
Treasury, Spread and Cap Rate
8% 160
7% 140
6% 120
5% 100
4% 80
3% 60
2% 40
1% 20
0% 0
3Q04
1Q10
3Q18
1Q01
3Q01
1Q02
3Q02
1Q03
3Q03
1Q04
1Q05
3Q05
1Q06
3Q06
1Q07
3Q07
1Q08
3Q08
1Q09
3Q09
3Q10
1Q11
3Q11
1Q12
3Q12
1Q13
3Q13
1Q14
3Q14
1Q15
3Q15
1Q16
3Q16
1Q17
3Q17
1Q18
1Q19
3Q19
1Q20
10-year Treasury Rate Cap Rate Spread CPPI (RHS)
Sources: Freddie Mac, Real Capital Analytics CPPI, Federal Reserve Board, Moody’s Analytics
July 2020 5Multifamily 2020 Midyear Outlook Second Half of 2020 and Beyond: Slower Growth Ahead for the Multifamily Market The multifamily market and the broader economy are inexorably tied to how well and when the virus is contained. Ultimately the economy is unlikely to begin its return to full strength until an effective treatment or vaccine is available. That could take many months or years to be effectively administered on a large scale. As the economy has reopened, the jobs report is showing promising signs of people returning to work. However, at the same time that the reopenings are occurring, reported cases are increasing significantly. Another spike in cases could lead to more shutdowns and would cause a second dip, or W-shaped recovery. That being said, the consensus among economists is a swoosh or check-mark shaped recovery with a severe drop followed by a slow recovery playing out over the next few years. While unemployment is improving as the economy begins to recover, it is expected to remain elevated for the foreseeable future. A key driver in our rent and vacancy model is expected employment growth. At the beginning of 2020, employment growth was expected to grow moderately by 0.8% for 2020 which would help support rent growth above the inflation rate for the year. Updated forecasts as of this report expect employment will decline, current forecasts are -5.8%. At the same time, overall household income is also expected to decline significantly this year due to increased unemployment. Household income is an important input into our rent growth expectations since it plays a role in households’ ability to move and afford rents; higher income leads to more people moving, translating to higher demand and then higher rent growth. Similar to the employment growth expectations, household income forecasts have been cut drastically since the beginning of the year. Our 2020 Outlook was anticipating a robust 4.2% growth while forecasts are now expected to decline -0.4%. Typically, during a recession, we’d expect demand to slow as people lose jobs and income and have to reassess their housing costs. The pandemic was quick to hit the economy and job losses have been uneven across metros and industries. Those with more affluent jobs are more likely to be able to work remotely, whereas workers with lower- income jobs are more susceptible to layoffs. These dynamics will cause volatility in employment and income growth forecasts and any changes will have an impact on the growth expectations of the multifamily market this year. Apart from demand impacts from job and income losses, the question looms if the nature of this recession will cause a shift in renter sentiment and preferences - will urban living with shared elevators, amenity space, and small units continue to be acceptable or would larger space with more access to outdoor space be more desirable? Or will renters opt to move back closer to family if they can do their jobs remotely and not need the luxury of being close to their office? A recent report from Zillow estimated that 2.2 million Gen Z renters moved back in with family during the pandemic. For sale housing is also expected to see higher demand due to the record-breaking low interest rates available, but as home sales are tied to economic health, the increased uncertainty along with job and income loss is not expected to see a large shift to homeownership. Our general consensus is the impact to multifamily demand will not be long-lived but could change the amenities or unit size tenants look for in a property. While this pandemic is unique, similar, localized events such as the 9- 11 attacks on New York City did not see a long-term impact to high-rise, urban living. City centers continue to be hubs of human capital, art, and culture which draw many residents. However, a rise in demand for larger-sized rental units with more access to green spaces could be a result of the pandemic, as residents may need more space but may not yet be ready Rent growth in to give up living close to transit and walkable amenities. Similarly, demand for market 2020 is rate rental housing is expected to decrease, as people reassess their financials and expected to increased uncertainty in job security limit new household formations at the higher end decrease of the price scale. The lower end of multifamily properties may also feel the burden as -1.7%, and residents of those properties typically do not have enough savings to rely on during vacancy rates economic stress. increase The weakened economic drivers discussed above suggest that multifamily 250bps; fundamentals are expected to slow considerably in 2020 due to a drop in demand declining resulting in higher vacancy rates and lower rent growth. Seen in Exhibit 4, we predict gross income vacancy rates to increase 250 bps up to 7.2%. Rent growth is expected fall during growth by 2020, down -1.7% and be essentially flat in 2021 at 0.3%. The increasing vacancy -4.2% July 2020 6
Multifamily 2020 Midyear Outlook

rate coupled with falling occupancy is projected to cause income growth to fall significantly, we forecast gross
income to decline -4.2% in 2020 with no growth in 2021.

Exhibit 4: Vacancy Rate and Gross Income Growth, History and Forecast
 10%

  8%

  6%

  4%

  2%

  0%

 -2%

 -4%

 -6%
                  Vacancy Rate                                                       Historical Vacancy (1990-2019)
                  Gross Income Growth                                                Historical Income Growth (1990-2019)

Sources: Reis, Freddie Mac projections for 2020 and 2021 represented in the dotted lines

These projections are based off the severity of the economic impacts to the labor                               Additional
market and consumers. Our forecasts are based on the economic inputs available to                               government
us now and do not explicitly account for any subsequent government aid after the                                aid along with
CARES Act expires the end of July. Additional government aid would help boost                                   slowing
income for the remainder of the year, which would be beneficial to our rent and                                 completions
vacancy forecasts. Our model also does not capture the potential slowdown in new                                will give
supply; completions in a given year are calculated from lagged construction starts in                           potential
prior years which would not account for slower completions due to construction
                                                                                                                upside to
delays. Taking these metrics into account, the weakening in fundamentals would not
be as severe. Under such adjustments, we estimate the vacancy rate would increase
                                                                                                                multifamily
to 6.8%, rent growth decline by -1.2% resulting in gross income decline by -3.3% in                             forecasts for
2020. During this time of uncertainty, many things could change in the months ahead                             2020
which would impact these forecasts.
Other metrics we wouldn’t be able to capture are the eviction moratoriums that are
                                                                                                                A gross
keeping people in their rental units. This cannot be captured in our model and may be
keeping vacancy rates from increasing as severely. However, when those restrictions
                                                                                                                income decline
are lifted, we may experience an increase in evictions which would result in increased                          of -4.2% would
vacancy rates.                                                                                                  lower a
                                                                                                                property’s debt
This level of gross income decline is not expected to cause substantial stress at the
                                                                                                                coverage ratio
property level on the aggregate basis. Typically, loans are underwritten with a
minimum DSCR of 1.25x, implying that the income of a property is 25% greater than
                                                                                                                by only 0.05,
the amortizing debt coverage. A reduction of income by -4.2% would cause a 1.25x                                implying well-
DSCR to drop only 0.05, or to a 1.20x DSCR. At this level, it is expected that the                              positioned
property owner can continue to cover the debt payment with collected income.                                    properties will
Similarly, the property value of a loan underwritten to 75% loan-to-value (LTV) would                           be able to
experience an LTV increase of only 3.3 percentage points, or up to 78.3%, due to a                              make monthly
reduction in income by -4.2%.                                                                                   payments

July 2020                                                                                                                         7
Multifamily 2020 Midyear Outlook
Furthermore, more seasoned loans have had the benefit of above average gross income growth over the past
10years along with strong property price appreciation. Gross income grew on average 4.4% annually from 2010-
2019, while property prices increased on average 10.2% per year. Seasoned properties would have a higher
DSCR from the strong rent growth and lower LTV from the strong property price growth. All else equal – such as
no additional debt or only minimal expense increases – implies seasoned properties have a larger buffer to be
able to withstand the weakened growth expected this year and next. While there may be other factors at the
property or localized level that could impact the income, at the aggregate, the -4.2% reduction in gross income is
not anticipated to have a major impact on the borrower’s ability to pay the monthly debt service.
The effects of the pandemic on the apartment market vary significantly from metro to metro. Typically, in smaller
non-coastal metro areas the virus has only hampered the economics of the area and the apartment market
moderately, while in the larger gateway markets the effects have been more severe. These larger markets
typically had earlier and more stringent government mandated lockdowns in an effort
to contain the virus, while the smaller, interior metro areas usually had lower infection Vacancy rates
rates and less restrictions.
are expected
Vacancy rates are anticipated to increase in all the major metros we track, ranging to increase
from 370 bps in Phoenix to 60 bps in Pittsburgh. That being said, roughly 40% of across all
metros are anticipated to see 2020 vacancy rates remain below their 2000-2007 major metros,
averages, a testament to the strong fundamentals leading into this recession. Those with the
metros expected to see the highest year-over-year increase are also expecting higher highest in
overall vacancy rates, seen in Exhibit 5. Most of these areas are in the sunbelt region
of the nation, including Dallas, Charlotte, Jacksonville, Orlando and Phoenix. These
Dallas,
metros also typically see higher vacancy rates compared to the gateway, coastal Charlotte and
cities such as New York, San Francisco, and Los Angeles, which are forecasted to Jacksonville
see lower vacancy rate increases.
Exhibit 5: Annual Change in Vacancy Rate (bps) and 2020 Forecasted Vacancy Rate
400 10%
YoY Vacancy Change (bps)
320 8%
2020 Vacancy Rate
240 6%
160 4%
80 2%
0 0%
Atlanta
Boston
Phoenix
Indianapolis
Seattle
Chicago
Baltimore
Riverside
Los Angeles
Denver
Washington DC
Las Vegas
New York
Dallas
Raleigh
Knoxville
Cincinnati
Tacoma
Miami
Oklahoma City
West Palm Beach
San Jose
United States
Albuquerque
Orlando
Norfolk
Orange County
Austin
Ft. Worth
Memphis
Portland
Ft. Lauderdale
Colorado Springs
Oakland
San Diego
Tampa
Houston
Jacksonville
San Antonio
Salt Lake City
New Orleans
Nashville
San Francisco
Philadelphia
Cleveland
Pittsburgh
Sacramento
Charlotte
Minneapolis
2020 Vacancy YoY Change (bps) 2020 Vacancy Rate
Source: Reis, Freddie Mac projections
As we anticipated a majority of metros to experience vacancy rates increase above their pre-recession averages,
rent growth will slow in every metro. The decline in rents does not correspond with the magnitude of the increase
in vacancy rates. The larger coastal metros, which are not expected to see as dramatic vacancy increases, will
July 2020 8Multifamily 2020 Midyear Outlook
see the most dramatic declines in rent growth. This is consistent with past downturns, as vacancy typically
remains tighter in these areas at the expense of rent growth. But these areas are also experiencing more
stringent lockdowns due to higher Covid-19 cases due to the high population density in these areas.
Exhibit 6: Annual Rent Growth Change (bps) and 2020 Forecasted Rent Growth
400 2%
200 1%
0%
0
-1%
-200
-2%
-400
-3%
-600
-4%
-800 -5%
-1000 -6%
Boston
Seattle
Los Angeles
Baltimore
Chicago
Atlanta
Indianapolis
New York
Washington DC
Riverside
Tacoma
Las Vegas
Knoxville
Phoenix
San Jose
Denver
Raleigh
Oklahoma City
Dallas
West Palm Beach
Ft. Lauderdale
Orange County
Norfolk
Orlando
Memphis
United States
Ft. Worth
Salt Lake City
Miami
New Orleans
Colorado Springs
Cincinnati
Austin
San Francisco
Portland
San Diego
San Antonio
Cleveland
Oakland
Pittsburgh
Albuquerque
Philadelphia
Tampa
Nashville
Houston
Jacksonville
Minneapolis
Sacramento
Charlotte
Rent Growth Change Rent_Growth_Forecast
Source: Reis, Freddie Mac projections
Combining vacancy rate increases and rent growth in Exhibit 7, we see slightly Larger, coastal
counter intuitive positive correlation between rent growth and vacancy rate projections markets are
in 2020. Those metros expecting to see some of the greatest rent declines are also expected to
expected to see relatively small vacancy rate increases, in the lower left-hand corner see smaller
of the scatter plot. Meanwhile, metros with greater vacancy rate increases are vacancy rate
anticipated to see better rent growth, in the upper right-hand corner of the scatter plot. increases but
While this may seem counter intuitive, many areas in the sunbelt, such as Phoenix, greater decline
Dallas, and Atlanta, typically operate at higher vacancy rates and are still anticipated
in rent growth
to see a large amount of new supply despite moderate slowdowns from the pandemic
which will drive vacancy rates up. Since most of these areas had vacancy rates below
their pre-recession, they have room to increase vacancy rates without having to
sacrifice too much on rental gains. On the other hand, the larger, coastal areas of San Smaller,
Jose, San Francisco and New York, operate at tighter vacancy rates historically and interior
are expected to see larger hits to rent growth but lower vacancy rate increase. markets are
expected to
see larger
vacancy rate
increase but
either modest
rent growth or
only slight
declines
July 2020 9Multifamily 2020 Midyear Outlook
Exhibit 7: Annual Change in Vacancy Rate (bps) and 2020 Forecasted Rent Growth
400
PHO
350 JAC
CHR FTW
Vacancy Rate YoY Increase (bps)
DAL ATL
300
ORL TAM
LAS MEM AUS
250 USA IND
200
COO TAC
SAY RAL HOU RIV
SEA DEN NEO OAK SAC KNO
150 SAF
SAJ NAH
POT SAZ DCC
FOT MIN
WES
LOS VIR CIN
100 MIA OCO SAN OKLBAL PHI
NYC BOS
CLE ALB CHI
PIT
50
0
-6.0% -5.0% -4.0% -3.0% -2.0% -1.0% 0.0% 1.0% 2.0%
2020 Rent Growth
Source: Reis, Freddie Mac projections
When looking at the top and bottom 10 metros by gross income, the worst performing metros are concentrated in
the larger, coastal gateway cities, such as the Bay Area, southern Florida or New York/New Jersey. Meanwhile,
the stronger performing metros, while still negative given the low rent growth and increase in vacancy rate, are
among the smaller, interior metro areas.
Exhibit 8: Top and Bottom 10 Metros by Gross Income Growth for 2020
Metropolitan Area – 2020 Annualized 2020 Metropolitan Area 2020 Annualized 2020
Bottom 10 Growth in Gross Vacancy – Top 10 Growth in Gross Vacancy
Income Rate Income Rate
San Jose -6.1% 5.4% Chicago -1.3% 6.1%
Salt Lake City -5.9% 6.8% St. Louis -1.5% 5.3%
Miami -4.9% 7.8% Knoxville -1.5% 5.6%
San Francisco -4.9% 5.5% Pittsburgh -1.6% 4.5%
Ft. Lauderdale -4.8% 6.5% Philadelphia -1.8% 5.1%
Little Rock -4.3% 7.8% Albuquerque -1.8% 5.3%
Seattle -4.3% 6.9% Kansas City -2.1% 5.4%
Denver -4.2% 7.2% Baltimore -2.2% 5.2%
Central New Jersey -4.1% 3.6% Austin -2.3% 8.1%
New York City -4.0% 4.8% Sacramento -2.3% 4.4%
United States -4.2% 7.2%
Source: Freddie Mac projections
The majority of the bottom 10 metros are driven more by declining rents than increasing vacancy rates, except for
Little Rock which is forecasted to see higher vacancy and lower rents contributing to lower gross income growth.
The Bay Area has already seen sizeable rent declines reported by RealPage in the second quarter; San Jose
July 2020 10Multifamily 2020 Midyear Outlook
and San Francisco down -4.1% and -4.5%, respectively. Along with southern Florida and the New York City area
the high cost of living in these areas makes them susceptible to larger price swings. Despite a slowdown in new
completions, some areas are still slated to see higher supply paired with slowing demand, such as Seattle,
Denver and, to a lesser extent, Salt Lake City. Overall, lower employment and income growth are expected to
drive rents down in these areas.
On the flip side, the top 10 metro areas are made up primarily of mid-western or smaller sunbelt areas. As you
can see, most of these metros congregate in the lower right-hand corner of Exhibit 7, with relatively small
increases in vacancy rates and only modest decreases in rent growth. Many of these areas typically see lower
economic and multifamily growth, which is resulting in a less-severe the impact to 2020 forecasts compared to
the larger metros or those areas that have seen substantial growth in the past several years. These areas are
also seeing low vacancy rates going into 2020 compared to their long-run average allowing vacancy rates room
to increase before impacting rent growth.
As mentioned for the national level forecasts, the metro level forecasts do not take into account any additional
government aid nor a potential reduction in new supply given the construction delays. Applying similar
adjustments as we showed at the national level will have differing impacts across metro areas. For example, in
San Jose, the impacts would be greater than experienced at the national level, with gross income growth
improving 150 bps from -6.1% to -4.6%. Whereas in Phoenix, the impacts would be more minor with gross
income growth only improving 50 bps from -2.9% to -2.4%. Meanwhile, Chicago would see virtually no change
from these adjustments.
Multifamily renters are expected to be impacted more from this recession due to the
impacts of the jobs lost which are more typical to renters (for example, leisure and Renters are
hospitality, retail, etc.) as well as lower savings compared with homeowners or higher- expected to be
income workers. Harvard’s Joint Center of Housing Studies (JCHS) found that roughly harder hit from
44% of U.S. households have experienced employment loss during the pandemic, up the job and
to 54% for renter households. Many unemployed renters will have to rely on income losses
unemployment benefits to cover housing, food, and other necessary expenditures. during this
Analyzing unemployment benefits to rental housing costs gives an insight into areas recession and
we may anticipate would have a harder time paying rents which could result in weaker
as a result will
fundamentals.
be more cost
Typically, areas with a higher cost of living also have higher unemployment benefits, burdened
but even so, in many of those areas the benefits would not cover the median rents.
Exhibit 9 maps out the major metro areas we track and their relation of unemployment Areas with
benefits to median rent. We calculate unemployment benefits per metro area using higher median
the median renter income and the state appropriate calculation (if the metro crosses rents and low
multiple states, we calculate weighted average by population). We then compare this unemployment
to median rent in that area. Those areas above 100% indicate if a renter who made benefits could
the median renter income was laid off, their unemployment benefits alone would not result in
cover the median rent in that area. On average, 70% of unemployment benefits would additional
be needed to pay the median rental income, ranging from 41% in Portland to 117% in
stress on
San Jose. Five metro areas would require more than 100% of their unemployment
benefits to afford the median income, San Jose, Miami, Phoenix, Orlando and San fundamentals
Francisco. The Bay Area would require such a high percentage of unemployment
income due to the higher cost of living, whereas in Arizona and Florida, the high
percentages are due to the lower unemployment benefits in those states.
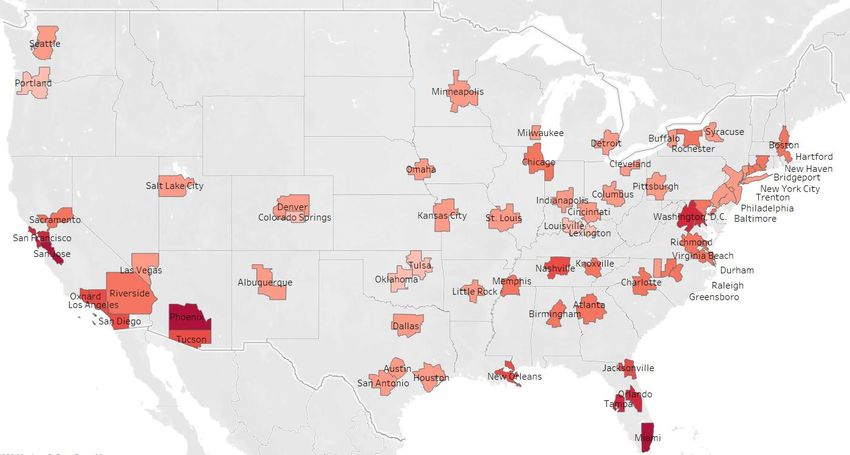
July 2020 11Multifamily 2020 Midyear Outlook Exhibit 9: Percent of Unemployment Benefits Needed to Pay Median Rent by MSA Source: American Community Survey (ACS) 2018 estimates, Individual State Unemployment Benefits, Freddie Mac When the additional $600 unemployment benefit from the CARES Act was factored in, every metro area was below 100%, ranging from 20% in Lexington to 50% in San Jose, and averaging 27% of unemployment benefits to pay the median income. If the unemployment rate remains elevated after the termination of the additional unemployment benefits from the CARES Act, we would anticipate renters to become more cost burdened resulting in more evictions, doubling up, or moving to lower cost housing options. Origination Market Forecast The multifamily origination market started off strong in 2020 before the pandemic proliferated throughout the economy. Our volume saw large spikes in the beginning of March as uncertainty swept across the market before dropping off in late March Origination through April. As of June, volume has picked back up to slightly higher levels than volume is seen in the beginning of the year. Our volume trends are not reflective of the overall expected to market trends since our role as a GSE is to provide liquidity especially during a time of decline in market stress and as other market participants are sidelined during this uncertainty. 2020, the We estimate $374 Billion of multifamily volume in 2019, up 10.3% from 2018. Due to severity of the great uncertainty in the recovery of the economy, we forecast total multifamily which could volume over a range of scenarios for the next two years, shown in Exhibit 10. In the range from downside scenario, the economy is expected to remain in a recession through 2021 -20% to -40% which would result in volume declining 41% this year and an additional 5% next year. Even in this worst case, volume decline does not reach the levels seen during the July 2020 12
Multifamily 2020 Midyear Outlook

Great Recession. In the upside scenario, which would see year end unemployment improve to below 8% and
Real GDP down roughly -2%, would result in a 20% decline in volume in 2020, before fully recovering in 2021
back up to $375 Billion. In these scenarios, our volume share would adjust based on economic strength; the
weaker the economy the greater our share as we provide more liquidity to the market while the stronger the
economy the lower our share as more market participants remain in the market. Therefore, while we anticipate
total multifamily volume in 2020 to decrease from 2019 levels, our volume is anticipated to remain relatively flat
during that time due to our market share adjusting to the economic situation.

Exhibit 10: Multifamily New Purchase and Guarantee Volume ($ Billions)
  $400
              Freddie Mac Multifamily                                      Fannie Mae Multifamily
  $350        Life Insurance Companies                                     CMBS, Multifamily Only

  $300        Other (Banks, S&Ls, Mortgage Co., etc)                       Downside Scenario
              Baseline Scenario                                            Upside Scenario
  $250

  $200

  $150

  $100

   $50

    $0

                                                                                                                                                    2019*

                                                                                                                                                            2020*

                                                                                                                                                                    2021*
            2000

                   2001

                          2002

                                 2003

                                        2004

                                               2005

                                                      2006

                                                             2007

                                                                    2008

                                                                            2009

                                                                                   2010

                                                                                          2011

                                                                                                 2012

                                                                                                        2013

                                                                                                               2014

                                                                                                                       2015

                                                                                                                              2016

                                                                                                                                     2017

                                                                                                                                            2018
Sources: Mortgage Bankers Association, Freddie Mac projections
Note: 2019-2021 results are projections as of July 2020

The multifamily market started the year on a strong footing which will has positioned it
well to brace for the impacts from the Covid-19 fueled recession. We started to see                                                                The robust
the impacts hit the multifamily market in the second quarter data with a drop in                                                                   growth over
demand and negative rent growth. By the end of the second quarter we started seeing                                                                the past
some of those metrics improve but expect the year to end with negative rent growth                                                                 several years
and higher vacancy rates. The severity of which will be subjected to the shape of the                                                              will positioned
recovery and if we can avoid a second round of shutdowns. Any additional                                                                           the industry to
government support, eviction moratoriums, and construction delays will also impact                                                                 absorb the
fundamentals this year. Overall there is no long-term perceived change in renter
                                                                                                                                                   impacts from
perceptions from the pandemic but the multifamily market will experience some stress
this year from the weakening economic conditions.                                                                                                  this recession

For more insights from the Freddie Mac Multifamily Research team, visit https://mf.freddiemac.com/research.

July 2020                                                                                                                                                                   13
You can also read


