INVESTORS PRESENTATION TO - DHC IS WELL POSITIONED TO CAPITALIZE ON THE HEALTHCARE DEMANDS OF AN AGING POPULATION - Senior Housing Properties Trust
←
→
Page content transcription
If your browser does not render page correctly, please read the page content below
Nasdaq: DHC

                  DHC IS WELL POSITIONED
                  TO CAPITALIZE ON THE
                  HEALTHCARE DEMANDS OF
                  AN AGING POPULATION.

PRESENTATION TO

INVESTORS
JANUARY 2020
WARNING CONCERNING FORWARD LOOKING STATEMENTS

This presentation contains statements that constitute forward-looking statements within the meaning of the Private Securities Litigation Reform Act of 1995 and other securities laws. Also, whenever we use words such as “believe”, “expect”,
“anticipate”, “intend”, “plan”, “estimate”, “will”, “may” and negatives or derivatives of these or similar expressions, we are making forward-looking statements. These forward-looking statements are based upon our present intent, beliefs or
expectations, but forward-looking statements are not guaranteed to occur and may not occur. Forward-looking statements in this presentation relate to various aspects of our business, including our policies and plans regarding investments,
financings and dispositions, our ability to retain our existing tenants, attract new tenants and maintain or increase current rental rates, the credit qualities of our tenants, our ability to compete for tenancies and acquisitions effectively, our ability
to maintain and increase occupancy, revenues and NOI at our senior living communities, our acquisitions and sales of properties, our ability to complete our target dispositions in accordance with our stated plan, our ability to pay distributions to
our shareholders and the amount of such distributions, our ability to raise debt or equity capital and reduce leverage, the future availability of borrowings under our revolving credit facility, our ability to pay interest on and principal of our debt, our
ability to appropriately balance our use of debt and equity capital, our credit ratings, our expected management fees, the expected trading price of our common shares, whether the aging U.S. population and increasing life spans of seniors will
increase the demand for senior living services, wellness centers and other medical and healthcare related properties and healthcare services, our expectations about the benefits of our recently completed restructuring transaction with Five Star
and our belief that Five Star has adequate financial resources and liquidity and the ability to meet its obligations to us and to manage our senior living communities satisfactorily.

Our actual results may differ materially from those contained in or implied by our forward-looking statements as a result of various factors, such as the impact of conditions in the economy and the capital markets on us and our tenants and
managers, compliance with, and changes to, applicable laws, regulations and rules, limitations imposed on our business and our ability to satisfy complex rules in order for us to qualify for taxation as a REIT for U.S. federal income tax
purposes, competition within the healthcare and real estate industries, actual and potential conflicts of interest with our related parties and acts of terrorism, outbreaks of so called pandemics or other manmade or natural disasters beyond our
control. For example: (a) Five Star has experienced significant operating and financial difficulties as a result of a number of factors, some of which are beyond Five Star’s control, and if Five Star’s operations are unprofitable, it could become
insolvent and its ability to manage our senior living communities may be negatively impacted; (b) if Five Star fails to provide quality services at our senior living communities, the NOI generated by these communities may be adversely affected;
(c) the conversion of our previously existing lease arrangements with Five Star to management arrangements effective as of January 1, 2020 may result in our realizing significantly different operating results from our senior living communities;
(d) our distributions to our shareholders are set by our Board of Trustees, which considers many factors when setting the distribution, including our historical and projected net income, Normalized FFO, the then current and expected needs and
availability of cash to pay our obligations, distributions which we may be required to pay to maintain our qualification for taxation as a REIT and other factors deemed relevant by our Board of Trustees in its discretion, and our projected cash
available for distribution in the future may change and may vary from our expectations; accordingly, future distributions may be increased or decreased and we cannot be sure as to the rate at which future distributions will be paid; (e) our ability
to make future distributions to our shareholders and to make payments of principal and interest on our indebtedness depends upon a number of factors, including our future earnings, the capital costs we incur to lease and operate our properties
and our working capital requirements; accordingly, we may be unable to pay our debt obligations when they become due or to maintain our current rate of distributions on our common shares and future distributions may be reduced or
eliminated; (f) we may not complete the sales of any additional properties we plan to sell and may determine to sell fewer, additional or other properties than those we have identified for sale, and we may sell properties at prices that are less
than we expect and less than their carrying values and may incur losses on any such sales or in connection with decisions to pursue selling our properties; (g) contingencies in our acquisition and sale agreements may not be satisfied and our
pending acquisitions and sales and any related management or lease arrangements we expect to enter may not occur, may be delayed or the terms of such transactions or arrangements may change, (h) the capital investments we are making
at our senior living communities in response to competitive pressures resulting from ongoing new supply of senior living communities may not achieve expected results and our senior living communities may not be competitive despite these
capital investments; (i) we may spend more for capital expenditures than we currently expect; (j) any joint venture arrangements that we may enter may not be successful; (k) our tenants may experience losses and default on their rent
obligations to us; (l) some of our tenants may not renew expiring leases, and we may be unable to obtain new tenants to maintain or increase the historical occupancy rates of, or rents from, our properties; (m) we may be unable to identify
properties that we want to acquire or to negotiate acceptable purchase prices, acquisition financing, management agreements or lease terms for new properties; (n) rents that we can charge at our properties may decline because of changing
market conditions or otherwise; (o) we cannot be sure that we will enter into any additional management arrangements or other transactions with Five Star; (p) continued availability of borrowings under our revolving credit facility is subject to
our satisfying certain financial covenants and other credit facility conditions that we may be unable to satisfy; (q) actual costs under our revolving credit facility or other floating rate debt will be higher than LIBOR plus a premium because of fees
and expenses associated with such debt; (r) our option to extend the maturity date of our revolving credit facility is subject to our payment of a fee and meeting other conditions that may not be met; (s) changes in our credit ratings may cause
the interest and fees we pay to increase; (t) our residents and patients may become unable to fund our charges with private resources and we may be required or may elect for business reasons to accept or pursue revenues from government
sources, which could result in an increased part of our NOI and revenue being generated from government payments and our becoming more dependent on government payments; (u) circumstances that adversely affect the ability of seniors or
their families to pay for our tenants’ and manager’s services, such as economic downturns, weak housing market conditions, higher levels of unemployment among our residents’ family members, lower levels of consumer confidence, stock
market volatility and/or changes in demographics generally could affect the profitability of our senior living communities; (v) our unspent leasing related obligations may cost more or less and may take longer to complete than we currently
expect, and we may incur increasing amounts for these and similar purposes in the future; (w) operating deficiencies or a license revocation at one or more of our senior living communities may have an adverse impact on our ability to obtain
licenses for, or attract residents to, our other communities; (x) the trading price of our common shares is beyond our control and may increase or decrease more than we currently expect; and (y) the advantages we believe we may realize from
our relationships with related parties may not materialize.

Our Annual Report on Form 10-K for the year ended December 31, 2018, including under the heading “Risk Factors,” our Quarterly Report on Form 10-Q for the quarter ended September 30, 2019 and our other filings with the SEC identify
other important factors that could cause differences from our forward-looking statements. Our filings with the SEC are available on the SEC’s website at www.sec.gov. You should not place undue reliance upon our forward-looking statements.
Except as required by law, we do not intend to update or change any forward-looking statements as a result of new information, future events or otherwise.

                                                                                                   NON-GAAP FINANCIAL MEASURES
This presentation contains non-GAAP financial measures including normalized funds from operations (FFO), adjusted EBITDA, NOI and cash basis NOI. Reconciliations for these metrics to the closest U.S. generally accepted accounting
principles (GAAP) metrics are included in an appendix hereto.

                                                                                                                                                                                                                                                                   2
Reasons to Own DHC

+   An institutional quality portfolio that is diversified across the healthcare spectrum, and well
    positioned for long-term stable growth.

+   Long-term, positive healthcare demographics that should result in improved
    industry fundamentals.

+   Predominantly private pay assets with limited exposure to government
    reimbursement programs such as Medicare and Medicaid.

+   Healthy tenant credit profile following the recent restructuring
    with senior living operator, Five Star Senior Living.

+   Attractive dividend yield that is well covered by
    cash flows.

+   Strong management platform and efficiency
    advantages.

+   Deep valuation disconnect, which
    creates an attractive buying
    opportunity.

                                                                                                      3
Disciplined Business Plan

       Execute disposition strategy

       With the Five Star lease restructuring, DHC announced its plan to sell
       approximately $900M of non-core properties. We believe this disposition
       program will improve the company’s institutional-quality portfolio, while lowering
       the overall leverage of the DHC platform.

       Invest internally

       •   Invest in medical office and life science buildings and senior living
           communities through capital improvements or strategic repositioning to attract
           high quality tenants.
       •   Evaluate capital improvements, expansion, and conversion projects in senior
           living communities to take advantage of opportunities in certain markets
           where demand is evident.

       Provide for more effective asset management

       Exercise additional asset management rights in senior living communities
       following the agreement to convert from leases to management contracts.
                                                                                            4
A Well Positioned National Healthcare REIT

 DHC is well positioned to capitalize on the healthcare demands of an aging U.S. population.

      436(1)                                                        $8.7B(1)                12.2M sq. ft.(1)              32,410(1)
Healthcare Related                                                Investment              Medical Office & Life   Senior Living Community
    Properties                                                     Portfolio                Science Space                   Units

 Focused growth
             –      Well-located medical office and life science buildings, and private pay senior living communities in strong
                    markets.
 Scale and diversity
             –      With an $8.6 billion national investment portfolio and approximately 672 MOB tenants, DHC is well scaled with
                    strong credit diversity.

 (1)   As of September 30, 2019, includes eight properties classified as held for sale.
                                                                                                                                     5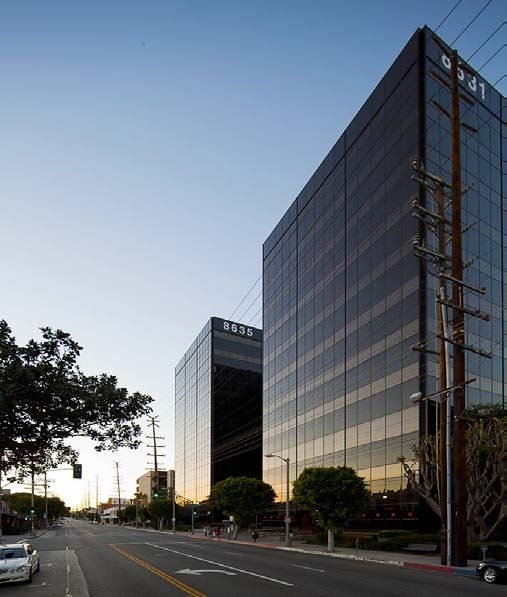
Portfolio Profile

  DHC’s historically opportunistic approach to investing in quality healthcare related properties
  has created a portfolio that is broadly diversified with national scale.

      Geographic Diversification By Holdings                                                                                        Geographic Diversification By
                                                                                                                                  Gross Book Value of Real Estate(2)
                                                                                                                 MA                          16%              MD                        4%
                                                                                                                 CA                          10%              NC                        3%
                                                                                                                 FL                          9%               IL                        3%

                                                                                                   # of
                                                                                                                 TX                          7%               VA                        3%
                                                                                                 Property
                                                                                                 Holdings        GA                          5%               30 Other States + D.C.    36%
                                                                                                                 WI                          4%               Total                     100%

                                                                                                                                               Asset Class By NOI(1)(3)
                                                                                                                                                      (based on Q3 2019 NOI)

                                                                                                                     Life Science                                                      27%
                                                                                                                     Medical Office Buildings                                          23%

436(1) properties located in 41 states and Washington, D.C.                                                          Independent Living                                                23%
                                                                                                                     Assisted Living                                                   20%
                                                                                                                     Wellness Centers                                                  4%
                                                                                                                     Skilled Nursing Facilities                                        3%

(1)    As of and for the quarterly period ended September 30, 2019, includes eight properties classified as held for sale.
(2)    Gross book value of real estate assets is real estate assets at cost plus certain acquisition costs, before depreciation and purchase price allocations, less impairment                6
       writedowns, if any. Excludes properties classified as held for sale, if any.
(3)    See Appendix for the calculation of NOI and a reconciliation of net (loss) income determined in accordance with GAAP to that amount.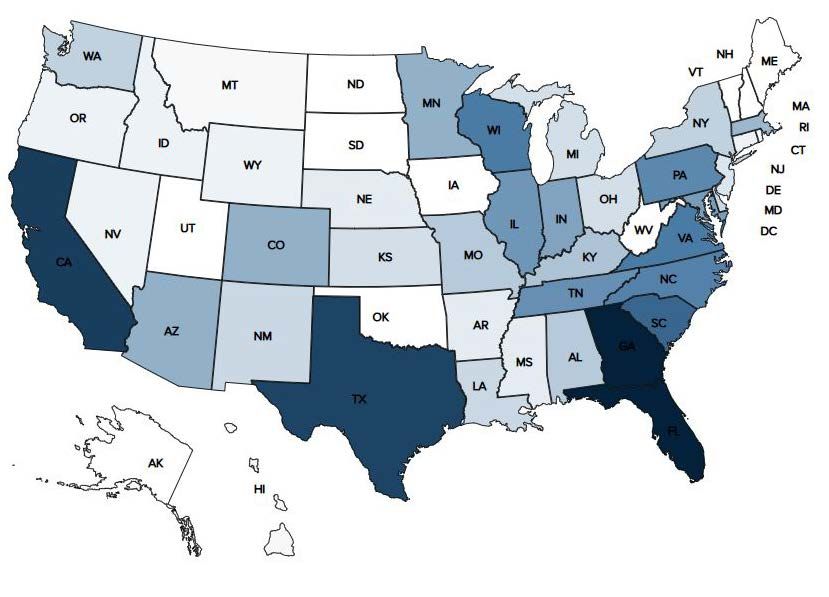
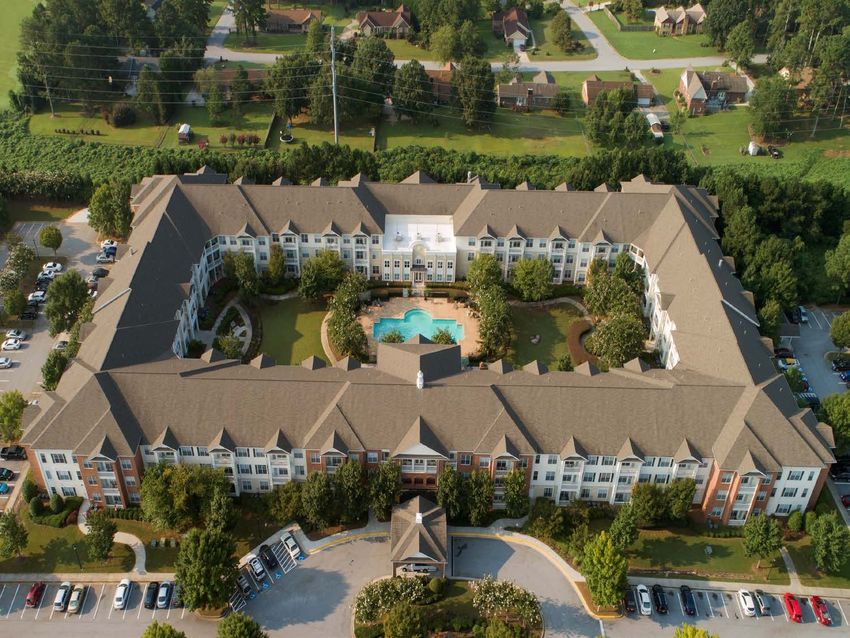
High Quality Medical Office and Life Science Portfolio

Mason, OH.                                                                                                                                                                                          San Antonio, TX.
Tenant: AtriCure, Inc.                                                                                                                                                              Tenant: Texas Center for Athletes.
Square feet: 95,780.                                                                                                                                                                            Square feet: 129,432.

Los Angeles, CA.                                                                 Boston, MA.
Tenant: Cedars-Sinai Medical Center.                                             Tenant: Vertex Pharmaceuticals.
Square feet: 330,892.                                                            Square feet: 1,134,189.                                                                                       Maryland Heights, MO.
                                                                                                                                                                                             Tenant: Magellan Health.
                                                                                                                                                                                                Square feet: 232,521.
                                                                                   Approximately 672 tenants with
                                                                                          occupancy of 92.3%(1) at
                                                                                              September 30, 2019.
                                                                                 Overland Park, KS.
                                                                                 Tenant: IQVIA
                                                                                 Square feet: 239,366
                                                                                                                                                                                                       Valencia, CA.
                                                                                                                                                                                           Tenant: Advanced Bionics.
                                                                                                                                                                                               Square feet: 146,385.

(1)   Occupancy data is as of quarter end and includes (i) out of service assets undergoing redevelopment, (ii) space which is leased but is not occupied or is being offered for                                7
      sublease by tenants, and (iii) space being fitted out for occupancy.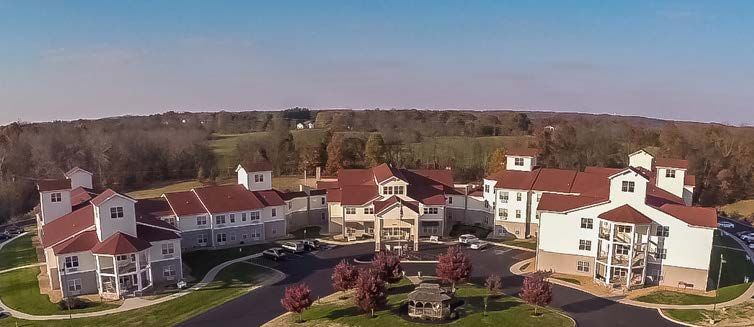
Medical Office and Life Science Segment

                                                                                                                                Life Science
                                                                                                                         Laboratory and research
                                                                                                                                 space.

         Patient Care                                                                                     54%
Clinics, outpatient centers,                                                    Medical
   and doctors’ offices.                                                      Office and
                                                                             Life Science
                                                      37%                     Segment(1)
                                                                                                                                                                              •    Pharmaceutical company with a focus on
                                                                                                                                                                                   medicines that treat cystic fibrosis.

                                                                                       9%
                                                                                                                                                                              •    Market Cap. of approximately $51 billion(2).
                                                                                                                                                                              •    LTM revenues of $3.6 billion.
           Other Medical Related                                                                                                                                              •    Approved medicines include SYMDEKO,
              Medical equipment                                                                                                                                                    ORKAMBI, KALYDECO, and TRIKAFTA.
          manufacturing & other medical
                related tenants.

                                                                                                                                                          % of DHC
          Top 3 Medical Office and Life                                                                         Annualized Rental
                                                                            Square Feet                                                                  Annualized                      Lease Expiration     Property Type
                Science Tenants                                                                                    Income(3)
                                                                                                                                                       Rental Income(3)
    Vertex Pharmaceuticals, Inc.(4)                                           1,082,000                                $94,956 (4)                             14.7% (4)                           2028        Life Science
    Advocate Aurora Health                                                     643,000                                   $16,896                                 2.6%                             2024         Patient Care
    Cedars-Sinai Medical Center                                                 145,000                                  $15,265                                 2.4%                        2019 – 2032       Patient Care
   (1)    Based on Q3 2019 NOI. See Appendix for the calculations of NOI and a reconciliation of net (loss) income determined in accordance with GAAP.
   (2)    As of close of market, October 30, 2019. Source: Nasdaq.
   (3)    Annualized rental income is based on rents pursuant to existing leases as of September 30, 2019. Annualized rental income includes estimated percentage rents, straight line rent adjustments and                   8
          estimated recurring expense reimbursements for certain net and modified gross leases; excludes lease value amortization at certain of our MOBs and wellness centers.
   (4)    The property leased by this tenant is owned by a joint venture in which we own a 55% equity interest. Rental income presented includes 100% of rental income as reported under GAAP.
Medical Office and Life Science Dynamics
Strong demographic tailwinds driving healthcare real estate demand.
($ in
Outpatient Services Expenditures (2)
Between now and 2030, more than 20 percent (or the billions)
equivalent of 10,000 Baby Boomers per day) of the $1,200
total U.S. population will reach the age of 65(1), which is
$1,000
the MOB/Life Sciences primary target demographic.
$800
Physician and clinical services spending is projected to
$600
grow at an average rate of 5.4% per year and reach
$1.2 trillion by 2027. $400
Life Science VC Funding(3) $200
18 2019 2021 2023 2025 2027
16
14
The demand for life science innovation is rapidly growing. Real
12
10 estate is becoming a key component for collaborative R&D
Billions ($)
8
environments such as incubator spaces in innovation clusters(3).
6
4 Venture capital funding to the life science industry has surged
2
0
over the past few years, driving employment growth and
Q2 2005
Q4 2005
Q2 2006
Q4 2006
Q2 2007
Q4 2007
Q2 2008
Q4 2008
Q2 2009
Q4 2009
Q2 2010
Q4 2010
Q2 2011
Q4 2011
Q2 2012
Q4 2012
Q2 2013
Q4 2013
Q2 2014
Q4 2014
Q2 2015
Q4 2015
Q2 2016
Q4 2016
Q2 2017
Q4 2017
Q2 2018
Q4 2018
increased attention from new investors. VC Funding is up 10.3%
CAGR since the first quarter of 2015(3).
(1) Source: U.S. Census Bureau.
(2) Source: Centers for Medicare & Medicaid Services, Office of the Actuary, September 2018. 9
(3) Source: U.S. BLS, CBRE Research, PWCMoneyTree, Q4 2018. Note: Year-over-year changes in 4-quarter rolling sum of VC funding in Biotechnology, Drug
Development, Drug Discovery, Disease Diagnostics, and Pharma/Drugs.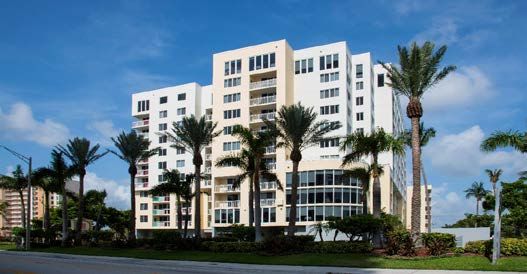
Growing Medical Office and Life Science Exposure
DHC has been shifting its portfolio mix toward Medical Office and Life Science, focusing on high-
quality life sciences and medical office properties
Diversifying into Medical Office & Life Science, Medical Office & Life Science Annualized
Cash Basis NOI(1) Rental Income Expiring(2)
2008 2015 3Q19 50%
39%
40%
42%
49% 51% 30%
58%
100%
20%
13%
8% 9%
All Other Healthcare Properties 10% 7% 6% 6% 7%
2% 3%
MOBs and Life Science
0%
High Quality Medical Office & Life Science Portfolio &
Healthy Historical Occupancy
(As Reported)(3)(4)
100%
97.0% 96.4% 96.5%
95.9% 95.9%
94.9% 95.0% 94.5% For the Medical Office and Life Science segment
95% 93.3% 92.5%
90% occupancy was 92.5%(3)(4).
85%
Well laddered lease expiration schedule.
80%
75%
Weighted average remaining lease term is 6.4 years(5).
2010 2011 2012 2013 2014 2015 2016 2017 2018 LTM (3)
MOB Portfolio Occupancy
(1) See Appendix for the calculations of NOI and cash basis NOI and a reconciliation of net (loss) income determined in accordance with GAAP.
(2) Annualized rental income is based on rents pursuant to existing leases as of September 30, 2019, including straight line rent adjustments, estimated recurring expense reimbursements for certain
net and modified gross leases and excluding lease value amortization at certain of our MOBs. Rental income amounts also include 100% of rental income as reported under GAAP from a property
owned in a joint venture arrangement in which we own a 55% equity interest.
(3) Operating data for multi-tenant MOBs is presented as LTM as of June 30, 2019. 10
(4) MOB occupancy data is as of quarter end and includes (i) out of service assets undergoing redevelopment, (ii) space which is leased but is not occupied or is being offered for sublease by tenants,
and (iii) space being fitted out for occupancy. MOB occupancy as of September 30, 2019 was 92.3%.
(5) Average remaining lease term is weighted by annualized rent, and as of September 30, 2019.Senior Living Portfolio
Bozeman Lodge. Granite Gate. Barrington Terrace at Boynton Beach
Bozeman, MT. Prescott, AZ. Boynton Beach, FL.
131 Units. 127 Units. 138 Units.
Fieldstone Place.
Clarksville, TN.
Operators include: Five Star 102 Units.
Senior Living, Brookdale
Senior Living, and several
private senior living
operators.
FVE Premier Residences.
Pompano Beach, FL.
169 Units.
The Palms at Lake Spivey The Forum at Deer Creek
Jonesboro, GA. Deerfield Beach, FL.
200 Units. 288 Units.
11Current Environment & Future Demographics
Future growth warrants transition to RIDEA management structure which occurred at DHC
Age 85+ Population Growth(1) Senior Living Supply-Demand Trends(2)
16 9% 4.0% 120
2019E – 2035E NIC Actuals NIC Forecast
8% 3.5% 100
7%
12 3.0% 80
6%
2.5% 60
Millions
5%
2.0% 40
8
4%
1.5% 20
3%
1.0% -
4
2%
0.5% (20)
1%
0.0% (40)
2017Q3
2017Q4
2018Q1
2018Q2
2018Q3
2018Q4
2019Q1
2019Q2
2019Q3
2019Q4
2020Q1
2020Q2
2020Q3
0 0%
85+ Population Growth Rate (%) Net Supply Growth (bps, Right Axis) Supply Growth (%, Left Axis) Absorption (%, Left Axis)
Compelling Long-Term Demographics Operating Environment Easing
- Senior living targeted demographic of 85+ population is - Absorption outpaced Supply in 2019 for the first time
projected to grow over 30% in the next five years. since the second quarter of 2016.
- National healthcare spending is projected to grow at an - Combined with the favorable demographic outlook, we
average rate of 5.7% per year and reach $6.0 trillion by believe the supply-demand imbalance that has
2027(3). persisted in recent history is shifting in favor of senior
living ownership.
12
(1) Source: U.S. Census Bureau, “2014 National Population Projections”.
(2) Source: National Investment Center for the Seniors Housing and Care Industry (NIC), as of Q3 2019.
(3) Source: Centers for Medicare & Medicaid Services, www.cms.gov.Five Star Transaction Overview
Shifting to RIDEA to participate in the upside from a recovering senior living industry.
New Management Agreements with Five Star
DHC and Five Star have entered into new management agreements to have Five Star manage all of
DHC’s communities previously leased or managed by Five Star.
DHC and DHC Shareholders Received Five Star Shares
Five Star issued common shares to increase DHC’s and DHC shareholders’ combined ownership to
approximately 85% of Five Star.(1)
Completed Transaction
DHC and Five Star completed the required regulatory approval process to convert leased communities to
a RIDEA management structure.
Financial restructuring immediately improved Five Star’s financial position and liquidity as well as helped
DHC facilitate the transition to a RIDEA management structure.
(1)Excluding
13
any shares previously owned by DHC shareholders. As of 1/1/20.Summary of Key Benefits From FiveStar Restructuring
Maximize Value and Performance of DHC’s Investments in Senior Living
Age 85+ Population Growth (2)
20 10%
+ Positions DHC for Greater Potential Financial Upside 16 8%
Millions
12 6%
– Current senior living supply and demand fundamentals at historic lows coupled 8 4%
with expected future demand increases creates potential for greater financial 4 2%
upside for DHC and DHC shareholders in the future. 0 0%
+ Enables DHC and DHC Shareholders to Share Additional Upside from 85+ Population Growth Rate (%)
Investment in Five Star
– DHC and DHC shareholders now own 85%(1) of Five Star and will benefit from
sharing in Five Star’s potential future profitability. Five Star is a healthy
company at the end of this transaction, with projected annual EBITDA of $20M
to $30M, minimal capital expenditure requirements, low leverage and continued
direct ownership in 20 senior living communities.
+ Maintains Relationship with a Financially Stable National Senior
Living Operator
– Allows DHC to retain the efficiencies of working with a large financially stable
national operator in contrast to forming new relationships with a number of
small, local, private, and potentially unstable operators throughout the U.S. (3)
+ Allows Greater Asset Management Oversight
– The RIDEA management structure provides DHC with additional asset
management rights in senior living communities managed by Five Star.
(1) Excluding any shares previously owned by DHC shareholders. As of 1/1/2020.
(2) Source: 14
U.S. Census Bureau “2014 National Population Projections”.
(3) Blue states represent states where Five Star currently operates senior housing communities.Senior Living Portfolio Outlook
Historical Portfolio (as of September 30, 2019)
Community Number of
Operator Units(1)
Mix Communities(1) Approximately, 69.0% of units are currently under
Five Star Senior Living(7) IL, AL, CCRC 152 16,899 triple net leases.
83.6% triple net leased weighted average
Brookdale Senior Living AL 18 940
occupancy(2)(3).
Other Private Operators(7) IL, AL 23 2,436 1.51x weighted average rent coverage(3)(4)(5).
NNN Subtotal 193 20,275 86.0% managed communities weighted average
Managed Senior Living IL, AL, CCRC 77 10,168 occupancy(3)(6).
Total Senior Living 270 30,443
Conversion
Proforma Converted Portfolio (as of September 30, 2019)
Community Number of
Operator Units(1) Converted portfolio does not reflect full $900M of
Mix Communities(1)
planned dispositions.
Brookdale Senior Living AL 18 940 The conversion occurred on January 1, 2020 in order
to maintain compliance with complex tax rules
Other Private Operators(7) IL, AL 23 2,436 affecting REITs, including limitations on the amount a
NNN Subtotal 41 3,376 REIT may own of a tenant during any calendar year.
Approximately 89% of units are under management
Senior Housing Operating Portfolio(7) IL, AL, CCRC 229 27,067 agreements post conversion.
(1) Number of communities and units are as of September 30, 2019 and includes four properties classified as held for sale.
(2) Excludes data for periods prior to our ownership of certain properties, as well as properties sold or classified as held for sale, or for which there was a transfer of operations during the periods presented.
(3) All tenant operating data presented is based upon the operating results provided by our tenants for the twelve months ended June 30, 2019 or for the most recent prior period for which tenant and manager operating results are available to us.
(4) Rent coverage is calculated as operating cash flows from our triple net leased tenants’ facility operations of our properties, before subordinated charges, if any, divided by triple net lease minimum rents payable to us. We have not independently
verified tenant operating data. Excludes data for periods prior to our ownership of certain properties, as well as properties sold or classified as held for sale or for which there was a transfer of operations during the periods presented.
(5) Five Star rent coverage for the twelve months ended June 30, 2019 is calculated based on the $132.0 million of annualized rental income, adjusted for properties sold or classified as held for sale, payable to us by Five Star in
accordance with the Transaction Agreement dated April 1, 2019 between us and Five Star. 15
(6) These senior living communities are managed by Five Star for our account and include properties leased to our TRSs. Occupancy for the 12 month period ended or, if shorter, from the date of acquisition through September 30,
2019, was 85.5%.
(7) Excludes free-standing SNFs planned for dispositionPlanned Dispositions Will Prune Portfolio and Delever Balance Sheet
Disposition of non-core assets will improve DHC’s overall portfolio quality and efficiency, while
lowering overall leverage.
Previously announced disposition strategy:
– DHC expects to sell properties valued at up to approximately $900M.
Pruning the portfolio:
– These assets are weighted toward underperforming and non-core properties.
– The proceeds will be used to delever the balance sheet.
– As of 9/30/19, reported Net Debt-to-Adjusted EBITDAre was 7.4x(1)(2) and Net Debt-to-Gross Assets
was 42.4%.(1)(3)
– Longer term target Net Debt-to-Adjusted EBITDAre around 6.0x or lower.
Stage of Dispositions (as of 12/30/19) Amount ($)
Sold or Under Agreement to Sell $678M
Offers From Prospective Buyers $231M
Actively Marketing $38M
(1) Net debt is total debt less cash. Debt amounts represent the principal balance as of the date reported.
(2) See Appendix for the calculation of Adjusted EBITDAre and a reconciliation of net (loss) income determined in accordance with GAAP to that amount. 16
(3) Total gross assets is total assets plus accumulated depreciation.Capital Structure
The strength in our balance sheet provides ability for growth.
Credit Statistics and Debt Overview Debt Maturity Schedule
(as of September 30, 2019) (as of September 30, 2019)
$1,200
($ in thousands)
Total debt(1) $3,688 $1,000
Net debt(1) / gross book value of real estate(2) 42.5% $800
Net debt(1) /annualized adjusted EBITDAre (3) 7.4x $600
Weighted Average Interest Rate(4) 4.62% $400
Adjusted EBITDAre (3) / Interest Expense 2.7x
$200
Annualized Dividend Yield(5) 6.5%
$-
(6)
Secured Debt and Unsecured Floating Unsecured Fixed Secured Fixed
(7)(8)
Capital Leases(7)(8)
12% (1) Debt amounts reflect the principal balance as of the date reported. Net debt is total debt less cash. The principal
Unsecured Senior balances are the amounts actually payable pursuant to contracts. In accordance with GAAP, our carrying values
Notes and recorded interest expense may be different because of market conditions at the time we assumed certain of
31% these debts.
(2) Gross book value of real estate assets is real estate assets at cost plus certain acquisition costs, before
Unsecured Term depreciation and purchase price allocations, less impairment writedowns, if any. Excludes properties classified as
Loans held for sale, if any.
10% (3) See Appendix for the calculation of Adjusted EBITDAre and a reconciliation of net (loss) income determined in
accordance with GAAP to that amount.
(4) Includes the effect of mark to market accounting for certain assumed mortgages and premiums and discounts on
Market Value of certain mortgages and unsecured notes. Excludes effects of offering and transaction costs.
Common Shares (5) Stated amounts reflect the annualized regular quarterly dividend rates per share. Annualized dividend yield is the
37% annualized dividend declared during the applicable period divided by the closing price of DHC's common shares on
Unsecured Revolving The Nasdaq Stock Market LLC at the end of the relevant period.
Credit Facility (6) (6) Includes $589.0M outstanding under our $1B revolving credit facility at September 30, 2019. Upon payment of an
10% extension fee and our meeting certain conditions, we have the option to extend the maturity date by one year.
(7) Includes $9.12M of capital lease obligations due through April 2026.
(8) Includes $620M of mortgages encumbered by two properties that are owned in a joint venture arrangement in
which we own a 55% equity interest. The principal amounts represented in the graph for these debts have not been
adjusted to reflect the equity interests in the joint venture that we do not own.
17Outsized and Well-Covered Dividend Yield
Dividend reset keeps yield near the top of the peer group and in good health from a cash flow
coverage standpoint.
Following entering into the Five Star restructuring transaction, DHC reset its dividend to ensure it is well-covered.
Following the completion of repositioning of the portfolio, there may be further room to grow the dividend at a faster rate
than peers.
At this current level, DHC’s dividend remains one of the highest yielding healthcare REITs in the space.
AFFO(1) Payout Ratio vs. Peers Dividend Yield vs. Peers
110% 10.0%
98%
100%
92% 94% 8.0% 7.6% 7.4%
91% 91% 91%
89%
90%
83% 6.1% 6.0%
81%
77% 6.0%
80% 4.9% 4.9% 4.8%
74%
4.4%
4.1% 4.0% 3.8%
70% 4.0% 3.5%
60% 2.3%
2.0%
50%
40% 0.0%
SNR
MPW
LTC
HTA
SBRA
OHI
VTR
HR
DHC
HCP
UHT
NHI
WELL
LTC
MPW
HTA
SBRA
OHI
HR
VTR
DHC
HCP
NHI
WELL
Source: Nasdaq IR Insight; data is actual as of the most recent quarter Source: Bloomberg; data is actual as of 10/29/2019. DHC dividend reflects the
reported. AFFO estimates reflect 2020E consensus. most recent declared dividend of $0.15 annualized for a full year.
18
(1) AFFO, as presented in the chart, measures consensus AFFO reported by sell-side research companies. We note that the calculation of AFFO may be different
from DHC’s calculation of FFO and Normalized FFO, and may also differ on a peer-to-peer basis.Recent Trade Off Creates Attractive Buying Opportunity
Following the announcement of the Five Star lease restructuring and dividend reset, DHC shares have been trading at
historically disproportionate discounts to peers on both P/FFO and EV/EBITDA.
We believe this outsized discount to peers is unwarranted because the recent transaction offers DHC more stability, a well-
covered dividend, and positions the company for long-term growth.
As of 12/31/2019, P/FFO was trading roughly 4.5x outside of the 5-year average historical discount to peers, or roughly 2
standard deviations under the average discount to peers.
As of 12/31/2019, EV/EBITDA was trading roughly 2.0x outside of the 5-year average historical discount to peers, or
roughly 2 standard deviations under the average discount to peers.
P/FFO Premium/Discount: DHC vs. HC REITs (1) EV/EBITDA Premium/Discount: DHC vs. HC REITs (2)
5.0x 0.0x
0.0x
-3.3x
-3.7x -4.2x
-5.0x -5.0x
-5.3x
-6.2x
-10.0x -9.8x
-15.0x -10.0x
12/31/09
05/31/10
10/31/10
03/31/11
08/31/11
01/31/12
06/30/12
11/30/12
04/30/13
09/30/13
02/28/14
07/31/14
12/31/14
05/31/15
10/31/15
03/31/16
08/31/16
01/31/17
06/30/17
11/30/17
04/30/18
09/30/18
02/28/19
07/31/19
12/31/19
12/31/09
06/30/10
12/31/10
06/30/11
12/31/11
06/30/12
12/31/12
06/30/13
12/31/13
06/30/14
12/31/14
06/30/15
12/31/15
06/30/16
12/31/16
06/30/17
12/31/17
06/30/18
12/31/18
06/30/19
12/31/19
DHC P/FFO Prem/Disc to HC REITs DHC EV/EBITDA Prem/Disc to HC REITs
10Y Avg. P/FFO Prem/Disc to HC REITs 10Y Avg. EV/EBITDA Prem/Disc to HC REITs
5Y Avg. P/FFO Prem/Disc to HC REITs 5Y Avg. EV/EBITDA Prem/Disc to HC REITs
(1) FFO estimates are next 12 month consensus estimates as of the reported date. HC REITs represents an EV-weighted average of all Healthcare REITs, including
DHC, HCP, WELL, HR, HTA, LTC, MPW, NHI, OHI, SBRA, VTR, and SNR. Source: S&P Global, as of 12/31/2019. 19
(2) EBITDA estimates are next 12 month consensus estimates as of the reported date. HC REITs represents an EV-weighted average of all Healthcare REITs, including
DHC, HCP, WELL, HR, HTA, LTC, MPW, NHI, OHI, SBRA, VTR, and SNR. Source: S&P Global as of 12/31/2019.Leveraging a Resource Rich Management Platform
The RMR Group LLC
(1)
RMR’s Operations Include:
Combined RMR
$32.8 Billion in AUM Managed Companies:
Real Estate
Financial Services: Business Services:
Services:
Acquisitions/
Approximately $12 Billion in Accounting Administration
Annual Revenues Dispositions
Capital Markets Asset Management Human Resources
Approximately 600 CRE
Construction/ Information
Professionals Compliance/ Audit
Over 2,200 Development Technology (IT)
Properties Finance/ Planning Engineering Investor Relations
Treasury Leasing Marketing
Property Legal/
Tax
More than 30 Offices Nearly Management Risk Management
Throughout the U.S. 50,000 Employees
Office Industrial Government Medical Office Life Sciences Senior Living Hotels Retail
20
(1) As of 9/30/2019DHC Benefits From Relationship With RMR
RMR Provides DHC with scale and efficiencies
– DHC has no employees; RMR provides all employees.
– RMR’s acquisitions team sees a substantial number of properties marketed for sale in every market across the United States.
– RMR attracts very strong real estate professionals (acquisitions, asset management, property management, finance, accounting, etc.)
because of the size of the portfolios for which they will be responsible.
– RMR provides job growth opportunities for employees which is a benefit when hiring in a tight job market.
– RMR property management employees focus only on assets managed by RMR, with no conflicting responsibilities for other owners.
– DHC benefits from the scale of a $32.8 billion platform(1). Examples:
– Centralized procurement.
– Centralized services.
– Banking and capital markets.
DHC’s G&A as a percent of total revenues compares favorably to its peer group(2):
25% 23.3%
19.1%
20%
15% 12.3%
9.9% 10.0% 10.3%
10% 8.1%
6.1% 6.7%
4.8% 5.6% 5.7%
3.9% 4.1% 4.3% 4.7%
5% 2.4%
0%
WELL NHI VTR HCP SNR DHC HTA SBRA OHI HR DOC LTC CTRE MPW CHCT GMRE GBCS
(1) As of 9/30/19. 21
(2) Source: S&P Global Market Intelligence and company filings. Data is as of the most recent reported quarter.Management Agreement Exhibits Alignment of Interests
RMR base management fee tied to DHC share price performance Alignment of Interests
Consists of an annual fee based on 50 bps of the lower of: (1) DHC’s historical
cost of real estate, or (2) DHC’s total market capitalization. If DHC’s total market cap exceeds historical cost
of real estate, base fee is paid on assets.
– In September 2019, the run rate of lost revenues for RMR increased to
$14.1 million dollars per year as DHC’s shares traded lower.
If DHC’s total market cap is less than historical
There is no incentive for RMR to complete any transaction that could reduce cost of real estate, base fee fluctuates with share
share price. price.
RMR incentive fees contingent on total shareholder return
outperformance Incentive fee structure keeps RMR focused on
increasing total shareholder return.
Equal to 12% of value generated by DHC in excess of the benchmark index total
returns (SNL US Healthcare REIT Index) per share over a three year period,
Members of RMR senior management are
subject to a cap (1.5% of equity market cap).
holders of DHC stock, some subject to long term
Outperformance must be positive: it can’t be the best of the worst. lock up agreements.
Shareholders keep 100% of benchmark returns and at least 88% of returns in
DHC shareholders have visibility into publicly
excess of the benchmark.
traded RMR.
Other fees
Property management fee: consists of an annual fee based on 3.0% of rents
DHC benefits from RMR’s national footprint and
collected at DHC’s medical office and life science properties. economies of scale of $32.8(1) billion platform.
Construction management fee based on 5.0% of project costs
22
(1) Data as of September 30, 2019.No Expected 2020 Incentive Management Fee
As of 12/31/19, DHC has a total return cushion of roughly 75% relative to the peer group before
incurring an incentive fee for 2020.
The annual incentive fee is equal to twelve percent (12%) of the product of the Equity Market Capitalization and the amount
by which the Total Return per share exceeds the Benchmark Return per share for DHC. For example, the calculation of the
2020 annual incentive fee (to be paid in 1Q21) for DHC is below:
Measurement Period:
Begin Date 1/1/2018
Incentive Calculation, as of Date: 12/31/2019
End Date 12/31/2020
Total return in excess of benchmark return calculation:
Weighted share price at beginning of measurement period $19.15
Final share price at end of measurement period (as defined) (2) 7.93
Change (11.22)
Weighted dividends declared during the measurement period 2.40
Total return per share $(8.82)
Weighted total return % -46.05%
Weighted SNL U.S. Healthcare REIT Index total return % (benchmark) 29.29%
Total return % relative to benchmark return % -75.34%
(1) Weighted amounts are adjusted for additional common shares issued during the Measurement Period. 23
(2) The average closing price for the 10 consecutive trading days having the highest average closing prices during the final 30 trading days of the Measurement Period.APPENDIX
24Financial Summary (1)
For the Three Months
Ended September 30,
($ in 000's, except per share data) 2019 2018
Rental Income $148,011 $173,648
Residents fees and services (managed properties) 107,816 105,321
Total revenues $255,827 $278,969
Net (loss) income (27,946) 47,202
Net (loss) income attributable to common shareholders (29,390) 45,805
Property NOI(2) $130,744 $162,982
NOI margin % 51.1% 58.4%
Adjusted EBITDAre(3) $121,994 $153,134
Normalized FFO attributable to common shareholders(4) $70,069 $100,248
Per share data:
Common dividend $0.15 $0.39
Normalized FFO(4) $0.29 $0.42
Normalize FFO attributable to common shareholders payout ratio(4) 51.7% 92.9%
(1) See Definitions of Certain Non-GAAP Financial Measures on page 30, a description of why we believe they are appropriate supplemental measures and a description of how we use
these measures.
(2) See page 26 for the calculation of NOI and Cash Basis NOI and a reconciliation of net (loss) income determined in accordance with GAAP to these amounts.
(3) See page 27 for the calculation of EBITDA, EBITDAre and Adjusted EBITDAre and a reconciliation of net (loss) income determined in accordance with GAAP to these amounts.
(4) See page 28 for the calculation of Normalized FFO attributable to common shareholders and a reconciliation of net (loss) income attributable to common shareholders determined in
25
accordance with GAAP to these amounts.Calculation and Reconciliation of Net Operating
Income (NOI) and Cash Basis NOI (1)
For the Three Months Ended For the Nine Months Ended
($ in 000’s) 9/30/2019 6/30/2019 3/31/2019 12/31/2018 9/30/2018 9/30/2019 9/30/2018
Calculation of NOI and Cash Basis NOI:
Revenues:
Rental income $ 148,011 $ 153,097 $ 158,241 $ 178,680 $ 173,648 $ 459,349 $ 521,961
Residents fees and services 107,816 108,906 108,045 106,542 105,321 324,767 309,981
Total revenues 255,827 262,003 266,286 285,222 278,969 784,116 831,942
Property operating expenses (125,083) (120,193) (117,222) (117,440) (115,987) (362,498) (334,141)
Property NOI 130,744 141,810 149,064 167,782 162,982 421,618 497,801
Non-cash straight line rent adjustments (1,186) (430) (1,934) (1,720) (2,484) (3,550) (8,507)
Lease value amortization (1,842) (1,555) (1,525) (1,497) (1,493) (4,922) (4,290)
Non-cash amortization included in property operating expenses (2) (199) (199) (199) (200) (199) (597) (597)
Cash Basis NOI $ 127,517 $ 139,626 $ 145,406 $ 164,365 $ 158,806 $ 412,549 $ 484,407
Reconciliation of Net (Loss) Income to NOI and Cash Basis
NOI:
Net (loss) income $ (27,946) $ (35,816) $ 31,504 $ (117,182) $ 47,202 $ (32,258) $ 409,596
Equity in (earnings) losses of an investee (83) (130) (404) 366 (831) (617) (882)
Income tax (benefit) expense (146) (35) 134 32 79 (47) 444
Loss (gain) on early extinguishment of debt — 17 — — (108) 17 22
Interest expense 44,817 46,412 45,611 45,506 45,416 136,840 133,781
Interest and other income (238) (238) (114) (305) (248) (590) (362)
(Gains) losses on equity investments, net (40) 64,448 (22,932) 106,367 (35,137) 41,476 (85,643)
Dividend income — (923) (923) (923) (660) (1,846) (1,978)
(Gain) loss on sale of properties (4,183) (17,832) 122 — — (21,893) (261,916)
Impairment of assets 33,099 2,213 6,206 61,273 4,525 41,518 5,073
Acquisition and certain other transaction related costs 2,492 903 7,814 56 51 11,209 138
General and administrative 9,604 8,867 9,816 657 31,032 28,287 85,228
Depreciation and amortization 73,368 73,924 72,230 71,935 71,661 219,522 214,300
Property NOI 130,744 141,810 149,064 167,782 162,982 421,618 497,801
Non-cash amortization included in property operating expenses (2) (199) (199) (199) (200) (199) (597) (597)
Lease value amortization (1,842) (1,555) (1,525) (1,497) (1,493) (4,922) (4,290)
Non-cash straight line rent adjustments (1,186) (430) (1,934) (1,720) (2,484) (3,550) (8,507)
Cash Basis NOI $ 127,517 $ 139,626 $ 145,406 $ 164,365 $ 158,806 $ 412,549 $ 484,407
(1) See Definitions of Certain Non-GAAP Financial Measures on page 30 for a definition of NOI, Cash Basis NOI, same property NOI and same property Cash Basis NOI, a
description of why we believe they are appropriate supplemental measures and a description of how we use these measures.
(2) We recorded a liability for the amount by which the estimated fair value for accounting purposes exceeded the price we paid for our investment in shares of RMR Inc. class A 26
common stock in June 2015. A portion of this liability is being amortized on a straight line basis through December 31, 2035 as a reduction to property management fees
expense, which is included in property operating expenses.Calculation and Reconciliation of EBITDA,
EBITDAre, and Adjusted EBITDAre (1)
For the Three Months Ended For the Nine Months Ended
9/30/2019 6/30/2019 3/31/2019 12/31/2018 9/30/2018 9/30/2019 9/30/2018
($ in 000s)
Net (loss) income $ (27,946) $ (35,816) $ 31,504 $ (117,182) $ 47,202 $ (32,258) $ 409,596
Interest expense 44,817 46,412 45,611 45,506 45,416 136,840 133,781
Income tax (benefit) expense (146) (35) 134 32 79 (47) 444
Depreciation and amortization 73,368 73,924 72,230 71,935 71,661 219,522 214,300
EBITDA 90,093 84,485 149,479 291 164,358 324,057 758,121
(Gain) loss on sale of properties (4,183) (17,832) 122 — — (21,893) (261,916)
Impairment of assets 33,099 2,213 6,206 61,273 4,525 41,518 5,073
EBITDAre 119,009 68,866 155,807 61,564 168,883 343,682 501,278
General and administrative expense paid in common shares (2) 533 392 215 556 694 1,140 1,668
Estimated business management incentive fees (3) — — — (50,708) 18,751 — 50,708
Acquisition and certain other transaction related costs 2,492 903 7,814 56 51 11,209 138
Loss (gain) on early extinguishment of debt — 17 — — (108) 17 22
(Gains) losses on equity securities, net (4) (40) 64,448 (22,932) 106,367 (35,137) 41,476 (85,643)
Adjusted EBITDAre $ 121,994 $ 134,626 $ 140,904 $ 117,835 $ 153,134 $ 397,524 $ 468,171
(1) See Definitions of Certain Non-GAAP Financial Measures on page 30 for a definition of EBITDA, EBITDAre and Adjusted EBITDAre and a description of why we believe
they are appropriate supplemental measures.
(2) Amounts represent equity compensation awarded to our trustees, officers and certain other employees of RMR LLC.
(3) Incentive fees under our business management agreement with RMR LLC are payable after the end of each calendar year, are calculated based on common share total
return, as defined, and are included in general and administrative expense in our condensed consolidated statements of income (loss). In calculating net (loss) income in
accordance with GAAP, we recognize estimated business management incentive fee expense, if any, in the first, second and third quarters. Although we recognize this
expense, if any, in the first, second and third quarters for purposes of calculating net (loss) income, we do not include these amounts in the calculation of Adjusted
EBITDAre until the fourth quarter, when the amount of the business management incentive fee expense for the calendar year, if any, is determined. Adjusted EBITDAre
includes business management incentive fee expense of $40,642 for the three months ended December 31, 2018.
(4) (Gains) losses on equity securities, net, represent the adjustment required to adjust the carrying value of our investment in Five Star common stock and our former 27
investment in RMR Inc. common stock to their fair value as of the end of the period. On July 1, 2019, we sold our investment in RMR Inc. common stock.Calculation and Reconciliation of Funds From
Operations (FFO) and Normalized FFO
Attributable to Common Shareholders (1)
For the Three Months Ended For the Nine Months Ended
($ in 000’s, except per share data) 9/30/2019 6/30/2019 3/31/2019 12/31/2018 9/30/2018 9/30/2019 9/30/2018
Net (loss) income attributable to common shareholders $ (29,390) $ (37,229) $ 30,082 $ (118,543) $ 45,805 $ (36,537) $ 405,415
Depreciation and amortization 73,368 73,924 72,230 71,935 71,661 219,522 214,300
FFO attributable to noncontrolling interest (5,277) (5,297) (5,297) (5,300) (5,300) (15,871) (15,900)
(Gain) loss on sale of properties (4,183) (17,832) 122 — — (21,893) (261,916)
Impairment of assets 33,099 2,213 6,206 61,273 4,525 41,518 5,073
(Gains) losses on equity securities, net (2) (40) 64,448 (22,932) 106,367 (35,137) 41,476 (85,643)
FFO attributable to common shareholders 67,577 80,227 80,411 115,732 81,554 228,215 261,329
Estimated business management incentive fees (3) — — — (50,708) 18,751 — 50,708
Acquisition and certain other transaction related costs 2,492 903 7,814 56 51 11,209 138
Loss (gain) on early extinguishment of debt — 17 — — (108) 17 22
Normalized FFO attributable to common shareholders $ 70,069 $ 81,147 $ 88,225 $ 65,080 $ 100,248 $ 239,441 $ 312,197
Weighted average common shares outstanding (basic) 237,608 237,580 237,568 237,568 237,511 237,585 237,492
Weighted average common shares outstanding (diluted) 237,608 237,580 237,600 237,573 237,562 237,585 237,526
Per Common Share Data (basic and diluted):
Net (loss) income attributable to common shareholders $ (0.12) $ (0.16) $ 0.13 $ (0.50) $ 0.19 $ (0.15) $ 1.71
FFO attributable to common shareholders $ 0.28 $ 0.34 $ 0.34 $ 0.49 $ 0.34 $ 0.96 $ 1.10
Normalized FFO attributable to common shareholders $ 0.29 $ 0.34 $ 0.37 $ 0.27 $ 0.42 $ 1.01 $ 1.31
(1) See Definitions of Certain Non-GAAP Financial Measures on page 30 for a definition of FFO attributable to common shareholders and Normalized FFO attributable to
common shareholders, a description of why we believe they are appropriate supplemental measures and a description of how we use these measures.
(2) (Gains) losses on equity securities, net, represent the adjustment required to adjust the carrying value of our investment in Five Star common stock and our former
investment in RMR Inc. common stock to their fair value as of the end of the period. On July 1, 2019, we sold our entire investment in RMR Inc. common stock.
(3) Incentive fees under our business management agreement with RMR LLC are payable after the end of each calendar year, are calculated based on common share
total return, as defined, and are included in general and administrative expense in our condensed consolidated statements of income (loss). In calculating net (loss)
income attributable to common shareholders in accordance with GAAP, we recognize estimated business management incentive fee expense, if any, in the first,
second and third quarters. Although we recognize this expense, if any, in the first, second and third quarters for purposes of calculating (loss) attributable to common
shareholders, we do not include these amounts in the calculation of Normalized FFO attributable to common shareholders until the fourth quarter, when the amount
of business management incentive fee expense for net (loss) income the calendar year, if any, is determined. Normalized FFO attributable to common shareholders 28
includes business management incentive fee expense of $40,642 for the three months ended December 31, 2018.How to Calculate Incentive Management Fees
The annual incentive fee is equal to twelve percent (12%) of the product of the Equity Market Capitalization and the amount by which the Total
Return per share exceeds the Benchmark Return per share for DHC. For example, the calculation of the 2018 annual incentive fee for DHC is
below (amounts in 000’s, except share data):
Measurement Period:
Begin Date 1/1/2016
Incentive Calculation, as of Date: 12/31/2018
End Date 12/31/2018
Incentive fee calculation:
Weighted shares outstanding(1) 237,578,832
Weighted share price at beginning of measurement period $14.84
Equity Market Capitalization $3,526,239,087
Total return % in excess of benchmark return % or adjusted benchmark return % 9.60%
Product $338,680,561
Contractual percentage 12%
Incentive fee calculation $40,641,667
Total return in excess of benchmark return calculation:
Weighted share price at beginning of measurement period(1) $14.84
Final share price at end of measurement period (as defined) (2) 13.65
Change (1.19)
Weighted dividends declared during the measurement period 4.68
Total return per share $3.49
Weighted total return % 23.50%
Weighted SNL U.S. Healthcare REIT Index total return % (benchmark) 13.89%
Total return % in excess of benchmark return % 9.60%
Maximum incentive fee calculation:
Total shares at end of measurement period 237,729,900
Percentage 1.50%
Subtotal 3,565,949
Final share price at end of measurement period (as defined) $13.65
Incentive Fee cap $48,675,197
Incentive fee payable (lessor of calculated amount or maximum fee) $ 40,641,667
(1) Weighted amounts are adjusted for additional common shares issued during the Measurement Period.
(2) The average closing price for the 10 consecutive trading days having the highest average closing prices during the final 30 trading days of the Measurement Period.
29Definitions of Certain Non-GAAP Financial Measures
Non-GAAP Financial Measures
We present certain "non-GAAP financial measures" within the meaning of applicable Securities and Exchange Commission, or SEC, rules, including net operating income, or NOI, Cash Basis NOI, same
property NOI, same property Cash Basis NOI, earnings before interest, income tax, depreciation and amortization, or EBITDA, EBITDA for real estate, or EBITDAre, Adjusted EBITDAre, funds from operations
attributable to common shareholders, or FFO attributable to common shareholders, normalized funds from operations attributable to common shareholders, or Normalized FFO attributable to common
shareholders. These measures do not represent cash generated by operating activities in accordance with GAAP and should not be considered alternatives to net (loss) income or net (loss) income attributable
to common shareholders as indicators of our operating performance or as measures of our liquidity. These measures should be considered in conjunction with net (loss) income and net (loss) loss attributable to
common shareholders as presented in our condensed consolidated statements of income (loss). We consider these non-GAAP measures to be appropriate supplemental measures of operating performance for
a REIT, along with net (loss) income and net (loss) income attributable to common shareholders. We believe these measures provide useful information to investors because by excluding the effects of certain
historical amounts, such as depreciation and amortization, they may facilitate a comparison of our operating performance between periods and with other REITs and, in the case of NOI, Cash Basis NOI, same
property NOI and same property Cash Basis NOI, reflecting only those income and expense items that are generated and incurred at the property level may help both investors and management to understand
the operations at our properties.
NOI and Cash Basis NOI
The calculations of NOI and Cash Basis NOI exclude certain components of net (loss) income in order to provide results that are more closely related to our property level results of operations. We calculate NOI
and Cash Basis NOI as shown on page 26. We define NOI as income from our real estate less our property operating expenses. NOI excludes amortization of capitalized tenant improvement costs and leasing
commissions that we record as depreciation and amortization. We define Cash Basis NOI as NOI excluding non-cash straight line rent adjustments, lease value amortization, lease termination fee amortization, if
any, and non-cash amortization included in property operating expenses. We use NOI and Cash Basis NOI to evaluate individual and company wide property level performance. Other real estate companies and
REITs may calculate NOI and Cash Basis NOI differently than we do.
EBITDA, EBITDAre and Adjusted EBITDAre
We calculate EBITDA, EBITDAre and Adjusted EBITDAre as shown on page 27. EBITDAre is calculated on the basis defined by the National Association of Real Estate Investment Trusts, or Nareit, which is
EBITDA, excluding gains and losses on the sale of real estate, loss on impairment of real estate assets, if any, as well as certain other adjustments currently not applicable to us. In calculating Adjusted
EBITDAre, we adjust for the items shown on page 27 and include business management incentive fees, if any, only in the fourth quarter versus the quarter when they are recognized as expense in accordance
with GAAP due to their quarterly volatility not necessarily being indicative of our core operating performance and the uncertainty as to whether any such business management incentive fees will be payable
when all contingencies for determining such fees are known at the end of the calendar year. Other real estate companies and REITs may calculate EBITDA, EBITDAre and Adjusted EBITDAre differently than we
do.
FFO and Normalized FFO Attributable to Common Shareholders
We calculate FFO attributable to common shareholders and Normalized FFO attributable to common shareholders as shown on page 28. FFO attributable to common shareholders is calculated on the basis
defined by Nareit, which is net (loss) income attributable to common shareholders, calculated in accordance with GAAP, excluding any gain or loss on sale of properties, loss on impairment of real estate assets
and gains or losses on equity securities, net, if any, plus real estate depreciation and amortization and minus FFO attributable to noncontrolling interest, as well as certain other adjustments currently not
applicable to us. In calculating Normalized FFO attributable to common shareholders, we adjust for the items shown on page 28 and include business management incentive fees, if any, only in the fourth quarter
versus the quarter when they are recognized as expense in accordance with GAAP due to their quarterly volatility not necessarily being indicative of our core operating performance and the uncertainty as to
whether any such business management incentive fees will be payable when all contingencies for determining such fees are known at the end of the calendar year. FFO attributable to common shareholders and
Normalized FFO attributable to common shareholders are among the factors considered by our Board of Trustees when determining the amount of distributions to our shareholders. Other factors include, but are
not limited to, requirements to maintain our qualification for taxation as a REIT, limitations in our revolving credit facility and term loan agreements and our public debt covenants, the availability to us of debt and
equity capital, our expectation of our future capital requirements and operating performance, and our expected needs for and availability of cash to pay our obligations. Other real estate companies and REITs
may calculate FFO attributable to common shareholders and Normalized FFO attributable to common shareholders differently than we do.
30You can also read