Kiwi Property 2021 half-year results presentation

Page created by Kent Elliott
 
CONTINUE READING
Kiwi Property 2021 half-year results presentation
Kiwi
Kiwi Property
     Property
2021
 2021half-year
      half-yearresults
                resultspresentation
                        presentation
Kiwi Property 2021 half-year results presentation
Disclaimer

Kiwi Property Group Limited has prepared this document. By accepting this document and to the maximum extent permitted by law, you acknowledge and agree to the following matters.
No liability
Kiwi Property Group Limited, its advisers, affiliates, related bodies corporate, directors, officers, partners, employees and agents (together ‘Kiwi Property’) expressly exclude and disclaim any and all liability which may arise from this
document, any information provided in connection with this document, any errors in or omissions from this document, from relying on or using this document or otherwise in connection with this document.
No representation
Kiwi Property makes no representation or warranty, express or implied, as to the accuracy, completeness, reliability or sufficiency of the information in this document or the reasonableness of the assumptions in this document. All
images (including any dimensions) are for illustrative purposes only and are subject to change at any time and from time to time without notice.
Not advice
This document does not constitute advice of any kind whatsoever (including but without limitation investment, financial, tax, accounting or legal advice) and must not be relied upon as such. This document is intended to provide
general information only and does not take into account your objectives, situation or needs. You should assess whether the information in this document is appropriate for you and consider talking to a professional adviser or
consultant.
Not an offer
This document is for information purposes only and is not an invitation or offer of financial products for subscription, purchase or sale in any jurisdiction. This document is not a prospectus or product disclosure statement or other
offering document under New Zealand law or any other law. This document does not constitute an offer to sell, or a solicitation of an offer to buy, any securities in the United States and will not be lodged with the U.S Securities
Exchange Commission.
Past performance
Past performance information given in this document is given for illustrative purposes only and should not be relied upon as (and is not) an indication or guarantee of future performance.
Future performance
This document contains certain "forward-looking statements" such as indications of, and guidance on, future earnings and financial position and performance. Forward-looking statements can generally be identified by the use of
forward-looking words such as, 'expect', 'anticipate', 'likely', 'intend', 'could', 'may', 'predict', 'plan', 'propose', 'will', 'believe', 'forecast', 'estimate', 'target', 'outlook', 'guidance' and other similar expressions. The forward-looking
statements contained in this document are not guarantees or predictions of future performance and involve known and unknown risks and uncertainties and other factors, many of which are beyond the control of Kiwi Property,
and may involve significant elements of subjective judgement and assumptions as to future events which may or may not be correct. There is no assurance or guarantee that actual outcomes will not materially differ from these
forward-looking statements. A number of important factors could cause actual results or performance to differ materially from the forward-looking statements. Investors should consider the forward-looking statements contained in
this document in light of this information. The forward-looking statements are based on information available to Kiwi Property as at the date of this document.
Investment risk
An investment in the financial products of Kiwi Property Group Limited is subject to investment and other known and unknown risks, some of which are beyond the control of Kiwi Property Group Limited. Kiwi Property Group Limited
does not guarantee its performance or the performance of any of its financial products unless and to the extent explicitly stated in a prospectus or product disclosure statement or other offering document.
No duty to update
Statements made in this document are made only as the date of this document unless another date is specified. Except as required by law or regulation (including the NZX Listing Rules), Kiwi Property undertakes no obligation to
provide any additional or updated information or revise or reaffirm the information in this document whether as a result of new information, future events, results or otherwise. Kiwi Property Group Limited reserves the right to change
any or all of the information in this document at any time and from time to time without notice.
Caution regarding sales information
Any sales information included in this document has been obtained from third parties or, where such information has not been provided by third parties, estimated by Kiwi Property based on information available to it. The sales
information has not been independently verified. The sales information included in this document will not be complete where third parties have not provided complete sales information and Kiwi Property has not estimated sales
information. You are cautioned that this document should not be relied upon as a representation, warranty or undertaking in relation to the currency, accuracy, reliability or completeness of the sales information contained in this
document.
Copyright
The copyright of this document and the information contained in it is vested in Kiwi Property Group Limited. This document should not be copied, reproduced or redistributed without the prior written consent of Kiwi Property Group
Limited.
Real Estate Agents Act 2008
Kiwi Property Group Limited is licensed under the Real Estate Agents Act 2008.

                                                                                                                                                                                                                                                         2
Kiwi Property 2021 half-year results presentation
Contents

                                                                                                                                             Page
Business update                                                                                                                               4
Half-year result                                                                                                                              13
Appendix 1: Property update                                                                                                                   21
Appendix 2: Financial update                                                                                                                  40
Glossary                                                                                                                                      56

This half-year result presentation, for the six months ended 30 September 2020, should be read in conjunction with the NZX announcement
and financial statements also released on 23 November 2020. Refer to our website kp.co.nz/half-year-result or nzx.com. Property statistics
within this presentation represent owned assets only; property interests managed on behalf of third parties are excluded. Unless otherwise
indicated, all of the numerical data provided in this presentation is stated for the six months ended and/or as at 30 September 2020. All
amounts are in New Zealand dollars. Due to rounding, numbers within this presentation may not add up precisely to the totals provided
and percentages may not precisely reflect the absolute figures. Refer to the Glossary for further definitions. The non-GAAP financial
information does not have a standardised meaning prescribed by GAAP and therefore may not be comparable to similar financial
information presented by other entities. The GAAP financial information has been subject to review.
Kiwi Property 2021 half-year results presentation
Business update
Kiwi Property 2021 half-year results presentation
2021 half-year result highlights

 $55.2m                                       $11.8m               $54.2m                   57              2.20cps
  Operating profit                            Property portfolio      Net profit        New stores at             2021
     before tax                                fair value gain1        after tax      Sylvia Park Level 1   interim dividend
   -$5.0m (-8.4%)                            $1.29 NTA per share   +$17.5m (+47.5%)

1. Includes gross up of lease liabilities.

                                                                                                                               5
Kiwi Property 2021 half-year results presentation
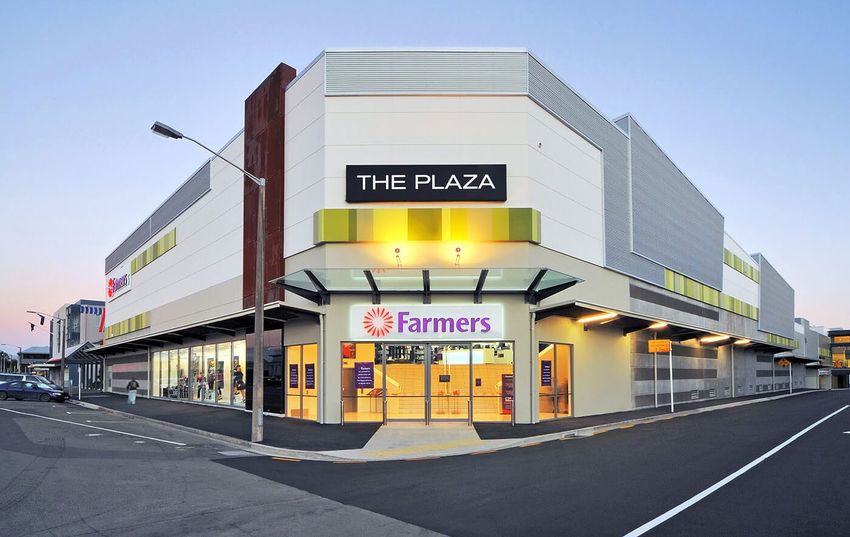
A strategic response to COVID-19

                                                     Grow

                                               Diversify

                                   Stabilise

                                                            6
Kiwi Property 2021 half-year results presentation
Navigating COVID-19

>   Kiwi Property took a number of steps to help mitigate the significant impact of
    COVID-19 on the Company:
    – 20% temporary pay reductions taken by the board and executive.
    – Board made the difficult decision not to pay a full-year dividend.
    – Non-essential projects and operating expenditure suspended.
    – Received $1.0m wage subsidy, enabling all team members to be retained.
    – Worked with tenants to share a fair proportion of the COVID-19 impact.

>   1H abatements have impacted AFFO by ~$17m. The expected full-year cost
    remains within the $20m ($14m after tax equivalent) provision previously
    advised.

>   Pre-tax income impact of the rent relief package was $8.1m in 1H with the
    balance to be spread over the remainder of the lease terms in future periods.

>   Rent relief costs will be partially offset by the reintroduction of depreciation
    allowances for building structures, worth ~$4.5m (after tax) in FY21.

                                                                                       7
Kiwi Property 2021 half-year results presentation
Resilience through COVID-19

                                     Investment portfolio                                                                                                    Top 20 tenants
                                      % of gross income                                                                                                     % of gross income

                                      Essential services1                  38%                                                                           Essential services1    68%
                                      Everyday essentials2                 12%                                                                           Everyday essentials2   15%
                                      Discretionary                        50%                                                                           Discretionary          18%

1. Essential services include supermarkets, pharmacies, medical services, banks, insurance, legal, government, telco and financial services. 2. Everyday essentials include
electronics, hardware, consultancy, department stores and discount department stores, hairdressers and opticians. All other categories are considered discretionary.
                                                                                                                                                                                      8
Kiwi Property 2021 half-year results presentation
Launching Sylvia Park Level 1

                            >     The $277m, 20,000 square metre Sylvia Park Level 1 development
                                  opened on 15 October, featuring 57 stores and ‘The Terrace at
                                  Sylvia Park’ dining district.

                            >     Successful launch highlights Sylvia Park’s resilience and standing as
                                  New Zealand’s favourite shopping centre1.

                            >     Level 1 features an over 8,000 square metre Farmers flagship store
                                  and two-level Sephora, Mecca and H&M flagship stores. WALE is 7.8
                                  years.

                            >     Sylvia Park now features 10 of New Zealand’s 11 favourite retailers2,
                                  more than 250 stores and over 5,000 free carparks, the most of any
                                  shopping centre in the country.

                                1. The Heart of Kiwi Property survey, July 2019, Nielsen. 2. NZ’s top retailers survey, September 2020, Colmar Brunton

                                                                                                                                                         9
Kiwi Property 2021 half-year results presentation
Moving forward on strategy

Office optionality at Sylvia Park      Reducing retail exposure                Residential under design
> Tower 2 design is ongoing and        > The Plaza (Palmerston North) sale     > First build-to-rent concept design
  resource consent now granted.          process initiated in October.           progressing.
> Tower 3 design also underway,        > Next stage of strategy to diversify   > Over 50% of Aucklanders now rent
  targeting medical office. Provides     portfolio and decrease retail           highlighting scale of opportunity,
  development optionality.               exposure.                               likely to be amplified by COVID-19.
> Construction to begin in line with   > Recycled capital will help fund       > Resource consent submitted.
  market conditions. No major            extensive mixed-use development
  capex currently committed.             pipeline.
                                                                                                                       10
Embedding ESG

>   Kiwi Property has always put significant focus on ESG issues.
    We are building on this foundation, following the launch of
    the environmental, social and governance (ESG) board
    committee in April 2020.

>   New ESG strategy ratified, with the aim of establishing Kiwi
    Property as a leader in the space and empowering others to
    make positive change.

>   Stakeholder research underway to help identify signature
    initiatives that will form the basis of the company’s ESG
    efforts.

>   Emphasis on broadening Kiwi Property’s current focus from
    environmental to social and community initiatives.

>   Comprehensive update to be provided to the market in
    2021, including the launch of a new ESG report, to be
    published annually.

                                                                    11
Interim dividend and guidance

>    Following a relative stabilisation of trading
     conditions, an interim dividend will be paid for
     the period ended 30 September 2020.

>    The payout of 2.20 cents per share has been set
     at 95% of AFFO, in line with the new dividend
     policy.

>    In addition, the company has provided full-year
     AFFO guidance of 4.90 to 5.15 cents per share1.

1. Subject to final FY21 financial results and barring material adverse effects or unforeseen circumstances.

                                                                                                               12
Half-year result
Half-year result

                                       $84.9m                                                                              > Net rental income (NRI) increased across the office
                                                                                                                             portfolio (+2.5%), but decreased for mixed-use
                                                                                                                             (-9.8%) and retail (-16.2%), driven by COVID-19
                                   Net rental income1                                                                        related rent abatements. Total COVID-19 impact
                                                                                                                             on NRI in the period was -$9.7m.
                                        -$4.7m (-5.3%)
                                                                                                                           > Adjusted Funds from Operations (AFFO), a key
                                       $36.5m                                                                                performance metric used to determine dividends,
                                                                                                                             reduced 21.1% to $36.5m.

                                                 AFFO                                                                      > AFFO was affected by the cash impact of
                                                                                                                             COVID-19 rent relief, partially offset by lower
                                       -$9.8m (-21.1%)                                                                       interest expense (excluding IFRS-16) following the
                                                                                                                             November 2019 equity raise, and tax depreciation
                                                                                                                             on buildings.
            $55.2m                                            $54.2m                                                       > Net profit after tax includes an $11.8m fair value
                                                                                                                             gain on Kiwi Property’s asset portfolio (no interim
            Operating profit                                    Net profit                                                   revaluation was undertaken in FY20).
               before tax                                        after tax
             -$5.0m (-8.4%)                                  +$17.5m (+47.5%)

General note: Comparative figures in slides 14-19 relate to the 1H 2020 period, unless otherwise stated. Net rental income
benefit in 1H 2021 of $1.2m due to reclassification of ground lease expenses under new NZ IFRS 16: Leases accounting standard.
                                                                                                                                                                                   14
Rental growth

                1.5%
                                      Rental growth
                                      > Overall rental growth was 1.5% driven by rent
                                        reviews (+3.0%) partially offset by reversions on new
            Total rental growth         leasing (-10.0%) in the wake of COVID-19.

                FY20: 4.0%            > Positive spreads recorded in the office portfolio
                                        (+2.0%), led by new leases at Vero Centre.

              99.1%                   > Mixed-use and retail leasing spreads declined 9.1%
                                        and 22.5% respectively, driven by a short-term deal
                                        with a retail chain currently in receivership.
               Occupancy
                                        • This agreement had a disproportionate impact
               FY20: 99.5%                 on the new lease metric, given the reduced
                                           number of deals conducted during the period,
                                           but enables the tenancies to remain full while

              4.7years                     being repurposed.

                                      Occupancy and WALE
      Weighted average lease expiry   > 61 new leases or renewals with a WALE of 4.2 years
                                        were completed in the period.
             FY20: 4.9 years

                                                                                                15
Retail sales

 For the twelve months
                                                    All centres                               Shopping centres                         > Retail sales for the year ended 30 September 2020
                                            (incl. large format centres)                  (excl. large format centres)
 ended 30-Sep-201,2                                                                                                                      have been heavily impacted by COVID-19
                                        Actual sales         Adjusted sales3          Actual sales          Adjusted sales3
                                                                                                                                         lockdowns and trading restrictions.
                                          $1.80                   $2.02                  $1.57                  $1.75
 Total sales (billion)                                                                                                                 > Total MAT is 9.1% down on the previous period.
                                      (Feb-20: $2.01)        (Feb-20: $2.01)         (Feb-20: $1.80)        (Feb-20: $1.80)

                                          -9.1%                  +1.8%                  -12.2%                  -1.7%                  > To present a more comparable position, sales have
 Total sales growth
                                      (Feb-20: +2.8%)        (Feb-20: +2.8%)        (Feb-20: +2.5%)         (Feb-20: +2.5%)              been adjusted for actual days traded to try and
                                                                                                                                         eliminate some of the lockdown impact.
 Like-for-like sales                      -9.5%                  +0.9%                  -10.3%                  +0.0%
 growth                               (Feb-20: +1.6%)        (Feb-20: +1.6%)        (Feb-20: +1.4%)         (Feb-20: +1.4%)            > Figures shown do not include adjustments for
                                                                                                                                         reduced trade due to social distancing and other
 Specialty sales                                                                       $10,900                $12,800                    COVID-19 related restrictions.
 (per sqm)                                                                         (Feb-20: $13,200)       (Feb-20: $13,200)
                                                                                                                                       > Encouragingly, adjusted sales are largely in line
 Specialty GOC                                                                           12.7%                                           with totals for the year ended February 2020,
                                                                                     (Feb-20: 10.5%)                                     suggesting trade has held up well despite strict
                                                                                                                                         limitations on how certain retailers could operate.
 Pedestrian count                                                                         39.2
 (million)1                                                                           (Feb-20: 45.3)

 1: Due to COVID-19, we were unable to collect sales data for the month of Mar-20 and therefore comparable data is for the year ended
 29-Feb-20. 2: In FY20 we changed the basis of our sales reporting to align with the Australian Council of Shopping Centres guidelines and
 methodology adopted by our peers. Under these guidelines sales are now reported inclusive of GST. 3: For April 2020, where all but
 essential services were at Alert Level 4 lockdown, monthly sales were estimated based on the tenant’s April 2019 monthly sales adjusted
 for the average difference in the prior six months trade over the corresponding month a year earlier. For May, August and September 2020
 (Auckland only), actual sales recorded were adjusted pro-rata for the number of days traded. June, July and September 2020 (out of
 Auckland only), were not impacted by lockdown therefore recorded sales for the month are unadjusted.                                                                                          16
Capital management

                 4.29%
                                                   > $361m of bank debt facilities were refinanced and
                                                     effective from 1 April 2020.

             Weighted average                      > KPG010 $125m bond matures in August 2021,
               cost of debt                          covered by $268m of undrawn bank debt facilities.

                  FY20: 4.35%

              3.4 years
              Weighted average
           term to maturity of debt
                FY20: 3.9 years

               Credit ratings

       BBB+                BBB          (stable)
         Issue rating      Issuer credit rating
     (fixed-rate bonds)
                                                                                                         17
Balance sheet

             $3.2b              > Portfolio fair value gain of $11.8m, after accounting
                                  for acquisitions and capex during 1H (including
                                  $2.6m gross up of lease liabilities).
           Property assets
                                > Valuation assumptions have remained stable on
         FY20: $3.1b (+$0.1b)     FY20. The unwinding of COVID-19 abatements and
                                  a firming of capitalisation rates across some assets

            31.8%
                                  has had a positive impact on value.

                                > Investment liquidity and appetite has improved
                                  from FY20 but partially dampened by the August
              Gearing
                                  2020 lockdown.
             FY20: 32.0%
                                > Gearing decreased marginally and remains within
                                  the self-imposed target range of 25-35%.
             $1.29
        Net asset backing per
                share
             FY20: $1.26

                                                                                          18
FFO and AFFO per share

                                    3.54 cps
                                                                                                            > Funds from operations (FFO) per share decreased
                                                                                                              1.7%.

                                                 FFO                                                        > AFFO per share decreased by 27.6%, due to the
                                                                                                              cash cost of COVID-19 rent abatements and
                                     -0.06 cps (-1.7%)                                                        deferrals, and the increased weighted average
                                                                                                              number of shares following the November 2019

                                    2.32 cps
                                                                                                              equity raise.

                                                                                                            > The AFFO payout ratio of 95% is in line with the
                                               AFFO                                                           revised dividend policy of paying out between 90%
                                                                                                              and 100% of AFFO.
                                    -0.89 cps (-27.6%)

                                           95%
                                   AFFO payout ratio

General note: FFO and AFFO cps are calculated using the weighted average number of shares for the period.

                                                                                                                                                                  19
A clear focus

Stabilise                                                        Grow

> Effectively mitigate                                           • Advance Drury private plan
  operational impacts of                                          change application, with a
  COVID-19, maintaining a                                         view to accelerating the
  healthy tenant portfolio                                        development timeline.
  through the pandemic.
                                                                 • Recycle capital and grow
                               Diversify
> Strengthen and diversify                                        non-retail revenue streams
  tenant mix at Sylvia Park.                                      with a continued focus on
                               > Continue design and              diversifying funding sources.
                                 planning of Sylvia Park
                                 Towers 2 and 3, in readiness
                                 to proceed as market
                                 conditions and tenant
                                 demand dictate.

                               > Progress build-to-rent design
                                 and secure resource
                                 consent for first scheme.

                                                                                                  20
Appendix 1:
Property update
Contents
Appendix   Title                                 Page
  1.1      Our portfolio                          23
  1.2      Property portfolio summary             24
  1.3      Portfolio statistics                   25
  1.4      Net rental income                      26
  1.5      Capitalisation rate history            27
  1.6      Geographic diversification             28
  1.7      Sector and tenant diversification      29
  1.8      Mixed-use portfolio diversification    30
  1.9      Retail portfolio diversification       31
  1.10     Office portfolio diversification       32
  1.11     Rent reviews and new leasing           33
  1.12     Lease expiry profile                   34
  1.13     Tenant diversification                 35
  1.14     Retail sales by centre                 36
  1.15     Retail sales by category               38
1.1 Our portfolio

          Sylvia Park
          Sylvia Park                                                     Sylvia Park Lifestyle                                          LynnMall

                                                                          The Base (50%)                         The Base (50%)

                        Westgate Lifestyle         Centre Place North                             Vero Centre                     ASB North Wharf

                                The Plaza                   Northlands                 The Aurora Centre                           44 The Terrace

                                         KEY:   Mixed-use portfolio      Retail portfolio     Office portfolio
                                                                                                                                                    23
1.2 Property portfolio summary

                                                                                                                         30-Sep-20                                                                 31-Mar-20
                                                                                               Mixed-use               Retail           Office              Total        Mixed-use               Retail           Office              Total
Number of assets (appendix 1.3)                                                                            4                 4                 4               12                    4                 4                 4               12
Value ($m)1,2 (appendix 1.3)                                                                       1,550.8              469.0            950.3           2,970.1              1,499.3             480.5             910.4          2,890.2
% of total portfolio by value (appendix 1.7)                                                              48               15                30                93                   48                16               29                93
Weighted average capitalisation rates2 (appendix 1.3)                                                 5.83%             8.05%             5.27%            6.00%                5.87%             8.11%             5.46%            6.11%
Net lettable area (sqm) (appendix 1.3)                                                             226,403           115,092            95,995          437,491              224,691           114,839            95,998          435,528
Number of tenants (appendix 1.13)                                                                       495               308                68               871                 504               318                68               890
% investment portfolio by gross income                                                                    47               26                27               100                   47                27               26               100
Occupancy (by area)3 (appendix 1.3)                                                                   99.3%             98.4%             99.6%            99.1%                99.9%             99.4%             99.0%            99.5%
Weighted average lease expiry (by income) (appendix 1.3)                                         3.6 years         2.9 years         8.5 years        4.7 years            3.7 years         3.2 years         8.7 years         4.9 years

The following notes apply to all of appendix 1 (where applicable): 1: As at 30-Sept-20, excluded other properties and development land with a combined value of $224.2m (7% of total portfolio value). As at 31-Mar-20, excluded other
properties and development land with a combined value of $214.7m (7% of total portfolio value). 2: As at 30-Sept-20, Sylvia Park was valued ‘as if complete’ at $1.105 billion, based on a capitalisation rate of 5.50%. The deduction of
outstanding development costs for Level 1 ($45.4m), together with allowances for profit and risk and stabilisation ($14.5m), resulted in an ‘as is’ value of $1.045 billion. As at 31-Mar-20, Sylvia Park was valued ‘as if complete’ at $1.09
billion, based on a capitalisation rate of 5.50%. The deduction of outstanding development costs for Level 1 and south carpark ($84.9m), together with allowances for profit and risk and stabilisation ($23.2m), resulted in an ‘as is’ value
of $982m. 3: Tenancies at Westgate Lifestyle subject to vendor rental underwrites are treated as occupied. General note: Kiwi Property owns 100% of all assets except The Base which is 50% owned.

                                                                                                                                                                                                                                                 24
1.3 Portfolio statistics

                         Adopted value $m       Capitalisation rate %           NLA sqm                Occupancy %               WALE years
As at                   30-Sep-20   31-Mar-20   30-Sep-20     31-Mar-20    30-Sep-20   31-Mar-20    30-Sep-20   31-Mar-20    30-Sep-20   31-Mar-20
Sylvia Park                 1,045       982.0        5.50           5.50      86,199       84,714        99.6         99.9         3.6         3.8
Sylvia Park Lifestyle        77.3        74.3        6.13           6.25      16,550       16,550       100.0        100.0         2.4         1.9
LynnMall                    245.0       245.0        6.63           6.63      37,569       37,517        98.4         99.7         4.0         4.2
The Base                    183.5       198.0        6.50           6.63      86,084       85,910        99.3         99.9         3.6         3.3
Mixed-use portfolio       1,550.8     1,499.3        5.83           5.87     226,403      224,691        99.3         99.9         3.6         3.7
Westgate Lifestyle           83.5        79.0        6.50           6.63      25,622       25,622        99.6        100.0         3.8         4.3
Centre Place North           36.5        36.5       10.88         11.25       16,153       15,788        97.7         99.1         2.5         2.7
The Plaza                   169.0       170.0        8.25           8.25      32,304       32,304        98.6        100.0         2.5         2.9
Northlands                  180.0       195.0        8.00           8.00      41,014       41,125        97.7         98.8         3.1         3.4
Retail portfolio            469.0       480.5        8.05           8.11     115,092      114,839        98.4         99.4         2.9         3.2
Vero Centre                 475.0       445.0        5.00           5.25      39,541       39,544        99.1         97.9         5.9         6.0
ASB North Wharf             245.0       238.0        5.13           5.25      21,625       21,625       100.0        100.0        10.4        10.7
The Aurora Centre           173.0       170.3        5.88           6.00      24,504       24,504       100.0        100.0        13.7        14.2
44 The Terrace               57.3        57.1        6.25           6.38      10,325       10,325        99.3         99.1         6.3         6.7
Office portfolio            950.3       910.4        5.27           5.46      95,995       95,998        99.6         99.0         8.5         8.7
Investment portfolio      2,970.1     2,890.2        6.00           6.11     437,491      435,528        99.1         99.5         4.7         4.9
Adjoining properties        159.1       154.7
Development land             65.0        60.0
Total portfolio           3,194.2     3,104.9

                                                                                                                                                     25
1.4 Net rental income

                                            30-Sep-20   30-Sep-19          variance
Year ended                                        $m          $m    $m                  %    > Net operating income (NOI) reduced $6.2m
Sylvia Park                                      20.0        21.8   -3.3              -8.3     year-on-year.
Sylvia Park Lifestyle                             2.5         2.6   -0.1              -4.5
LynnMall                                          8.2         9.4   -1.2          -12.9      > Total COVID-19 NOI impact was -$9.7m
The Base                                          5.5         6.4   -0.8          -12.4        including rent relief and doubtful debts (-
Mixed-use portfolio                              36.3        40.2   -3.9              -9.8
                                                                                               $8.1m) and lost income and increased
Westgate Lifestyle                                2.7         3.0   -0.3          -11.0
                                                                                               vacancies (-$1.6m).
Centre Place North                                1.8         2.6   -0.8          -31.9
                                                                                             > COVID-19 impact is post-amortisation of rent
The Plaza                                         6.9         8.3   -1.3          -16.1
                                                                                               abatements across lease terms.
Northlands                                        8.5         9.9   -1.3          -13.7
Retail portfolio                                 19.9        23.7   -3.8          -16.2      > COVID-19 NOI impact partially offset by
Vero Centre                                      11.2        10.9   +0.3          +2.7         growth in office and sundry portfolios
ASB North Wharf                                   6.6         6.4   +0.2          +3.2         (+$2.0m) and a full period of ANZ Raranga
The Aurora Centre                                 4.3         4.2   +0.1          +3.4         rent (+$1.4m).
44 The Terrace                                    1.5         1.6   -0.1              -3.9
Office portfolio                                 23.6        23.0   +0.6          +2.5
Other properties                                  3.1         2.1   +1.0         +47.0
Net operating income                             82.9        89.1   -6.2              -7.0
Straight-lining of fixed rental increases         0.8         0.6   +0.3         +50.5
NZ IFRS 16 expense reclassifications              1.2           -   +1.2           N/A
Net rental income                                84.9        89.6   -4.7              -5.3

                                                                                                                                              26
1.5 Capitalisation rate history

           8.50%

           8.00%                                                                                                                                                                8.05%

           7.50%

           7.00%

           6.50%

           6.00%                                                                                                                                                                6.00%
                                                                                                                                                                                5.83%

           5.50%

                                         Global                  Christchurch                                                                               COVID-19            5.27%
                                     Financial Crisis            earthquakes
           5.00%

                                                                                                                                                                       Sep-20
                   Mar-07

                            Mar-08

                                           Mar-09

                                                        Mar-10

                                                                     Mar-11

                                                                                Mar-12

                                                                                            Mar-13

                                                                                                     Mar-14

                                                                                                               Mar-15

                                                                                                                        Mar-16

                                                                                                                                 Mar-17

                                                                                                                                          Mar-18

                                                                                                                                                   Mar-19

                                                                                                                                                              Mar-20
                                            Key:                 Mixed-use               Retail           Office         Investment portfolio
                                                                                                                                                                                        27
1.6 Geographic diversification

                          ($2.38b) Auckland
                                                                                                                     Geographic diversification
              Auckland region: Pop. 1,572,000                                                                                 by portfolio value
                 (Largest region, 33.4% of NZ)
                        3 x mixed-use assets
                                1 x retail asset
                              2 x office assets

                           ($226m) Hamilton
                  Waikato region: Pop. 458,000
                 (4th largest region, 9.7% of NZ)
                            1 x mixed-use asset
                                  1 x retail asset
         2 x 3rd party management mandates

                 ($169m) Palmerston North
  Manawatu-Whanganui region: Pop. 239,000
             (6th largest region, 5.1% of NZ)
                              1 x retail asset

                                                                      Wellington ($230m)
                                                                      New Zealand’s capital city
                                                                      Wellington region: Pop. 507,000
                                                                      (3rd largest region, 10.8% of NZ)
                                                                      2 x office assets
                                                                      1 x 3rd party management mandate
                                                                                                                   Auckland                        75%
                                                                                                                   Wellington                       7%
                                                                      Christchurch ($187m)
                                                                      Canterbury region: Pop. 600,000              Hamilton                         7%
                                                                      (2nd largest region, 12.8% of NZ)
                                                                      1 x retail asset                             Christchurch                     6%
                                                                                                                   Palmerston North                 5%
                                           Note: Population statistics sourced from Statistics New Zealand, 2018
                                           Census results (usually resident population count).

                                                                                                                                                         28
1.7 Sector and tenant diversification

                  Sector diversification                                    Tenant diversification
                        by portfolio value                              by investment portfolio gross income

               Mixed-use                     48%   Specialty stores                  47%        Mini-majors              12%
               Retail                        15%   Banking                            8%        Government               7%
               Office                        30%   Department stores and DDS          6%        Legal                    5%
               Other                         7%    Supermarkets                       4%        Insurance                3%
                                                   Financial services                 3%        Cinemas                  2%
                                                   Consultancy and other office       2%        Home and living majors   1%

                                                                                                                               29
1.8 Mixed-use portfolio diversification

                 Property type                   Geographic diversification                Tenant diversification
            by mixed-use portfolio value           by mixed-use portfolio value         by mixed-use portfolio gross income

          Regional centres1                95%    Auckland                        88%   Specialty stores                      60%
          Large format centres             5%     Hamilton                        12%   Mini-majors                           20%
       1: Includes ANZ Raranga.                                                         Department stores and DDS             6%
                                                                                        Supermarkets                          4%
                                                                                        Banking                               3%
                                                                                        Cinemas                               3%
                                                                                        Insurance                             2%
                                                                                        Home and living majors                1%
                                                                                        Other                                 1%

                                                                                                                                    30
1.9 Retail portfolio diversification

               Property type                   Geographic diversification                    Tenant diversification
             by retail portfolio value             by retail portfolio value              by retail portfolio gross income

          Regional centres               74%    Christchurch                   38%   Specialty stores                        65%
          Large format centres           18%    Palmerston North               36%   Mini-majors                             12%
          Sub-regional centres           8%     Auckland                       18%   Department stores and DDS               10%
                                                Hamilton                       8%    Supermarkets                            8%
                                                                                     Cinemas                                 2%
                                                                                     Home and living majors                  2%
                                                                                     Other                                   1%

                                                                                                                                   31
1.10 Office portfolio diversification

              Property type                  Geographic diversification             Tenant diversification
           by office portfolio value             by office portfolio value         by office portfolio gross income

         Premium                       50%    Auckland                       76%   Government                         25%
         A-grade campus                26%    Wellington                     24%   Banking                            24%
         A-grade                       18%                                         Legal                              20%
         B-grade                       6%                                          Financial services                 11%
                                                                                   Insurance                          9%
                                                                                   Other office                       5%
                                                                                   Specialty stores                   4%
                                                                                   Consultancy                        1%
                                                                                   Other                              1%

                                                                                                                            32
1.11 Rent reviews and new leasing

Rent reviews                         Mixed-use    Retail   Office      Total   Rent reviews
No.                                       187      108        31       326     > High percentage of structured reviews (82%)
NLA (sqm)                              51,271    33,707    35,553   120,531      has provided consistent uplift, averaging +2.5%
% investment portfolio NLA                 12         8        8        28
                                                                                 on a compound annual basis.
Rental movement (%)                      +2.5      +2.9      +3.7      +3.0
                                                                               New leasing
Compound annual growth (%)               +2.1      +2.5      +2.9      +2.5    > Leasing volume impacted by COVID-19 with
Structured increases (% portfolio)         97       86        58        82       less than half the normal level of new deals
                                                                                 recorded for the period.
New leases and renewals
No.                                        37       15         9        61     > Mixed-use (-9.1%) impacted by short-term
NLA (sqm)                               4,681     1,741     2,552     8,975      deals with a national tenant at Sylvia Park,
% investment portfolio NLA                  1         0        1          2
                                                                                 LynnMall and The Base.
Rental movement (%)                       -9.1    -22.5      +2.0     -10.0
                                                                               > Retail (-22.5%) impacted by short-term deals
WALE (years)                              4.5       2.4       4.9       4.2      with a national tenant at Northlands and The
                                                                                 Plaza.
Total (excl development leasing)
No.                                       224      123        40       387     > Office (+2.0%) driven by new leases at Vero
NLA (sqm)                              55,952    35,449    38,105   129,506      Centre and retail leases at ASB North Wharf,
% investment portfolio NLA                 13         8        9        30       and 44 The Terrace.
Rental movement (%)                      +0.8      +0.0      +3.6      +1.5

                                                                                                                                   33
1.12 Lease expiry profile

                                    Lease expiry profile                                    Mixed-use and retail
                          % of investment portfolio gross income                            > The retention of mixed-use and retail portfolio
 50%                                                                                          tenants is a focus.
                                                                                    43%
                                                                                            > We have agreed most rent relief
 40%                                                                                          arrangements, helping tenants through this
                                                                                              difficult period.

 30%                                                                                        > Level of holdovers is elevated with many
                                                                                              retailers delaying new lease negotiations while
                                                                                              they navigate COVID-19.
 20%
                                14%
                                                                              13%           Office
                                                              10%                           > 1,853 sqm of floor space has been leased at
 10%               7%                         8%
          5%
                                                                                              the Vero Centre in 1H21 (4.7% of building NLA)
                                                                                              with a WALE of 5.9 years.
 0%
       Vacant or   FY21         FY22          FY23            FY24        FY25      FY26+   > As a result, only 6% of office gross income is
       holdover                                                                               due for expiry in the next four years.
                     Key:         Mixed-use          Retail          Office

                                                                                                                                                34
1.13 Tenant diversification

    Tenant diversification                               Top 20 tenants                                 Our top 20 tenants
    % of investment portfolio gross income               % of investment portfolio gross income
    ● Department stores and DDS                    6     ASB Bank                                 7.1
    ● Supermarkets                                 4     Ministry of Social Development           5.0
                                                                                                                 occupy
    ● Cinemas                                      2     Farmers                                  2.7
    ● Home and living                              1     Progressive Enterprises                  2.2           52%
                                                                                                               of investment
    ● Mini-majors                                 12     ANZ Bank                                 2.1
                                                                                                                  portfolio
    ● Fashion                                     15     Bell Gully                               1.9               area

    ● Food                                        11     Suncorp                                  1.9
    ● General                                      6     Foodstuffs                               1.8
    ● Pharmacy and wellbeing                       6     The Warehouse                            1.8
    ● Home and living                              2     Just Group                               1.7            contribute
    ● Other retail
                                                                                                                40%
                                                   7     HOYTS Cinemas                            1.6
         Banking                                   8     Cotton On Clothing                       1.5
                                                                                                               of investment
         Government                                7     Russell McVeagh                          1.5          portfolio gross
                                                                                                                   income
         Legal                                     5     Kmart                                    1.5
         Insurance                                 3     Hallenstein / Glasson                    1.4
         Financial services                        3     Craigs Investment Partners               1.0
         Consultancy and other office              2     BNZ                                      0.9    have a weighted average
                                                                                                              lease expiry of
         Total (871 tenants)                     100     IAG                                      0.9
                                                         Rebel / Briscoes                         0.8      6.8 years
  Key:     Majors     Mini-majors   Specialty   Office   Tertiary Education Commission            0.8

                                                                                                                                   35
1.14 Retail sales by centre - actual

Actual sales                        MAT $m            % var. from Sep-19               Specialty sales2,3          Ped. count     > On a like-for-like basis, shopping centre sales
Year ended                       30-Sep-201,2         total       like-for-like      $/sqm           GOC%           million pa      were down 10.3% compared to 1H20.
Sylvia Park                              550.0
LynnMall                                 254.3
The Base – Te Awa                        159.6
Mixed-use centres                        963.8
Centre Place North                        70.9
The Plaza                                218.9
Northlands                               312.3
Retail centres                           602.1
Shopping centres                       1,565.9        -12.2           -10.3          10,900            12.7            39.2
Sylvia Park Lifestyle4                    15.5
Westgate Lifestyle4                       23.2
The Base – LFR4                          200.2
Large format retail                      238.8
Total                                  1,804.7

1: Sales are actual recorded sales from tenants for the 12 months ended 30-Sep-20. 2: In FY20 we changed the basis of our sales
reporting to align with the Australian Council of Shopping Centres guidelines and methodology adopted by our peers. Under
these guidelines sales are now reported inclusive of GST. 3: Specialty sales $/sqm and GOC% include commercial services
categories. 4: Sales data is being requested from tenants who are not obliged to provide under current leases. Total sales
reported are shown, but due to the changing composition of those who do report, comparable statistics are not meaningful.

                                                                                                                                                                                      36
1.14 Retail sales by centre - adjusted

Adjusted sales                      MAT $m            % var. from Sep-19               Specialty sales2,3         Ped. count                  > After adjusting for lost trade due to the
Year ended                       30-Sep-201,2         total       like-for-like      $/sqm          GOC%           million pa                   lockdown periods, like-for-like sales were in line
Sylvia Park                              626.8
                                                                                                                                                with 1H20.
LynnMall                                 290.3
                                                                                                                                              > Specialty sales productivity recovered but due
The Base – Te Awa                        181.3                                                                                                  to social-distancing and other limitations on
Mixed-use centres                      1,098.4                                                                                                  trading, remains marginally below the Feb-20
Centre Place North                         81.6                                                                                                 metric.
The Plaza                                238.9
Northlands                               335.0
Retail centres                           655.5
Shopping centres                       1,753.9        -1.7            +0.0           12,800           N/A             N/A
Sylvia Park Lifestyle4                     17.7
Westgate Lifestyle4                        28.3
The Base – LFR4                          219.8
Large format retail                      265.8
Total                                  2,019.7

1: Sales are actual recorded sales from tenants for the 12 months ended 30-Sep-20, subsequently adjusted to reflect various COVID-19 lockdown periods. For April 2020, where all but essential services were at Alert Level 4
lockdown, monthly sales were estimated based on the tenant’s April 2019 monthly sales adjusted for the average difference in the prior six months trade over the corresponding month a year earlier. For May, August and
September 2020 (Auckland only), actual sales recorded were adjusted pro-rata for the number of days traded. June, July and September 2020 (out of Auckland only), were not impacted by lockdown therefore recorded sales
for the month are unadjusted. 2: In FY20 we changed the basis of our sales reporting to align with the Australian Council of Shopping Centres guidelines and methodology adopted by our peers. Under these guidelines sales are
now reported inclusive of GST. 3: Specialty sales $/sqm and GOC% include commercial services categories. 4: Sales data is being requested from tenants who are not obliged to provide under current leases. Total sales
reported are shown, but due to the changing composition of those who do report, comparable statistics are not meaningful.
                                                                                                                                                                                                                                  37
1.15 Retail sales by category - actual

Actual sales                                                        MAT $m                     % var. from Sep-19                  > On a like-for-like basis, supermarkets – being an
Year ended                                                        30-Sep-201,2               total             like-for-like         essential service - were unsurprisingly the only
● Supermarkets                                                              358.7                    +5.6                  +5.6      category to record a sales improvement year-
● Department stores and DDS                                                 217.2                    +3.5                   -9.9     on-year.
● Cinemas                                                                     19.0                   -51.7                -51.7
                                                                                                                                   > On an overall basis, department store sales
● Mini-majors                                                               236.8                    -14.5                -15.1
                                                                                                                                     were up on the prior year due primarily to a full
● Fashion                                                                   238.8                    -18.7                -15.8      year’s sales from Kmart Sylvia Park.
● Commercial services (non-travel)                                            72.4                   -11.6                -11.0
● Commercial services (travel)                                                91.9                   -35.3                  -6.0   > Cinemas and restaurants have been
● Food (non-restaurant)                                                       96.7                   -18.2                -18.5
                                                                                                                                     particularly affected by restrictions on the size
                                                                                                                                     of gatherings and this can be seen with sales
● Food (restaurant)                                                           32.6                   -12.6                -24.4
                                                                                                                                     declines of 52% and 24% respectively
● Pharmacy and wellbeing                                                    102.9                    -12.3                -11.7      compared to 1H20 on a like-for-like basis.
● General (incl. activate)                                                    78.9                   -21.9                -13.9
● Home and living                                                             19.9                   -23.3                -12.8
Shopping centres                                                          1,565.9                    -12.2                -10.3

1: Sales are actual recorded sales from tenants for the 12 months ended 30-Sep-20. 2: In FY20 we changed the basis of our sales
reporting to align with the Australian Council of Shopping Centres guidelines and methodology adopted by our peers. Under
these guidelines sales are now reported inclusive of GST.

                                                                                                                                                                                         38
1.15 Retail sales by category - adjusted

Adjusted sales                                                     MAT $m                     % var. from Sep-19                  > After adjustment, a number of categories have
Year ended                                                       30-Sep-201,2              total              like-for-like         recorded like-for-like sales improvement over
● Supermarkets                                                             358.7                    +5.6                 +5.6       the prior comparable period.
● Department stores and DDS                                                244.6                   +16.6                 +1.9
                                                                                                                                  > Departments stores, home and living and
● Cinemas                                                                    22.6                  -42.4                -42.4
                                                                                                                                    general retail, all benefited from the post-
● Mini-majors                                                              275.8                    -0.4                  -1.1
                                                                                                                                    lockdown retail rush.
● Fashion                                                                  278.3                    -5.2                  -1.8
● Commercial services (non-travel)                                           81.1                   -1.0                  -0.4    > Commercial services (travel) increases year-
● Commercial services (travel)                                             107.4                   -24.4                 +9.9       on-year after sales adjustment with a surge in
● Food (non-restaurant)                                                    113.1                    -4.4                  -4.6
                                                                                                                                    foreign currency business outstripping the sales
                                                                                                                                    decline for travel centres.
● Food (restaurant)                                                          38.4                   +2.8                  -9.9
● Pharmacy and wellbeing                                                   118.3                    +0.8                 +1.5
● General (incl. activate)                                                   91.9                   -9.1                 +0.6
● Home and living                                                            23.6                   -8.8                 +3.4
Shopping centres                                                         1,753.9                    -1.7                 +0.0

1: Sales are actual recorded sales from tenants for the 12 months ended 30-Sep-20, subsequently adjusted to reflect various
COVID-19 lockdown periods. For April 2020, where all but essential services were at Alert Level 4 lockdown, monthly sales were
estimated based on the tenant’s April 2019 monthly sales adjusted for the average difference in the prior six months trade over
the corresponding month a year earlier. For May, August and September 2020 (Auckland only), actual sales recorded were
adjusted pro-rata for the number of days traded. June, July and September 2020 (out of Auckland only), were not impacted by
lockdown therefore recorded sales for the month are unadjusted. 2: In FY20 we changed the basis of our sales reporting to align
with the Australian Council of Shopping Centres guidelines and methodology adopted by our peers. Under these guidelines sales
are now reported inclusive of GST.

                                                                                                                                                                                       39
Appendix 2:
Financial update
Contents
Appendix   Title                                   Page
  2.1      Profit after tax                         42
  2.2      Operating profit before income tax       43
  2.3      Interest and finance charges             44
  2.4      Management expense ratio (MER)           45
  2.5      Funds from operations (FFO)              46
  2.6      Adjusted funds from operations (AFFO)    47
  2.7      Dividends                                48
  2.8      Balance sheet                            49
  2.9      Investment properties movement           50
  2.10     Debtors                                  51
  2.11     Net finance debt movement                52
  2.12     Finance debt facilities                  53
  2.13     Capital management metrics               54
  2.14     Fixed-rate debt profile                  55
2.1 Profit after tax
                                                                          30-Sep-20        30-Sep-19                   Variance
Six months ended                                                                   $m              $m           $m             %
Property revenue                                                                111.3            117.3          -6.0         -5.1         > Property revenue decreased 5.1%, driven by
Property management income                                                         0.9              0.9        +0.0         +5.7
                                                                                                                                              rent abatements for COVID-19, partially offset
                                                                                                                                              by higher rental income in office, ANZ Raranga
Total income                                                                    112.2            118.2         -6.0         -5.1
                                                                                                                                              and the sundry portfolio.
Direct property expenses                                                         -26.4           -27.7         +1.3         +4.7
Employment and administration expenses (Appendix 2.4)                            -10.8           -11.0         +0.2         +1.7
                                                                                                                                          > Decreased fair value loss on interest rate
Total expenses                                                                  -37.2            -38.7         +1.5         +3.8              swaps, driven by interest rate movements.
Profit before net finance expenses, other
                                                                                 75.0             79.5         -4.5         -5.6
(expenses)/income and income tax
                                                                                                                                          > Property portfolio revalued at 1H21 (no
Interest income                                                                    0.1              0.1         -0.0       -16.1
                                                                                                                                              revaluation undertaken 1H20), resulting in
Interest and finance charges (Appendix 2.3)                                      -19.9           -19.4          -0.5         -2.7             $11.8m gain, inclusive of right-of-use asset
Net fair value loss on interest rate derivatives                                  -2.8           -12.9       +10.1        +78.0               movements.
Net finance expenses                                                            -22.7            -32.2         +9.5       +29.6
Profit before other (expenses)/income and income tax                             52.3             47.3         +5.0       +10.6           > Improved tax position due to introduction of
Net fair value gain on investment properties                                      11.8                -      +11.8          N/A               depreciation on building structures, and
Other income                                                                     11.8                 -      +11.8          N/A               COVID-19 relief deductions.
Profit before income tax                                                         64.2             47.3       +16.9        +35.6
Current tax                                                                       -5.3           -11.4         +6.1       +53.4
Deferred tax                                                                      -4.6              0.9         -5.5      -644.0
Profit after income     tax1   (GAAP2    measure)                                54.2             36.8       +17.5        +47.5

1: The reported profit has been prepared in accordance with New Zealand Generally Accepted Accounting Practice (GAAP) and complies with New Zealand Equivalents to International Financial Reporting Standards. The reported
profit information has been extracted from the half-year financial statements which have been the subject of a review by an independent auditor pursuant to the External Reporting Board’s New Zealand Standards on Review
Engagement 2410. 2: GAAP is a common set of accounting principles, standards and procedures that companies must follow when they compile their financial statements. Kiwi Property’s financial statements comply with New
Zealand Equivalents to International Financial Reporting Standards and other guidance as issued by the External Reporting Board, as appropriate for profit-oriented entities, and with International Financial Reporting Standards.
                                                                                                                                                                                                                                      42
2.2 Operating profit before income tax

                                                                                   30-Sep-20        30-Sep-19                  Variance

Six months ended                                                                             $m             $m              $m                %
Profit before tax (Appendix 2.1)                                                           64.2           47.3           +16.9           +35.6
Adjusted for:
 Net fair value gain on investment properties (Appendix 2.1)                              -11.8                -          -11.8            N/A
 Net fair value loss on interest rate derivatives (Appendix 2.1)                             2.8          12.9            -10.1             -78
Operating profit before income tax1 (non-GAAP)                                             55.2           60.2             -5.0            -8.4

1: Operating profit before income tax is an alternative non-GAAP performance measure used by Kiwi Property to assist investors in assessing the
company’s performance for the year by adjusting for a number of non-operating items. Operating profit before income tax does not have a
standard meaning prescribed by GAAP and therefore may not be comparable to information presented by other entities. The reported
operating profit before income tax has been extracted from the company's half-year financial statements which have been the subject of a
review by an independent auditor pursuant to the External Reporting Board’s New Zealand Standards on Review Engagement 2410.

                                                                                                                                                  43
2.3 Interest and finance charges

                                              30-Sep-20   30-Sep-19          Variance           > Interest on bank debt reduced relative to prior
Six months ended                                    $m          $m    $m                   %      year following November 2019 equity issue.
Interest on bank debt                             -10.2       -12.8   +2.7          +20.9
Interest on bonds                                 -11.6       -11.6   +0.0              +0.0    > Interest on lease liabilities increased following
Interest on lease liabilities                      -3.8           -   -3.8              N/A       reclassification of ground lease costs under the
Interest expense incurred                         -25.6      -24.4    -1.2              +4.7      new NZ IFRS 16: Leases standard.
Interest capitalised to:
 Sylvia Park                                        3.6        2.8    +0.8          +28.6       > Capitalised interest increased due to
 Drury land                                         1.9        2.0    -0.1               -5.8
                                                                                                  capitalisation of expenditure on Sylvia Park
                                                                                                  Level 1.
 Other properties under development                 0.2        0.2    -0.0              -24.6
Total capitalised interest                          5.7        5.0    +0.6          +12.4
Interest and finance charges (Appendix 2.1)       -19.9       -19.4   -0.5              -2.7

                                                                                                                                                      44
2.4 Management expense ratio (MER)

                                                                                          30-Sep-20              31-Mar-20       > Weighted average assets decrease driven by
12 months ended                                                                                    $m                     $m      fair value loss in March 2020, partially offset by
Employment and administration expenses               (Appendix 2.1)                               22.4                   22.6     new acquisitions and completed
Less recovered through property management fees                                                    -8.4                  -8.6     developments.
Net expenses                                                                                      14.0                   13.9
Weighted average assets                                                                       3,236.4                3,280.2
Management expense ratio1 (non-GAAP measure)                                                   43 bps                42 bps

1: MER is an alternative non-GAAP measure used by Kiwi Property to assist investors in assessing the company’s underlying
operating costs. MER is a measure commonly used by real estate entities. MER does not have a standard meaning prescribed by
GAAP and therefore may not be comparable to information presented by other entities. Kiwi Property determines MER through
an annualised calculation, where employment and administration expenses, net of expenses recovered from tenants, is divided
by the weighted average value of its property assets. The reported MER information has been extracted from the company's half-
year financial statements which have been the subject of a review by an independent auditor pursuant to the External Reporting
Board’s New Zealand Standards on Review Engagement 2410.

                                                                                                                                                                                       45
2.5 Funds from operations (FFO)

                                                                                 30-Sep-20        30-Sep-19              Variance         > 7.2% favourable FFO movement from the
Six months ended                                                                          $m              $m           $m            %      prior period.
Profit after tax   (Appendix 2.1)                                                        54.2            36.8       +17.5       +47.5
Adjusted for:                                                                                                                             > Includes positive impact of tax depreciation
 Net fair value gain on investment properties (Appendix 2.1)                            -11.8                -       -11.8        N/A       on buildings.
 Net fair value loss on interest rate derivatives (Appendix 2.1)                           2.8           12.9        -10.1       -78.0
 Straight-lining of fixed rental increases                                                -0.8           -0.6         -0.2      +50.5     > COVID-19 related adjustments for the
 Amortisation of tenant incentives and leasing fees                                        3.4            3.6         -0.2        -5.6
                                                                                                                                            amortisation of rent abatements and for rent
                                                                                                                                            deferrals agreed.
 Reversal of lease liability movement in investment properties                             2.6               -       +2.6         N/A
 Amortisation of rent abatements (COVID-19)                                                3.5               -       +3.5         N/A
 Rent deferrals (COVID-19)                                                                -2.9               -        -2.9        N/A
 Deferred tax expense (Appendix 2.1)                                                       4.6           -0.9        +5.5     +644.0
Funds from operations (FFO)1 (non-GAAP)                                                  55.6            51.9        +3.7        +7.2

1: FFO is an alternative non-GAAP performance measure used by Kiwi Property to assist investors in assessing the company’s underlying
operating performance. FFO is a measure commonly used by real estate entities to describe their underlying and recurring earnings from
operations. FFO does not have a standard meaning prescribed by GAAP and therefore may not be comparable to information
presented by other entities. FFO is calculated by Kiwi Property in accordance with the Voluntary Best Practice Guidelines issued by the
Property Council of Australia. The reported FFO information has been extracted from the company's half-year financial statements which
have been the subject of a review by an independent auditor pursuant to the External Reporting Board’s New Zealand Standards on
Review Engagement 2410.

                                                                                                                                                                                           46
2.6 Adjusted funds from operations (AFFO)

                                                                       30-Sep-20 30-Sep-19                           Variance        > AFFO has reduced 21.1% from the prior period,
Six months ended                                                                $m             $m              $m               %      driven by the cash impact of COVID-19 rent
Funds from operations        (FFO)1 (Appendix 2.5)                             55.6           51.9           +3.7           +7.2       relief offered.
Adjusted for
 Maintenance capital expenditure                                                -1.8           -2.5          +0.7          +27.7     > Consistent with the Company’s revised
 Capitalised tenant incentives and leasing fees                                 -1.5           -3.2          +1.7          +53.1       dividend policy, the cash dividend payout is
 Captalised rent abatements (COVID-19)                                        -15.9                -        -15.9            N/A
                                                                                                                                       between 90% and 100% of AFFO.
Adjusted funds from operations (AFFO)2 (non-GAAP)                              36.5           46.2            -9.8         -21.1
AFFO (cents per share)3                                                        2.32           3.21
Cash dividend payout ratio to AFFO                                             95%           110%

1: FFO is an alternative non-GAAP performance measure used by Kiwi Property to assist investors in assessing the company’s
underlying operating performance. FFO is a measure commonly used by real estate entities to describe their underlying and
recurring earnings from operations. FFO does not have a standard meaning prescribed by GAAP and therefore may not be
comparable to information presented by other entities. FFO is calculated by Kiwi Property in accordance with the Voluntary Best
Practice Guidelines issued by the Property Council of Australia. The reported FFO information has been extracted from the
company's half-year financial statements which have been the subject of a review by an independent auditor pursuant to the
External Reporting Board’s New Zealand Standards on Review Engagement 2410. 2: AFFO is an alternative non-GAAP
performance measure used by Kiwi Property. AFFO is a measure used by real estate entities to describe their underlying and
recurring cash flows from operations for sustaining and maintaining existing space. Broadly, AFFO adjusts FFO by deducting the
cost of lease incentives and leasing fees and annual maintenance capital expenditure. AFFO does not have a standardised
meaning prescribed by GAAP and therefore may not be comparable to information presented by other entities. AFFO is
calculated by Kiwi Property in accordance with the Voluntary Best Practice Guidelines issued by the Property Council of Australia.
3: Calculated using the weighted average number of shares for the period.

                                                                                                                                                                                       47
2.7 Dividends

                                     30-Sep-20   30-Sep-19   30-Sep-20   30-Sep-19
                                                                                     > Kiwi Property revised its dividend policy in May
Six months ended                           $m          $m         cps2        cps2
                                                                                       2020 and now aims to pay out 90% to 100% of
Cash dividend                             34.5        50.9        2.20       3.525     AFFO. Dividends were previously based on FFO.
Imputation credits                        13.4        13.0       0.856       0.900
Gross dividend                            48.0        63.9       3.056       4.425   > A fully imputed half-year dividend will be paid
Cash dividend payout ratio to AFFO        95%        110%
                                                                                       for the period ending 30 September 2020, set
                                                                                       at 95% of AFFO.

                                                                                     > Due to the inherent uncertainty created by the
                                                                                       COVID-19 global pandemic, Kiwi Property did
                                                                                       not pay a final dividend for FY20.

                                                                                     > The dividend reinvestment plan will not apply
                                                                                       to the 1H21 dividend.

                                                                                     > The company expects full-year AFFO to be in
                                                                                       the range of 4.90 to 5.15 cents per share,
                                                                                       subject to final results and barring material
                                                                                       adverse effects or unforeseen circumstances.

                                                                                                                                          48
2.8 Balance sheet

                                                   30-Sep-20   31-Mar-20      Movement           > Investment property value increased due to
As at                                                    $m          $m      $m             %      Sylvia Park capital expenditure and an $11.8m
Investment properties (Appendix 2.9)                 3,206.7     3,114.7   +92.0         +3.0      fair value gain.
Cash (Appendix 2.11)                                    13.5        21.3    -7.8         -36.7
                                                                                                 > Trade and other receivables increase driven
Trade and other receivables (Appendix 2.10)             22.0        11.9   +10.1     +84.4
                                                                                                   by the the impact of COVID-19.
Other assets                                             9.3         8.5    +0.8         +9.5
Total assets                                         3,251.4     3,156.4   +95.0         +3.0    > $23.5m debt increase driven by capital work at
Finance debt (Appendix 2.11)                         1,033.4     1,009.9   +23.5         +2.3      Sylvia Park.
Deferred tax liabilities                                87.9        83.2    +4.6         +5.6
Other liabilities                                      103.8        91.8   +12.0     +13.1
Total liabilities                                    1,225.1     1,184.9   +40.2         +3.4
Total equity                                         2,026.4     1,971.5   +54.9         +2.8
Total equity and liabilities                         3,251.4     3,156.4   +95.0         +3.0

Gearing ratio (requirement
$m
      As at Mar-20

                   =$3,114.7
        Sylvia Park
         adjoining
          property
                                    Acquired

        Sylvia Park

          LynnMall
                                    Capex
                                               2.9 Investment properties movement

               Drury

         Fair value
          change

             IFRS
        movement

        Gross up of
     lease liabilities

              Other

      As at Sep-20
50
2.10 Debtors

                                                            30-Sep-20 31-Mar-20                                  Variance
                                                                                                                                  > Debtors increased from $5.7m to $15.0m (GST
As at                                                                    $m                $m               $m               %
                                                                                                                                    inclusive) between the FY20 and 1H21 balance
Trade debtors (including GST)                                        22.2                  6.8        +15.4           +227.2        dates, driven by COVID-19.
Provision for doubtful debts                                             -3.4          -1.0             -2.4          -227.9

Accrued COVID-19 rent relief                                             -3.8                -          -3.8                N/A   > $3.4m rent (GST inclusive) has been deferred in
                                                                                                                                    line with our COVID-19 rent relief package and
                                                                     15.0                  5.7         +9.2           +160.7
                                                                                                                                    will generally be repaid over 18 to 24 months.
Deferred rent (including GST)                                            3.4                 -               -              N/A

Prepayments                                                              3.7               6.2          -2.5            -40.8     > Provision has been made for doubtful debts
Trade and other receivables (Appendix 2.8)                           22.0             11.9            +10.1            +84.4        and COVID-19 rent relief still being negotiated.

                                                                                                                                  > Debtor movement between March 2020 and
                                                                                                                                    September 2020 is shown in the graph.
                                                                                                                                       ― Abatements, waivers and deferrals all
                                                                                                                                         form part of the COVID-19 rent relief
                                                                                                                                         offered to affected tenants.
                                    receipts

                                               Abatements

                                                               Waivers

                                                                                                   debts
            Mar-20

                           Billed
                        revenue

                                                                                Deferred

                                                                                                                  Sep-20
                                       Cash

                                                                                                 Doubtful
             As at

                                                                                    rent

                                                                                                                    As at

                                                                                                                                                                                       51
1,000
                                                                                                1,100
                                                                                                        1,200

                      400
                            500
                                  600
                                         700
                                                     800
                                                                900
                                                                                                                                                                                 As at

                                                                                                                                                             Bonds
                                                                                                                                                                     Bank debt
           net

                                                                                                                                           Cash on deposit
        finance

                                                                                                                Net finance debt
 As at Mar-20
          debt

                                        $988.6
         Mar-20

                                                                                                                    (Appendix 2.8, 2.12)

            net
      Net rental
           rental

                                                           -$87.7
       income
          income

            and
 Interestinterest
            and
      finance
         finance
                                                                      +$15.2

     charges
          charges
                                                                                                                                                                                             2.11 Net finance debt movement

           employ
                                                                                                                                           -13.5
                                                                                                                                                             476.4
                                                                                                                                                                     557.0
                                                                                                                                                                                 30-Sep-20

                                                                                                                1,019.9

 Employment
       ment/a
    / admin
        dmin
                                                                      +$11.2

       expens
   expenses
             es

          acquisiti
     Acquisition
            on of
                                                                                                                                           -21.3
                                                                                                                                                             475.9
                                                                                                                                                                     534.0
                                                                                                                                                                                 31-Mar-20

                                                                                                                988.6

               of
          investm
                                                                       +$4.0

             ent
     investment
          properti
      properties
             es

       investm
       ent/dev
 Investment /
       elopme
development
          nt
                                                                                       +$83.0

  expenditure
       expendi
         ture

        Taxtax and
             and
                                                                                         +$5.6

             other
            other

           net
        finance
 As at Sep-20
          debt
                                         =$1,019.9

         Sep-20
52
2.12 Finance debt facilities

                                                                                                            30-Sep-20                  Debt sources
Debt maturity profile as at                                                                                 $m            %
FY21                                                                                                           -           -
                                                                                                                                                 11%
FY22                 125.0                                                                                  125          9.6
FY23    32.5      25.0       33.0    32.5                                                                   123          9.5
                                                                                                                               37%                          14%
FY24     27.5 20.0              100.0              67.5              27.5          125.0                  367.5         28.2
FY25     31.5        47.0            56.0   31.5             125.0                                          291         22.4
FY26       52.5                     109.0                 80.0              52.5           100.0            394         30.3
Total facilities (Appendix 2.8)                                                                          1,300.0    100.0                                   12%

Facilities drawn                                                                                          1,032         79.4
Undrawn facilities                                                                                        268.0         20.6                           8%
                                                                                                                                     11%
                                                                                                                                            8%

Key:            ANZ                 BNZ     `   CBA              CCB               HSBC        Westpac      Bonds

                                                                                                                                                                  53
2.13 Capital management metrics

Finance debt metrics as at                                                                                                                                                                     30-Sep-20                  31-Mar-20
Weighted average term to maturity                                                                                                                                                                3.4 years                  3.9 years
Weighted average interest rate (Incl. of bonds, active interest rate derivatives, margins and line fees)                                                                                             4.29%                      4.35%

Covenants – gearing as at                                                                                                                                                                      30-Sep-20                  31-Mar-20
Gearing                                                                                                                                                                                              31.8%                      32.0%

Note: Must be 2.25 times. Calculated as net rental income / net interest expense.

Credit ratings – S&P Global Ratings1                                                                                                                                                           30-Sep-20                  31-Mar-20
Corporate (Issuer rating)                                                                                                                                                                    BBB (stable)               BBB (stable)
Fixed-rate bonds (Issue rating)                                                                                                                                                                       BBB+                       BBB+

General note: Further information about S&P Global Ratings’ credit rating scale is available at standardandpoors.com. A rating is not a recommendation by any rating organisation to buy, sell or hold Kiwi Property securities. The
rating is current as at the date stated in this presentation and may be subject to suspension, revision or withdrawal at any time by S&P Global Ratings.

                                                                                                                                                                                                                                         54
2.14 Fixed-rate debt profile

 Fixed-rate profile (inclusive of bonds on issue Sep-20: $475m, Mar-20: $475m)                      30-Sep-20    31-Mar-20
 Percentage of drawn finance debt at fixed rates                                                          70%          67%
 Weighted average interest rate of active fixed-rate debt (excl. fees and margins)                      3.11%        3.31%
 Weighted average term to maturity of active fixed-rate debt                                         3.1 years    3.1 years

                                         Fixed-rate debt maturity profile
900                                                                                            8%

800
                                                                                               7%
700

600                                                                                            6%

500
                                                                                               5%
400

300                                                                                            4%

200
                                                                                               3%
100

 0                                                                                             2%
         FY21        FY22         FY23         FY24        FY25         FY26         FY27

        Face value of active hedges (including bonds) ($m) (LHS)
        Weighted average interest rate of fixed-rate debt (excl. fees and margins) (%) (RHS)

                                                                                                                              55
Glossary
Glossary

Adjusted funds from operations   AFFO is a non-GAAP performance measure used by Kiwi Property. AFFO is a measure commonly used by real estate entities to describe their
(AFFO)                           underlying and recurring cash flows from operations. Broadly, AFFO adjusts FFO by deducting the cost of lease incentives and leasing fees and
                                 annual maintenance capital expenditure for sustaining and maintaining existing space. AFFO does not have a standardised meaning
                                 prescribed by GAAP and therefore may not be comparable to information presented by other entities. AFFO is calculated by Kiwi Property in
                                 accordance with the Voluntary Best Practice Guidelines issued by the Property Council of Australia. The reported AFFO information has been
                                 extracted from the company's half-year financial statements which have been the subject of a review pursuant to the External Reporting
                                 Board’s New Zealand Standard on Review Engagements 2410.

Discount department store        Includes Kmart and The Warehouse.
(DDS)

Funds from operations            FFO is a non-GAAP performance measure used by Kiwi Property to assist investors in assessing the company’s underlying operating performance.
(FFO)                            FFO is a measure commonly used by real estate entities to describe their underlying and recurring earnings from operations. FFO does not have
                                 a standard meaning prescribed by GAAP and therefore may not be comparable to information presented by other entities. FFO is calculated
                                 by Kiwi Property in accordance with the Voluntary Best Practice Guidelines issued by the Property Council of Australia. The reported FFO
                                 information has been extracted from the company's half-year financial statements which have been the subject of a review pursuant to the
                                 External Reporting Board’s New Zealand Standard on Review Engagements 2410.

Gearing ratio                    Calculated as finance debt (which includes secured bank debt and the face value of bonds) over total tangible assets (which excludes interest
                                 rate derivatives).

Generally accepted accounting    A common set of accounting principles, standards and procedures that companies must follow when they compile their financial statements.
practice (GAAP)                  Kiwi Property’s financial statements comply with New Zealand Equivalents to International Financial Reporting Standards and other guidance as
                                 issued by the External Reporting Board, as appropriate for profit-oriented entities, and with International Financial Reporting Standards.

Gross occupancy cost             Total gross occupancy costs (excluding GST) expressed as a percentage of moving annual turnover.
(GOC)

                                                                                                                                                                                 57
Glossary

Like-for-like retail sales   Only includes sales from those tenancies who have traded for the past 24 months.

Management expense ratio     MER is a non-GAAP measure used by Kiwi Property to assist investors in assessing the company’s underlying operating costs. MER is a measure
(MER)                        commonly used by real estate entities. MER does not have a standard meaning prescribed by GAAP and therefore may not be comparable to
                             information presented by other entities. Kiwi Property determines MER through an annualised calculation, where employment and
                             administration expenses, net of expenses recovered from tenants, is divided by the weighted average value of its property assets. The reported
                             MER information has been extracted from the company's half-year financial statements which have been the subject of a review pursuant to
                             the External Reporting Board’s New Zealand Standard on Review Engagements 2410.

Moving annual turnover       Annual sales on a rolling 12-month basis (including GST).
(MAT)

Net operating income         Excludes income resulting from straight-lining of fixed rental increases and includes the amortisation of lease incentives and property
(NOI)                        management fee income.

Net rental income            NOI, including rental income resulting from straight-lining of fixed rental increases.
(NRI)

Operating profit before      Operating profit before income tax is a non-GAAP performance measure used by Kiwi Property to assist investors in assessing the company’s
income tax                   performance for the year by adjusting for a number of non-operating items. Operating profit before income tax does not have a standard
                             meaning prescribed by GAAP and therefore may not be comparable to information presented by other entities. The reported operating profit
                             before income tax has been extracted from the company’s half-year financial statements which have been the subject of a review pursuant to
                             the External Reporting Board’s New Zealand Standard on Review Engagements 2410.
Profit after tax             The reported profit has been prepared in accordance with New Zealand GAAP and complies with New Zealand Equivalents to International
                             Financial Reporting Standards. The reported profit information has been extracted from the half-year financial statements which have been the
                             subject of a review pursuant to the External Reporting Board’s New Zealand Standard on Review Engagements 2410.

                                                                                                                                                                              58
You can also read