Presentation Material for the First Three Quarters of FY2019 - (Ending December 31, 2019) November 5, 2019
←
→
Page content transcription
If your browser does not render page correctly, please read the page content below
Presentation Material for the First Three Quarters of FY2019
(Ending December 31, 2019)

                                            November 5, 2019
Contents

■   Summary                                             p.3                    ■      Business Results by Segment                    p.14

    Consolidated Statement of Income
■                                                       p.4                              (1) Commercial Properties Business          p.15
    for the First Three Quarters of FY2019
    Consolidated Balance Sheet
■                                                       p.5                              (2) Residence Business                      p.22
    for the First Three Quarters of FY2019

■   Balance of Real Estate for Sale                     p.7                              (3) Real Estate Service Business            p.28

■   Full-year Earnings Forecast for FY2019              p.8                              (4) Other                                   p.30

■   Medium-Term Business Plan Progress Report           p.9                    ■      Appendix                                       p.35

                                                                                      Medium-Term Business Plan Investment Plans &
■   Shareholder Returns                                 p.10                                                                         p.36
                                                                                      Financial Indicator Targets

■   Vision in 2020 Onwards                                                            Fair Value of Rental Properties                p.37

                                                                                      Acquisition of Treasury Stock and
      Philosophy of Business Portfolio                  p.11                                                                         p.38
                                                                                      Implementation of Hybrid Financing

      Image of Future Growth                            p.12                          Quarterly Segment Data                         p.40

      Image of Financial Strategies                     p.13                          List of Facilities                             p.42

                                                                                      Market Data                                    p.44

                                             Copyright © Tokyo Tatemono Co., Ltd All Rights Reserved.                                  2
Summary

    Business Results for the First Three Quarters of FY2019
   • Increase in revenue and income compared with the same period of the previous year
     due in part to increase in number of condominium sales posted in the residence
     business and increase in property sales to investors in the commercial properties
     business.
   • No change in full-year earnings forecast from the figures announced at the beginning of
     the period as all businesses are performing well. Steady progress is being made
     toward achieving operating income of ¥50.0 billion, the goal of the medium-term
     business plan.

    Topics
   • Urban development plan for “Urban Redevelopment Project for Yaesu 1-Chome North
     Area” decided.
   • Decided on “T-LOGI” as the brand name for Tokyo Tatemono logistics facilities.
     Secured new development project in Narashino City, Chiba Prefecture.
   • Opened urban compact commercial facility “FUNDES Gotanda” in August and urban
     hotel “Candeo Hotels Omiya” in October.

                                Copyright © Tokyo Tatemono Co., Ltd All Rights Reserved.       3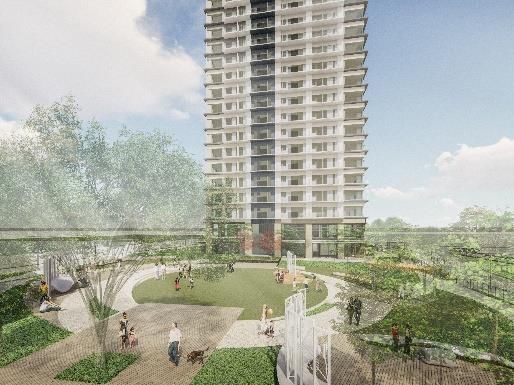
Consolidated Statement of Income for the First Three Quarters of FY2019
 •     Revenue and income increased compared with the same period in the previous year due to increase in the number of
       condominium sales posted in the residence business and increase in property sales to investors in the commercial properties
       business and other factors.
 •     Each business is making steady progress in line with the full-year earnings forecast announced at the beginning of the period.

                                              2018/9      2019/9      Increase/                                                                        2019/12 Achievement
             Unit: Billion yen
                                              Actual      Actual      Decrease
                                                                                             Main factors for increase/decrease
                                                                                                                                                      Forecasts    rate
Revenue from operations                         193.5       246.1          52.6                                                                          330.0        75%

 Commercial properties                           80.2        93.7          13.4                                                                          126.0        74%

 Residence                                       61.8        96.9          35.0                                                                          129.0        75%

 Real estate service                             33.6        35.2           1.6    ・Revenue from operations; Operating income                             50.0        71%
                                                                                    Revenue and income increased compared with the same
 Other                                           17.7        20.1           2.4     period in the previous year due to increase in the number of          25.0        81%
                                                                                    condominium sales posted in the residence business and
Operating income                                 36.5        41.5           5.0     increase in property sales to investors in the commercial             50.0        83%
                                                                                    properties business and other factors.
 Commercial properties                           24.8        27.9           3.0                                                                           36.5        76%

 Residence                                       11.7        12.7           0.9                                                                           15.0        85%

 Real estate service                              5.4         5.7           0.3                                                                            5.5       105%

 Other                                            0.1         1.5           1.4                                                                            0.5       305%

 Elimination/Corporate                            (5.6)       (6.3)        (0.6)                                                                           (7.5)      84%

Non-operating income                              3.5         2.9          (0.5)                                                                           3.0       100%

 Gain/loss on equity-method investments           0.8         (0.3)        (1.1)   Increase in the development costs in the overseas business
                                                                                   Increase in fee associated with issuance of hybrid bonds and
Non-operating expenses                            6.2         7.9           1.6                                                                           10.0        80%
                                                                                   increase in interest expense
 Interest expense                                 4.5         5.1           0.6

Recurring income                                 33.8        36.6           2.8                                                                           43.0        85%
                                                                                   Posting of gain on liquidation and gain on sale of equity in the
Extraordinary income                              0.6         1.5           0.8                                                                            1.0       154%
                                                                                   overseas business
Extraordinary loss                                0.0         0.6           0.5    Posting of impairment loss, etc.                                           -           -

Income before tax                                34.4        37.5           3.1                                                                           44.0        85%

Profit attributable to owners of the parent      23.7        24.9           1.2                                                                           28.0        89%

                                                            Copyright © Tokyo Tatemono Co., Ltd All Rights Reserved.                                                  4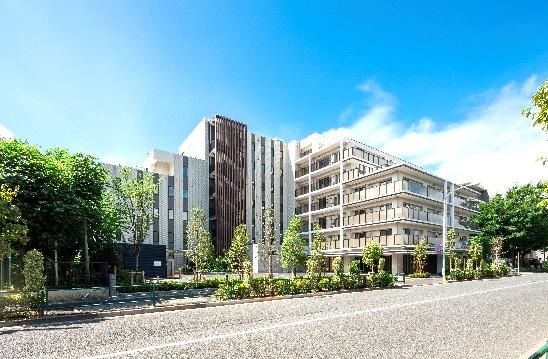
Consolidated Balance Sheet for the First Three Quarters of FY2019
 •      Increase in total assets by ¥96.6 billion due to issuance of hybrid bonds, acquisition of fixed assets (DNP Gotanda Building,
        Tokyo Tatemono Kyobashi Building, etc.) and acquisition of real estate for sale (land for development of for-sale condominiums,
        logistics facilities, hotel development projects, etc.) and other factors.
                                                       2018/12-end                       Increase/
                    Unit: Billion yen                              2019/6-end                                                           Main factors for increase/decrease
                                                            *1                           Decrease

Total assets                                                1,450.0         1,546.7             96.6
     Current assets                                           353.3           397.8             44.4     •   Cash and deposits
                                                                                                             Increase due to amount procured from issuance of hybrid bonds being paid in and other
         Cash and deposits                                     31.7             49.6            17.9         factors
                                                                                                         •   Real estate for sale
         Real estate for sale                                 283.4           306.5             23.1         Increase due to acquisition of land for development of for-sale condominiums, logistics
         Other current assets                                  38.2             41.5             3.3         facilities, hotels, etc. and other factors

     Fixed assets                                           1,096.7         1,148.9             52.1     •   Property and equipment
                                                                                                             Increase due to acquisition of DNP Gotanda Building, Tokyo Tatemono Kyobashi Building
         Property and equipment                               772.8           813.7             40.9         and buildings for redevelopment, and expenditure of construction costs of Toshima Project
                                                                                                             and other factors
         Intangible assets                                    110.4           113.5              3.1     •   Investments and other assets
                                                                                                             Increase due to fair value of investment securities and other factors
         Investments and other assets                         213.5           221.6              8.1
Total liabilities                                           1,093.5         1,177.3             83.8
                                                                                                         •   Interest-bearing debt
     Interest-bearing debt                                    857.1           945.0             87.8         Increase due to issuance of hybrid bonds and other factors
     Other liabilities                                        236.3           232.3             (4.0)
Total net assets                                              356.5           369.3             12.8
                                                                                                         •   Shareholders’ equity
     Shareholder’s equity                                     266.4           273.2              6.8         Profit attributable to owners of the parent: +¥24.9 billion
                                                                                                             Dividends paid: -¥8.0 billion
     Accumulated other comprehensive income                    81.7             87.0             5.3         Acquisition of treasury stock: -¥9.9 billion
     Non-controlling interests                                   8.4             9.0             0.5

Capital adequacy ratio                                       24.0%           23.3%             (0.7P)
Debt equity ratio *1                                             2.5             2.6             0.2
Interest-bearing debt / EBITDA multiple *2                     12.7                 -               -

*1: From FY2019, the Company has applied “Partial Amendments to Accounting Standard for Tax Effect Accounting,” etc. The figures for the end of December 2018 are the figures after retrospective application of the
    concerned accounting standard, etc.
*2: Debt equity ratio = Interest-bearing debt / Equity capital
*3: Interest-bearing debt / EBITDA multiple = Interest-bearing debt / (Operating income + Interest & dividend income + Gain/loss on equity-method investments + Depreciation expense + Goodwill amortization expense)
                                                                       Copyright © Tokyo Tatemono Co., Ltd All Rights Reserved.                                                                       5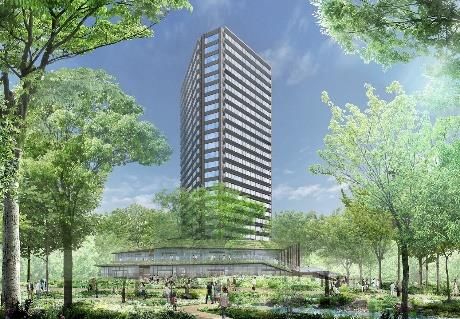
Consolidated Balance Sheet for the First Three Quarters of FY2019
Breakdown of Property and Breakdown of
Equipment and Intangible Assets Total assets: ¥1,546.7 billion Interest-Bearing Debt
Real estate service Current assets 397.8 Liabilities 1,177.3
¥17.9 billion 2% Other
Cash and deposits 49.6 Interest-bearing debt 945.0
Residence ¥2.8 billion 0%
Other
¥23.0 billion 3% Real estate for sale 306.5 Loans payable 627.1
¥38.1 billion 4%
Real estate for sale 119.0 Bonds payable 225.0 Commercial paper
¥90.0 billion 10%
Real estate for sale in progress 106.9 Commercial paper 90.0
Real estate for development 80.6 Other 2.8
Other current assets 41.5 Other liabilities 232.3 Bonds payable
Fixed assets 1,148.9 ¥225.0 billion
24%
Property and equipment 813.7 Loans payable
Commercial properties ¥627.1 billion
Intangible assets 113.5
¥848.0 billion 91% Including ¥80.0 billion
procured from hybrid
66%
Investments and other assets 221.6 Net assets 369.3 bonds in 2019
Shareholders’ equity 273.2
Including ¥28.0 billion
Accumulated other procured from a hybrid
comprehensive income 87.0
loan in 2017
Non-controlling interests 9.0
Breakdown of Real Estate for Sale Status of Debt Equity Ratio
Other ¥3.5 billion 1% End of September 2019
Take hybrid into
Real estate for Real estate service account *3
development ¥47.5 billion 16%
Commercial properties Debt equity ratio *1 2.6 times 2.2 times
(land)
Real estate for sale ¥93.3 billion 30%
¥80.6 billion 26%
(completed) Net debt equity ratio *2 2.5 times 2.0 times
¥119.0 billion 39%
Real estate for sale Residence *1 Debt equity ratio = Interest-bearing debt / Equity capital
¥162.0 billion 53% *2 Net debt equity ratio = (Interest-bearing debt - Cash and deposits) /
in progress Equity capital
(underway) *3 Calculated by taking into account the total equity credit of ¥54.0 billion
¥106.9 billion 35% concerning ¥108.0 billion of the total amount procured from the hybrid
loan and hybrid bonds
Copyright © Tokyo Tatemono Co., Ltd All Rights Reserved. 6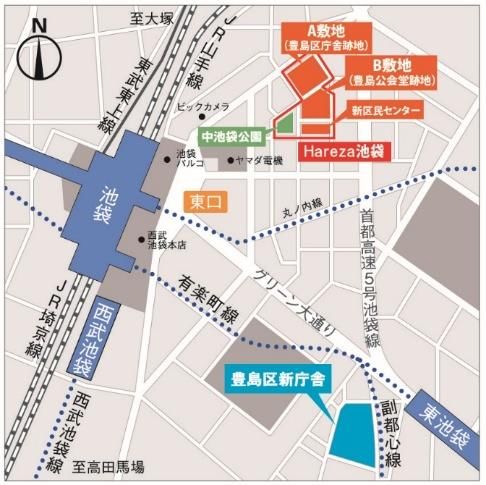
Balance of Real Estate for Sale
 •      Accumulating investment while increasing profit from property sales business under the current medium-term business plan, the
        balance of real estate for sale increased to ¥306.5 billion.
 •      Stock of properties for sale to investors expanded to approximately ¥255 billion in terms of total investment amount, and land
        bank for for-sale condominiums, too, steadily accumulated to increase to approximately 9,000 units.

     (Billion yen)                                                                                                                                        Property sales to investors
                                                                                                                                             (commercial properties, for-rent condominiums, real estate service, other)
          350
                                                                                                   306.5                                   ◆ Balance of real estate for sale:
                                                                                                     3.5    Other                            ¥ 172.5 billion
          300                                                                          283.4                                                 (up ¥19.6 billion from the end of 2018)
                                                                                          3.6               Real estate
                                                                                                    47.5    service                        ◆ Total investment amount* (based on decisions made):
          250                                                                            43.5                                                Approx. ¥255 billion
                                                                                                            For-rent
                                                                             221.9                  28.0    condominiums                     (up ¥50 billion from the end of 2018)
                                                                               3.7       20.4
                                                                                                                                           [Projects decided to be acquired during this fiscal year]
          200                                                                 35.7                                                             3 urban hotels, 3 logistics facilities and 21 under asset
                                                                               1.7                  93.3    Commercial
                                                                                         85.2                                                  solution business
                                                      153.7 147.1                                           properties

          150                                                                 55.4                                                         [Projects already sold during this fiscal year]
                                          112.8                    27.7                                                                        FUNDES Ueno, FUNDES Jimbocho, KY Kojimachi
                               101.2                                1.7                                                                        Building and 29 under asset solution business
          100        89.1                                          24.6

                                                                                        130.6      134.0    For-sale
                                                                             125.3                          condominiums, etc.                          For-sale condominiums, etc.
            50                                                     92.9

                                                                                                                                           ◆ Balance of real estate for sale:
              0                                                                                                                              ¥ 134 billion
                    2012/12 2013/12 2014/12 2015/12 2016/12 2017/12 2018/12                        2019/9                                    (up ¥3.4 billion from the end of 2018)
                                                                                                                                           ◆ Land bank
                                           As of the end of 2018:                                                                            (including 1,300 units scheduled to be posted in 2019):
                            Transfer from fixed assets to real estate for sale of            Of which, ¥119 billion (39%)                    Approx. 9,000 units
                            commercial properties and for-rent condominiums                       already completed                          (up 1,800 units from the end of 2018)
                                     totaling approximately ¥35 billion

* Calculated by aggregating total investment amount, in which construction costs, etc. that arise after the acquisition are added to the book value of each property at the time of acquisition.

                                                                           Copyright © Tokyo Tatemono Co., Ltd All Rights Reserved.                                                                                       7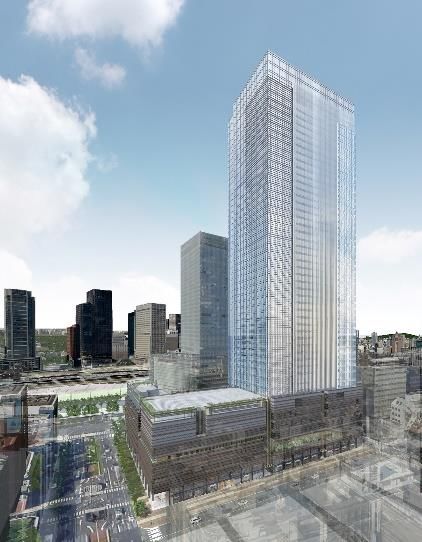
Full-Year Earnings Forecast for FY2019
 •     Outlook is increase in revenue and income due to increase in property sales to investors in the commercial properties business
       and the real estate service business and increase in the number of condominium sales posted and other factors.

                                              2018/12       2019/12      Increase/
             Unit: Billion yen                                                                                         Main factors for increase/decrease
                                               Actual      Forecasts     Decrease
Revenue from operations                          273.3         330.0           56.6
                                                                                        •
                                                                                            Revenue from operations
     Commercial properties                       108.6         126.0           17.3         Significant increase in revenue due to increase in number of condominium sales posted in the
                                                                                            residence business and increase in property sales to investors in the commercial properties
     Residence                                    97.7         129.0           31.2         business and the real estate service business and other factors
     Real estate service                          42.8          50.0            7.1

     Other                                        24.0          25.0            0.9

Operating income                                  46.7          50.0            3.2
                                                                                        •
                                                                                            Operating income
     Commercial properties                        33.3          36.5            3.1         Increase in income due to increase in property sales to investors and increase in leasing income
                                                                                            in the commercial properties business, and increase in number of condominium sales posted in
     Residence                                    14.1          15.0            0.8         the residence business and other factors
     Real estate service                           6.3            5.5           (0.8)

     Other                                         0.1            0.5           0.3

     Elimination/Corporate                         (7.3)         (7.5)          (0.1)

Non-operating income                               3.5            3.0           (0.5)   Decrease in gain on equity-method investments in the overseas business, etc.

Non-operating expenses                             8.3          10.0            1.6     Increase in financing costs associated with implementation of hybrid financing, etc.

Recurring income                                  42.0          43.0            0.9

Extraordinary income                               0.7            1.0           0.2

Extraordinary loss                                 2.6              -           (2.6)

Income before tax                                 40.1          44.0            3.8

Profit attributable to owners of the parent       27.2          28.0            0.7

Cash flows from operating activities              19.7           (5.0)   Estimated amount of investment in real estate for sale: Approx. ¥155.0 billion
                                                                                                                                                                        On August 2,
                                                                         Estimated amount of investment in fixed assets: Approx. ¥65.0 billion                          revised from the
Cash flows from investing activities              (63.5)        (70.0)   (Of which, capital investment: Approx. ¥55.0 billion)                                          budget at beginning
                                                                                                                                                                        of period.
Cash flows from financing activities              34.4          75.0     Forecast balance of interest-bearing debt at end of period: Approx. ¥950.0 billion

                                                              Copyright © Tokyo Tatemono Co., Ltd All Rights Reserved.                                                                8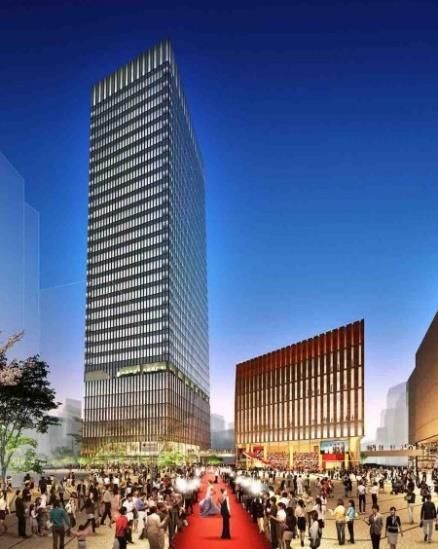
Medium-Term Business Plan Progress Report
    •        Steady progress is being made toward operating income of ¥50.0 billion, the goal of the medium-term business plan.

                                                      Previous plan                                                                 Current plan
                                                                                                                                                                                50.0                 50.0
                                                                                                                                        44.7                46.7
                                                                                                                                                                                  6.0                 7.0
                                                                                                                                          3.2                 6.4
                                                                                                34.4                36.3
                                        30.8                                30.5                                                                                                 15.0
                                                        29.3                                     3.0                  5.2                16.7                14.1                                     15.0
■Other                                   2.8
 (Real estate service & Other)                            3.6                 3.9                                     6.2
                                         0.9                                  3.7                10.4
                                                          7.6
■Residence

■Commercial properties                                                                                                                                                           36.5                 34.0
                                         33.1                                29.4                                    31.0                31.9                33.3
                                                         25.4                                    27.2
■Elimination/Corporate

                                         -6.1             -7.4               -6.5                -6.2                -6.2                -7.2                -7.3                -7.5                 -6.0
                                                                                                                                                                                                   (Reference)
                                        FY2012          FY2013              FY2014              FY2015              FY2016              FY2017              FY2018             FY2019           FY2019 forecasts
                                        (Actual)        (Actual)            (Actual)            (Actual)            (Actual)            (Actual)            (Actual)          (Forecast)     announced in Feb. 2017
          Operating income            ¥30.8 billion   ¥29.3 billion       ¥30.5 billion       ¥34.4 billion       ¥36.3 billion      ¥44.7 billion       ¥46.7 billion       ¥50.0 billion        ¥50.0 billion
                         Profit       ¥10.2 billion   ¥10.1 billion       ¥82.9 billion       ¥16.3 billion       ¥19.7 billion      ¥22.5 billion       ¥27.2 billion       ¥28.0 billion        ¥23.0 billion
                                 *1
                   EBITDA             ¥41.2 billion   ¥39.8 billion       ¥47.0 billion       ¥52.6 billion       ¥55.9 billion      ¥65.1 billion       ¥67.7 billion              -                   -
                                 *2
     Dividend per share                  ¥10.0            ¥10.0              ¥12.0               ¥20.0               ¥26.0               ¥30.0               ¥35.0               ¥38.0                  -
                 Payout ratio            21.0%           21.2%                3.1%               26.3%               28.6%               28.8%               27.8%               28.6%                  -
            Debt equity ratio             2.3x            1.7x                2.6x                2.3x                2.3x                2.4x                2.5x            About 2.5x           Within 3x
   Net debt equity ratio *3               2.1x            1.5x                2.3x                2.2x                2.1x                2.2x                2.4x                  -                   -
   Interest-bearing debt /
         EBITDA multiple                 11.6x            10.9x               15.9x              13.4x               13.0x               12.5x               12.7x           About 13.0x           Within 13x
                                 *4
                       ROA               3.7%             3.5%                2.3%                2.8%                3.1%                3.6%               3.5%                   -                   -
                                 *5
                       ROE               5.3%             4.4%               33.2%                5.6%                6.4%                6.8%               7.9%                   -                   -

  *1:   EBITDA = Operating income + Interest & dividend income + Gain on equity-method investments + Depreciation expense + Goodwill amortization expense
  *2:   A 1-for-2 reverse stock split was implemented on July 1, 2015. The dividend shown for 2012 to 2015 is the annual dividend per share after factoring in the reverse stock split.
  *3:   Net debt equity ratio = (Interest-bearing debt - Cash and deposits) / Equity capital
  *4:   ROA = (Operating income + Non-operating income) / Average of total assets at beginning of period and total assets at end of period
  *5:   ROE = Profit attributable to owners of the parent / Average of equity capital at beginning of period and equity capital at end of period
                                                                              Copyright © Tokyo Tatemono Co., Ltd All Rights Reserved.                                                                      9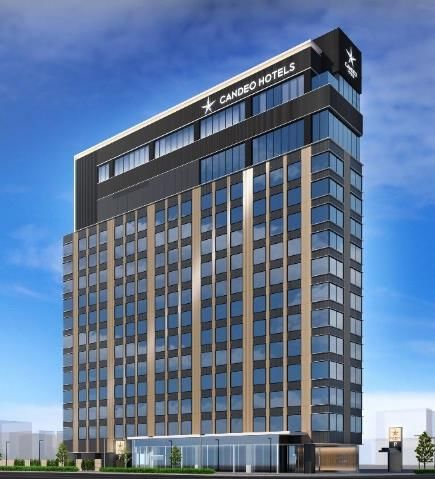
Shareholder Returns (No change from the announcement in Feb. 2019)
 •        For FY2019, annual dividend is estimated to increase by ¥3.0 per share from ¥35.0 per share in the previous fiscal year to
          ¥38.0 per share (payout ratio of 28.6%), and forecasted to achieve a sixth consecutive year of dividend increase.

                                                                                                                                                       Plan is for a sixth consecutive year of
                                                                                                                            dividend increase with income growth
                             (¥)
                             40                                                                                                                                                       38.0
                                                     ■Interim dividend                                                                                       35.0
                                                     ■Year-end dividend                                                                   30.0
                             30                                                                                      *2 26.0
                                                                                                                                                                                      19.0
                                                                                                                                                             19.0
                                                                                                  *1 20.0
                                                                                                                                          16.0                      Forecast at
                             20                                                                                       14.0
                                                                                                                                                                    beginning of
                                                                                                                                                                      period
                                                                                *1 12.0                                                                                ¥32.0
                                          *1 10.0           *1 10.0                                12.0
                             10                                                   6.0                                                                                                 19.0
                                                                                                                                          14.0               16.0
                                           10.0              10.0                                                     12.0
                                                                                  6.0               8.0
                               0
                                          FY2012
                                             1              FY2013
                                                               2                FY2014
                                                                                   3              FY2015
                                                                                                     4               FY2016
                                                                                                                        5               FY2017
                                                                                                                                           6                 FY2018
                                                                                                                                                               7                    FY2019
                                                                                                                                                                                       8
                                          (Actual)          (Actual)            (Actual)          (Actual)           (Actual)           (Actual)            (Forecast)             (Forecast)
     Profit attributable to owners
                      of the parent     ¥10.2 billion     ¥10.1 billion       ¥82.9 billion     ¥16.3 billion      ¥19.7 billion      ¥22.5 billion        ¥27.2 billion           ¥28.0 billion

                  Profit per share        ¥23.79            ¥23.55              ¥193.12           ¥75.91              ¥91.00            ¥104.17              ¥125.79                 ¥133.05

      Consolidated payout ratio            21.0%             21.2%               3.1%              26.3%              28.6%              28.8%                27.8%                   28.6%

Consolidated total return ratio            21.0%             21.2%               3.1%              26.3%              28.6%              28.8%                27.8%                   64.3%
                                   *1
 Stock price at end of period              ¥878             ¥2,336              ¥1,762            ¥1,323              ¥1,563             ¥1,522               ¥1,140                     -
                                   *3
                 Dividend yield            1.1%              0.4%                0.7%              1.5%                1.7%               2.0%                 3.1%                      -

       Shareholder returns policy
         The Company’s basic policy for distribution of profits is to make efforts to maintain and enhance stable distribution levels by comprehensively taking into
         account future management environment, business development, changes in business results, etc. while building internal reserve for reinvestment
         toward enhancement of corporate value. In addition, the Company sets a target payout ratio of about 30%.

*1: A 1-for-2 reverse stock split was implemented on July 1, 2015. The figures for 2012 to 2015 are calculated by factoring in the reverse stock split.
*2: The interim and year-end per-share dividend for FY2016 both include a ¥2 commemorative dividend to celebrate the 120th anniversary of the company’s founding.
*3: Dividend yield is calculated based on the closing price at the end of that period.
                                                                          Copyright © Tokyo Tatemono Co., Ltd All Rights Reserved.                                                                 10
Vision in 2020 Onwards - Philosophy of Business Portfolio
• The business portfolio is classified into three businesses namely “stock business,” “property sales business” and “light
asset/non-asset business” in accordance with business characteristics. Promote management that takes profitability,
effectiveness and stability into account by focusing on balance among the three businesses.
Three Classifications in Accordance with Business Characteristics
Stock business Property sales business Light asset / non-asset business
Commercial Commercial facility, hotel,
Office Management
Property logistics facility, medium-size office
Business segment
For-sale condominium,
Rental apartment
Residence Rental apartment Management
(large-scale)
(compact)
Real estate Brokerage, Management service,
- Asset Solution
service Parking lot
Leisure, Senior & Child Care,
Other - Overseas
Asset Management
Highly stable revenue High asset efficiency Most of the assets are not used
Operate based on comprehensive consideration on balance among profitability,
effectiveness and stability
Copyright © Tokyo Tatemono Co., Ltd All Rights Reserved. 11Vision in 2020 Onwards - Image of Future Growth
• Stably expand property sales business with relatively high volatility by acquiring overall balance.
• Expand centering on property sales business through 2024 and aim for further expansion with completion of several large-scale
redevelopments in 2025 and after.
(Billion yen)
Post ¥5.3 2020 – 2024 2025 onward
600
60
billion by Q3
50.0
500
50 46.7 Expansion through
44.7 Stock Stable growth centered on
6.5 completion of large-scale
4.0 business internal growth
1.0 redevelopments
400
40 36.3 20.5
34.4 18.1
17.7 14.0
16.7 14.1
2.0 5.0 11.2
12.4 Proactive expansion through
30
300 Property sales Stable growth through
10.4 6.2 return of existing stocks and
business continuous investments
continuous investments
20
200
27.0 28.6 29.5
25.1 Light asset /
10
100 22.0 Stable growth by focusing on strong areas and value
non-asset
enhancement of existing facilities
business
00
2015/12 2016/12 2017/12 2018/12 2019/12
(Forecast)
■Total gross profit of property sales to investors (including gross profit of rental
apartment sales to investors)
■Operating income of the residence business segment (excluding gross profit of
rental apartment sales to investors)
2020 ◆ Property sales business will lead the overall profit growth
■Profit contribution amount from property sales business
| ◆ Capital efficiency will improve by heightening asset turnover rate
■Other (excluding profit contribution amount owing to property sales business from 2024
corporate operating income) ◆ Expand internal reserves for future capital needs
◆ Profit level will be raised by sequential completion of several
◆ Property sales business with relatively high volatility will be expanded stably
large-scale redevelopments
by acquiring overall balance among segments 2025
◆ Also aim for continuous growth of property sales business as
◆ Stock for property sales to investors has expanded steadily as for-sale onward
well as light asset/non-asset business by taking capital
condominiums in prime central Tokyo locations sold well
efficiency into consideration
Copyright © Tokyo Tatemono Co., Ltd All Rights Reserved. 12Vision in 2020 Onwards - Image of Financial Strategies
• Work is in progress to establish the next medium-term business plan, which is scheduled to be announced in February 2020
when the financial results for the fiscal year ending December 31, 2019, will be announced.
• Image of figures in around 2024 under the current simulation is as follows. The aim is to expand financing capacity by steadily
accumulating internal reserves while increasing capital efficiency by focusing on property sales business and thus fund large-
scale redevelopments.
EBITDA ¥80-90 billion Invest in Expand
Profit EBITDA is estimated to be the indicator of profits as overseas property sales financing
growth businesses whose profits are recorded as gain on equity-method business and capacity
investments will grow large-scale
redevelopments
Debt equity
ratio
About
Capital ROE of 8% or more 2.5 times
efficiency Increasing ROE through the expansion of property sales business Liabilities
Asset
Equity credit: 50% Expand internal
(¥54.0 billion) reserves
Hybrid finance
¥108.0 billion*
Maintaining debt equity ratio Posted under liabilities Net Expand by accumulating internal reserves
Financial in accounting through profit generation and hybrid finance
balance
Maintaining financial soundness in preparation for future demand assets
for funds including Yaesu Redevelopment Project
◆ Steadily accumulate internal reserves by heightening capital efficiency through
Stable dividends based on a target payout ratio focus on property sales business from 2020 to 2024
Shareholder of about 30% ◆ Hybrid finance contributes to expansion of equity as 50% equity credit is
returns Having a basic policy of increasing the amount of dividends granted
through profit growth
◆ Financing capacity will be expanded by accumulating internal reserves
and utilizing hybrid finance and will thus fund large-scale redevelopments
* Calculated by adding the ¥28.0 billion procured from a hybrid loan in 2017 (equity credit: ¥14.0 billion) to the ¥80.0 billion procured from hybrid bonds in March 2019 (equity credit: ¥40.0 billion)
Copyright © Tokyo Tatemono Co., Ltd All Rights Reserved. 13Business Results by Segment
Copyright © Tokyo Tatemono Co., Ltd All Rights Reserved. 14(1) Commercial Properties Business:
First Three Quarters of FY2019 Results & Full-year Forecasts
• First three quarters of FY2019: Increase in revenue and income due to increase in property sales to investors and solid growth
of building leasing revenue and building management service and other factors.
• Full year: Outlook is increase in revenue and income due to increase in property sales to investors and increase in building
leasing revenue and other factors.
2018/9 2019/9 Increase/ 2019/12 Achievement
Unit: Billion yen Main factors for increase/decrease
Actual Actual Decrease Forecasts rate
Revenue from operations 80.2 93.7 13.4 126.0 74%
New operations +¥0.4 billion; Full-year operations +¥0.5 billion;
Leasing of buildings 53.1 54.6 1.5 Sale, reconstruction, etc. -¥0.2 billion; Existing buildings: +¥0.7 billion 72.0 76%
Sales of real estate Net sales from property sales to investors +¥10.4 billion 69%
1.8 12.3 10.4 18.0
(First three quarters of FY2018: ¥1.8 billion; First three quarters of FY2019: ¥12.3 billion)
Building management service, etc. 24.8 26.3 1.4 Increase in construction sales, etc. 35.5 74%
Dividends 0.4 0.4 0.0 0.5 88%
Gross profit from property sales to investors +¥2.3 billion
Operating income 24.8 27.9 3.0 (First three quarters of FY2018: ¥0.4 billion; First three quarters of FY2019 : ¥2.7 billion) 36.5 76%
2018/12 2019/12 Increase/
Unit: Billion yen Main factors for increase/decrease
Actual Forecasts Decrease
Revenue from operations 108.6 126.0 17.3
New operations +¥0.6 billion; Full-year operations +¥0.5 billion;
Leasing of buildings 71.0 72.0 0.9 Sale, reconstruction, etc. -¥0.8 billion; Existing buildings; +¥0.7 billion
Sales of real estate Net sales from property sales to investors +¥16.1 billion
1.8 18.0 16.1
(FY2018: ¥1.8 billion; FY2019: About ¥18.0 billion)
Building management service, etc. 35.1 35.5 0.3
Dividends 0.5 0.5 (0.0)
Gross profit from property sales to investors +¥2.6 billion
Operating income 33.3 36.5 3.1 (FY2018: ¥0.4 billion; FY2019: About ¥3.0 billion)
New and full-year operations
・2019 new operations: Urban hotel (Midosuji) (completed in February 2019 ); Tokyo Tatemono Brillia HALL (Hareza Ikebukuro hall building) (completed in April 2019 );
Tokyo Tatemono Kyobashi Building (acquired in June 2019 ); Urban hotel (Omiya) (completed in September 2019 );
DNP Gotanda Building (acquired in September 2019 )
・2019 full-year operations: Building for redevelopment (1 building ); TENJIN249 (completed in July 2018); Urban hotel (Ginza and Asakusa) (completed in September 2018)
* New operations: Impact of increase in revenue attributable to the buildings that were completed or acquired in the fiscal year under review;
Full-year operations: Impact of increase in revenue attributable to the buildings that were completed or acquired in the previous fiscal period contributing to full-year operations:
Sale, reconstruction, etc.: Impact of decrease in revenue attributable to decrease in buildings in operation due to sale, reconstruction, etc.;
Existing buildings: Total amount of the effects of rent revisions, end of rent-free periods, occupancy rate changes, etc. at buildings other than those of new operations, full-year operations and sale, reconstruction, etc.
Copyright © Tokyo Tatemono Co., Ltd All Rights Reserved. 15(1) Commercial Properties Business:
Office Building Portfolio
• With an extremely bullish office market, average rent rose to ¥30,470 per tsubo and occupancy rate remained close to full
occupancy at 98.9% at the end of September.
Number of (Yen/tsubo)
At end of September 2019 Rentable space 98.6% 98.8% 98.9%
buildings 32,000 97.8% 97.8% 97.8% 98.4% 100%
Owned office buildings *1 *2 48 495,613 m² 30,293 30,361 30,405 30,470
30,037 29,870 29,882
30,000
Subleased buildings ー 98,223 m²
90%
Commercial facilities, buildings
ー 199,658 m² 28,000
for redevelopment, etc.
Commercial properties
ー 793,494 m²
business’ total rentable space 26,000 80%
2018/3 2018/6 2018/9 2018/12 2019/3 2019/6 2019/9
Tokyo metropolitan area
(excluding 23 wards)
Less than 300 tsubo 1,000 tsubo and over Other
2.6%
20.7% 20.1% 30 years and older 17.5%
28.3%
Under 10 years old 3 central wards of Tokyo
23 wards (excluding
300–500 tsubo 46.3% 43.5%
5 central wards) of Tokyo
20.9% 500–1,000 tsubo 20–30 years old
18.6%
38.2% 9.4%
10–20 years old Shibuya & Shinjuku wards
Average building age *3
16.0% 18 years old 17.8%
*1: The definition for the subject of calculation of the number of owned office buildings, average rent and occupancy rate has been changed, effective from the 1Q of FY2019.
For details of the standards change, please refer to the note on page 40.
*2: “DNP Gotanda Building,” which was delivered at the end of September 2019, is not included in “Owned office buildings” nor in areas subject to calculation of average rent, occupancy rate and breakdown of rentable space.
*3: The weighted average based on rentable space.
Copyright © Tokyo Tatemono Co., Ltd All Rights Reserved. 16(1) Commercial Properties Business:
Office Building Portfolio
• Acquired “Tokyo Tatemono Kyobashi Building” and “DNP Gotanda Building” for expanding the portfolio and strengthening the
revenue base.
• Promotion of leasing up “Hareza Tower” underway toward construction completion of the office building in 2020.
Tokyo Tatemono Kyobashi Building Hareza Tower (Area name: Hareza Ikebukuro)
⚫ Acquired at the end of June through mutual ⚫ Complex development on the former Toshima Ward Office site under cooperation with
transaction with JPR the government
⚫ Owned as a fixed asset by eyeing future opportunities ⚫ Construct more theaters, including a cinema complex, and commercial facilities
such as reconstruction
⇒ Completed construction of the hall building
[Location] 3-6-18 Kyobashi, Chuo-ku, Tokyo (Facility name: Tokyo Tatemono Brillia HALL)
[Access] 1-minute walk from Kyobashi Station on the Tokyo Metro Leasing of office tower is performing steadily, progressing for over 60% of space when
Ginza Line
2-minute walk from Takaracho Station on the Toei
including those with high probability for contract conclusion while receiving many inquiries.
Asakusa Line
3-minute walk from Ginza-itchome Station on the Tokyo
Metro Yurakucho Line [Total floor space] New hall building : about 10,700 m²
[Total area] 547.10 m² Office building : about 68,600 m²
[Total floor space] 4,419.79 m² [Total area] New hall building : 2,983.59 m²
[No. of floors] 10 floors above ground, 1 below Office building : 3,619.67 m²
[Completion date] January 1981 [Construction start] December 2016
Exterior [Completion date] New hall building : April 2019
Office building : May 2020 (planned)
DNP Gotanda Building Site A (site of former
Toshima Ward Office)
⚫ Policy is to own over the medium to long term as a fixed Site B (site of former
Toshima Ward Office)
asset for expanding the portfolio and strengthening the New center for ward
Naka-
revenue base citizens
Ikebukuro
Park
⚫ Acquired at the end of September and the former owner Hareza Ikebukuro
to continue to occupy for some time
East Gate
[Location] 3-5-20 Nishi-Gotanda, Shinagawa-ku, Tokyo
[Access] 6-minute walk from Gotanda Station on the JR Yamanote
Line and Toei Asakusa Line
10-minute walk from Meguro Station on the JR Yamanote
Line, Toei Mita Line and other lines
[Total area] 8,225.49 m² New Toshima
[Total floor space] 48,063.31 m² Ward Office
[No. of floors] 25 floors above ground, 2 below, 1-story service tower
[Completion date] May 2006
East side exterior
Copyright © Tokyo Tatemono Co., Ltd All Rights Reserved. 17(1) Commercial Properties Business:
Map of Office Buildings Owned around Tokyo Station
FY of 1 16
Building construction
completion
1 The Otemachi Tower 2014 3 6
5
Otemachi Financial City Grand 4
2 Cube 2016
3 JA Building / Keidanren-Kaikan 2009 2 7
Otemachi Financial City North
4 Tower 2012
Tokyo Tatemono Muromachi
5 Building 1966 17 1 22
Urban Redevelopment Project
for Yaesu 1-Chome North Area
Tokyo Tatemono Dai3
6 Muromachi Building 1971 Nihonbashi 1-chome
23 1 and 2 block
Redevelopment
7 Nihonbashi TI Building 2012 2
Tokyo Tatemono
8 Nihonbashi Building 2015 10
9
9 Nihonbashi First Building 1994
21
Urban Redevelopment Project for
Yaesu 1-Chome East Area in Front of
8
Shin-Gofukubashi Building
Tokyo Station 11
10 1977
Tokyo Tatemono Yaesu
11 Building 2011 12
12 NTA Nihonbashi Building 1991 13
14
13
Tokyo Tatemono Headquarters
1929 19
Building
14 Yaesu MEG Building 1986 8
17 15
15 Kyobashi YS Building 1990
16 Empire Building 2017 18
16
17 Kyobashi Edogrand 2016
19
18 Fukuoka Building 1990 20
19 Tokyo Square Garden 2013
Tokyo Tatemono Kyobashi ★: Project with Tokyo Tatemono’s participation
20 Building 1981
★: Project with Tokyo Tatemono’s involvement
■ Construction completed in or before 2000
■ Construction completed between 2009 and 2014
■ Construction completed during period of medium-term business plan (2015-2019)
Copyright © Tokyo Tatemono Co., Ltd All Rights Reserved. 18(1) Commercial Properties Business:
Major Development Projects
• Urban development plan for “Urban Redevelopment Project for Yaesu 1-Chome North Area,” a redevelopment project that
includes Shin-Gofukubashi Building, decided in October 2019.
• In addition to the 3 projects around Tokyo Station, also participating in a total of 5 redevelopment projects in Chuo, Minato and
Shibuya wards, of which 3 have had preparation consortiums already formed.
Urban Redevelopment Project for Yaesu 1-Chome East Urban Redevelopment Project for
Area in Front of Tokyo Station Yaesu 1-Chome North Area
→ Map of Office Buildings Owned around Tokyo Station 21 → Map of Office Buildings Owned around Tokyo Station 22
⚫ Large redevelopment project in front of Tokyo Station, including Tokyo Tatemono ⚫ Establish a continuous waterfront promenade and pedestrian network in the area
Headquarters Building. along Nihonbashi River.
⚫ Construct a large bus terminal that connects Tokyo with international airports and ⚫ Form a financial hub serving to strengthen global competitive edge.
regional cities.
⚫ Introduce functions that will enhance Tokyo’s global competitive edge, including ⚫ Strengthen disaster preparedness and reduce environmental burden.
conference halls and medical facilities.
⇒ Urban development plan decided and designated as National Strategic Special
⇒ District B Urban Redevelopment Committee established in January 2019 Zone in October 2019
[Total floor space] District A: about 12,000 m² [Total floor space] South Block: about 180,500 m²
District B: about 229,800 m² North Block: about 1,000 m²
[Main uses] District A: offices, shops, etc. [Main uses] Offices, shops, lodging facility, parking lot, etc.
District B: offices, medical facilities, bus terminal, conference halls, etc. [No. of floors] South Block: 45 floors above ground, 5 below
[No. of floors] District A: 11 floors above ground, 3 below North Block: 2 floors above ground, 1 below
District B: 50 floors above ground, 4 below [Construction start] 2025 (planned)
[Construction start] 2021 (planned) [Completion date] South Block: Fiscal year 2030 (planned)
[Completion date] 2025 (planned) North Block: Fiscal year 2035 (planned)
Copyright © Tokyo Tatemono Co., Ltd All Rights Reserved. 19(1) Commercial Properties Business:
Initiatives for Property Sales to Investors
• Decided on “T-LOGI” as the brand name for logistics facilities. Secured new project in Narashino City, Chiba Prefecture.
• The balance of real estate for sale increased by ¥8.0 billion from the end of 2018 to ¥93.3 billion. The value of stock in terms of
total investment amount increased by approximately ¥35.0 billion from the end of 2018 to approximately ¥165.0 billion.
Construction
Area Property name Status
completed
(Billion yen)
Suidobashi FUNDES Suidobashi July 2015 Sold
100
1000 93.3
As of the end of 2018:
85.2 Jimbocho FUNDES Jimbocho Nov. 2016 Sold
Transfer from fixed assets of
80
800 slightly less than Ueno FUNDES Ueno July 2017 Sold
¥20.0 billion
Tenjin TENJIN249 July 2018 In operation
60
600 55.4 Gotanda FUNDES Gotanda July 2019 In operation
Ginza FUNDES Ginza Nov. 2019 Under development
400
40
24.6
Real estate for sale
200
20 (completed)
00
2016/12 2017/12 2018/12 2019/9
Total investment amount* (based on decisions made): approx. ¥165.0 billion
Assume average NOI yield at stable occupancy of around 5%
FUNDES Gotanda FUNDES Ginza
* Calculated by aggregating the total investment amount, in which construction costs, etc. that arise after
(Image of exterior)
the acquisition are added to the book value of each property at the time of acquisition.
Copyright © Tokyo Tatemono Co., Ltd All Rights Reserved. 20(1) Commercial Properties Business:
Initiatives for Property Sales to Investors
No. of Construction
Area Hotel name Status Property name Opening Status
guestrooms completed
Roppongi Candeo Hotels Tokyo Roppongi 149 Sept. 2017 In operation T-LOGI Kuki Jul. 2020 Under development
Ginza The Square Hotel Ginza 182 Aug. 2018 In operation Ayase Logistics Facility Project (provisional name) Spring 2022 To be acquired
Asakusa Hotel Gracery Asakusa 125 Sept. 2018 In operation Musashi Hikida Logistics Facility Project (provisional name) TBD To be acquired
Midosuji (1) the b Osaka Midosuji 306 Feb. 2019 In operation Yokohama Aoba Logistics Facility Project (provisional name) Spring 2022 Under development
Omiya Candeo Hotels Omiya 321 Aug. 2019 In operation Narashino Logistics Facility Project (provisional name) TBD To be acquired
Sanjo, Kyoto (1) TBD 122 Nov. 2019 Under development
Shijo, Kyoto TBD 106 Spring 2021 Under development
Sanjo, Kyoto (2) TBD TBD TBD Under development
Akihabara TBD TBD TBD Under development
Midosuji (2) TBD TBD TBD Under development
T-LOGI Kuki
(Image of exterior)
Construction
Property name Status
completed
Sendai Kakyoin Terrace Spring 2020 Under development
TBD (Area: in front of Sapporo Station) 2023 Under development
the b Osaka Midosuji Candeo Hotels Omiya
(Image of exterior) Sendai Kakyoin Terrace
(Image of exterior)
* Newly acquired projects are highlighted in red
Copyright © Tokyo Tatemono Co., Ltd All Rights Reserved. 21(2) Residence Business:
First Three Quarters of FY2019 Results & Full-Year Forecasts
• First three quarters of FY2019: Increase in revenue and income due to the number of condominium sales posted increasing
significantly from the same period of the previous fiscal year’s 493 units to 1,053 units and other factors.
• Full year: Outlook is increase in revenue and income due to increase in the number of condominium sales posted and plans to
sell for-rent condominiums.
2018/9 2019/9 Increase/ 2019/12 Achievement
Unit: Billion yen Main factors for increase/decrease
Actual Actual Decrease Forecasts rate
Revenue from operations 61.8 96.9 35.0 129.0 75%
Sales of condominiums 43.4 75.1 31.7 Number of condo sales posted: 1,053 units; Condo unit price: ¥71.40 million; 97.5 77%
Gross margin: 25.3%
Sales of residential houses 0.1 0.0 (0.0) - -
Increase in sold share in condo project, increase in sold renovated residence,
Sales of residential land, etc. 2.6 3.1 0.5 7.5 42%
etc.
House leasing 2.8 3.1 0.2 4.0 78%
Fee from sales agency services 0.6 0.7 0.0 1.0 78%
Building management service, etc. 12.0 14.6 2.5 Increase in construction sales, etc. 19.0 77%
Operating income 11.7 12.7 0.9 15.0 85%
2018/12 2019/12 Increase/
Unit: Billion yen Actual Forecasts Decrease
Main factors for increase/decrease
Revenue from operations 97.7 129.0 31.2
Sales of condominiums 72.6 97.5 24.8 Number of condo sales posted: 1,300 units; Condo unit price: ¥75.00 million;
Gross margin: 25.0%
Sales of residential houses 0.1 - (0.1)
Sales of residential land, etc. 2.9 7.5 4.5 Increase in sale of for-rent condominiums, etc.
House leasing 3.8 4.0 0.1
Fee from sales agency services 0.8 1.0 0.1
Building management service, etc. 17.3 19.0 1.6 Increase in building management service fee, etc.
Gross profit from sales of residential land, etc. +¥1.0 billion
Operating income 14.1 15.0 0.8 (FY2018: 0; FY2019: About ¥1.0 billion)
Copyright © Tokyo Tatemono Co., Ltd All Rights Reserved. 22(2) Residence Business:
For-Sale Condominiums – Main Operating Indicators
• Gross margin was lower than in the previous fiscal year, but posting of properties in prime central Tokyo locations continuing
into the fiscal year under review resulted in gross margin of a high level at 25.3% in the first three quarters of 2019.
• Inventory of completed condominiums decreased by 47 units from the end of Q2 centering on properties located in Tokyo
suburbs, and the inventory at the end of Q3 was 83 units.
Other Tokyo Kansai and others Kansai and others
metropolitan area 5.0% 5.9% FY2016 FY2017 FY2018 FY2019
8.9%
Tokyo
At beginning 69% 80% 77% 83%
Other Tokyo
excluding 23 wards
metropolitan area
4.1% At end of Q1 176% 88% 91% 90%
19.5%
At end of Q2 85% 93% 94% 95%
Tokyo
23 wards of Tokyo excluding 23 wards
82.0% 13.9% 23 wards of Tokyo At end of Q3 91% 99% 97% 100%
60.7%
1,300 units
Number of condo sales posted 700 units 971 units 988 units
(Plan)
First three quarters of First three quarters of
FY2018 FY2019
493 units posted 1,053 units posted
(Units) (Units)
1,500 40% ■Tokyo Of which,
33.3% 1,300 ■Tokyo metropolitan area contracted:
29.8% ■Kansai and others 17 units
30%
1,000 25.3%
20.9% 25.0%
971 988
20%
700 1,053
500
10%
0 0%
2016/12 2017/12 2018/12 2019/12
*Dotted line indicates
full-year forecast.
Copyright © Tokyo Tatemono Co., Ltd All Rights Reserved. 23(2) Residence Business:
For-Sale Condominiums – Main Property Sales Posting Schedule (1)
• Land bank increased by approximately 1,800 units from the beginning of period to approximately 9,000 units (including 1,300
units scheduled to be posted in 2019), partly due to redevelopment projects which materialization became highly likely being
transferred from “Yet to be incorporated into land bank” to “Incorporated into land bank” in addition to acquisition of land.
No. of condo sales
No. of units for
Main properties slated for completion to be posted by
sale*
Tokyo Tatemono
Brillia Tower Ueno Ikenohata 361 361
Completion in 2019
Brillia City Mitaka 437 306
Brillia Tower Hachioji 227 136
Brillia Tower Yoyogi Park CLASSY 196 127
Brillia Tower Yokohama Higashikanagawa 81 81
Brillia Ichibancho 106 64
Brillia Tower Takasaki ALPHA RESIDENCIA 222 100
To be completed in 2020
Brillia City Senri Tsukumodai 158 79
Brillia Ojima 127 127
Brillia Tower Yoyogi Park CLASSY Brillia Tower Ueno Ikenohata Brillia Ichibancho
Brillia Higashinakano Parkside Hills 98 59 (Image of exterior)
Brillia Urawa Nakacho 72 72
Brillia Tsurumaki 72 72
BrilliaTower Nishijin 307 246
Approx. 11,200 units Approx. 9,000 units
SHINTO CITY Approx. 1,400 Approx. 350
Yet to be incorporated Increased by
To be completed in 2021 or later
Kansai and others
Brillia Tower Seiseki Sakuragaoka Blooming into land bank approx. 1,800 units from
Residence (provisional name)
520 TBD 19.1%
Approx. 2,200 units the beginning of period
SHIROKANE The SKY 770 305
Minato Ward Kaigan 1-chome Reconstruction Project
TBD TBD
(Itohpia Hamarikyu Reconstruction Project) Other 23 wards of Tokyo
HARUMI FLAG ( Harumi 5-chome West District
Incorporated Tokyo metropolitan area 54.6%
Category 1 Urban Redevelopment Project)
4,145 489 into land bank 20.6%
Approx. 9,000 units
Dojima Tower Project (provisional name) TBD TBD
Shakujii Park Danchi Reconstruction Project TBD TBD Tokyo excluding 23 wards
Incorporated approx. 5.7%
Nishishinjuku 3-chome West District
TBD TBD 1,000 units from “Yet to be
Urban Redevelopment Project incorporated into land bank”
(Including 1,300 units scheduled to be posted in 2019)
* Of the total number of units including units for sale, the number of units excluding land right
holders’ residential units
Copyright © Tokyo Tatemono Co., Ltd All Rights Reserved. 24(2) Residence Business:
For-Sale Condominiums – Main Property Sales Posting Schedule (2)
• The plan is to continue posting sales of properties that attract great interest every fiscal year, such as large-scale tower
condominiums and large-scale redevelopment projects in central areas of regional cities, from 2020 onward.
To be
To be To be posted in To be
posted posted 2021 posted
and
in 2020 in 2021 2022 in 2022
Brillia Tower Takasaki BrilliaTower Nishijin SHINTO CITY Brillia Tower Seiseki Sakuragaoka
ALPHA RESIDENCIA Blooming Residence
To be To be To be
posted in To be
posted posted 2023 posted
in 2023 in 2023 and
2024 in 2029
Minato Ward Kaigan 1-chome SHIROKANE The SKY HARUMI FLAG Nishishinjuku 3-chome West District
Reconstruction Project Urban Redevelopment Project
(Itohpia Hamarikyu
Reconstruction Project)
Copyright © Tokyo Tatemono Co., Ltd All Rights Reserved. 25(2) Residence Business:
For-Rent Condominiums
• Landed 3 new projects for development of for-rent condominiums, expanding the balance of real estate for sale to ¥28 billion
and to approximately ¥40 billion in terms of total investment amount inclusive of construction costs at the end of September.
Total no. Construction
Property name Status
of units (to be) completed
(Billion yen) As of the end of 2018: Brillia ist Kitazawa KEYAKI 44 Aug. 2008 In operation
30.0
30
Transfer from fixed assets of 28.0 Brillia ist Nishiazabu Kasumicho 21 July 2008 In operation
slightly more than
Brillia ist Nakano Central Park Residence 17 May 2012 In operation
¥15.0 billion
Brillia ist Nakano Shinbashi 42 Apr. 2016 Sold
20.4 Brillia ist Ueno Okachimachi 33 Nov. 2017 In operation
20.0
20 Brillia ist Kiyosumi Shirakawa 47 Jan. 2018 In operation
Brillia ist Yotsuya Honshiocho 85 June 2018 In operation
CREAR PALETTE Kajigaya *2 127 Feb. 2019 In operation
10.0
10 Brillia ist Bunkyo Myogadani 43 Feb. 2019 In operation
Real estate for sale Brillia ist Sendagaya 149 May 2019 In operation
(completed) Nishigahara 1-chome Project (provisional
1.7 1.7 name)
75 Jan. 2020 Under development
Ebara Nakanobu Project (provisional name) 29 Jan. 2020 Under development
0.0
0
2016/12 2017/12 2018/12 2019/9 Ryogoku 1-chome Project (provisional name) 85 Mar. 2020 Under development
Akebonobashi Station Front Project
49 Apr. 2020 Under development
(provisional name)
Higashiueno Project (provisional name) *3 - July 2020 Under development
Taihei 4-chome Project (provisional name) 41 Oct. 2020 Under development
Motoasakusa 1-chome Project
49 Dec. 2020 Under development
(provisional name)
Akabane Iwabuchi Project (provisional name) 49 Feb. 2021 Under development
Total investment amount*1 (based on decisions made): approx. ¥40.0 billion
Shibuya Honmachi Project (provisional name) 47 Aug. 2022 Under development
Assume average NOI yield at stable occupancy of around 5% Ohashi 2-chome Project (provisional name) 200 Sept. 2023 Under development
Total no. Construction
Property name Status
of units (to be) completed
Brillia ist Shinonome Canal Court 423 Mar. 2005 In operation
Brillia ist Tower Kachidoki 536 Jan. 2011 In operation
*1: Calculated by aggregating the total investment amount, in which construction costs, etc. that arise Kita Aoyama 3-chome Urban Development Project
after the acquisition are added to the book value of each property at the time of acquisition. 229 May 2020 Under development
(provisional name)
*2: “CREAR PALETTE Kajigaya” is developed as student housing in light of the location characteristics HARUMI FLAG Approx.
and entirely leased to a student housing operator after construction completion. Sept. 2022 Under development
(Post Olympic Village Site Development) 1,500
*3: "Higashiueno Project” (provisional name) is under development as a lodging facility in light of the
location characteristics.
Copyright © Tokyo Tatemono Co., Ltd All Rights Reserved. 26(2) Residence Business:
For-Rent Condominiums
Brillia ist Yotsuya Honshiocho Brillia ist Sendagaya
(Construction completion in 2018) (Construction completion in 2019)
[Location] 15-10 Yotsuya-honshiocho, Shinjuku-ku, Tokyo [Location] 31-4, Daikyocho, Shinjuku-ku, Tokyo
[Access] 6-minute walk from Ichigaya Station on the Tokyo Metro [Access] 2-minute walk from Kokuritsu-kyogijo Station on the Toei Oedo Line
Namboku Line and Yurakucho Line 5-minute walk from Sendagaya Station on the JR Sobu Line
8-minute walk from Ichigaya Station on the Toei Shinjuku Line [Scale] 10 floors above ground
and JR Chuo-Sobu Line
8-minute walk from Yotsuya Station on the Tokyo Metro [Floor plan] Studio to 2LDK
Marunouchi Line and Namboku Line and JR Chuo-Sobu Line [Total units] 149 units + 1 shop section
[Scale] 12 floors above ground
(Left) Rooftop Terrace, (Right) Exterior
[Floor plan] Studio to 1LDK
[Total units] 85 units
(Left) Entrance
(Right) Exterior
Brillia ist Tower Kachidoki Kita Aoyama 3-chome Urban Development Project
(Construction completion in 2011) (provisional name)
[Location] 1-3-1 Kachidoki, Chuo-ku, Tokyo (Slated for completion in 2020)
[Access] 2-minute walk from Kachidoki Station on the Toei Oedo Line
[Site] 3-227-4 Kita-aoyama, Minato-ku, Tokyo
[Scale] 2 floors below ground, 45 floors above ground
[Use] 1F–2F: Shop, state-authorized day care center, and community center
[Use] Apartment (rental), shop, clinic, 2F–4F: Residence for elderly people with service (49 units)
certified child care center, office and other 5F–25F: Rental residence (229 units)
[Floor plan] Studio to 3LDK [Scale] 1 floor below ground, 25 floors above ground
[Total units] 536 units
(Left) Playroom
(Right) Exterior Exterior image
Copyright © Tokyo Tatemono Co., Ltd All Rights Reserved. 27(3) Real Estate Service Business:
First Three Quarters of FY2019 Results & Full-Year Forecasts
• First three quarters of FY2019: Increase in revenue and income due to increase in property sales to investors and strong
performance in the parking lots business and other factors
• Full year: Outlook is increase in revenue and decrease in income due to property sales to investors increasing but margin being
lower than in the previous fiscal year and other factors
2018/9 2019/9 Increase/ 2019/12 Achievement
Unit: Billion yen Main factors for increase/decrease
Actual Actual Decrease Forecasts rate
Revenue from operations 33.6 35.2 1.6 50.0 71%
Brokerage 2.7 2.9 0.2 4.5 66%
Asset solution 11.9 12.8 0.8 Net sales from property sales to investors +¥0.8 billion 19.5 66%
(First three quarters of FY2018: ¥9.5 billion; First three quarters of FY2019: ¥10.3
Management service, etc. 3.0 3.1 0.1 billion) 4.0 79%
Parking lots business 15.8 16.2 0.3 22.0 74%
Gross profit from property sales to investors -¥0.7 billion
Operating income 5.4 5.7 0.3 (First three quarters of FY2018: ¥3.5 billion; First three quarters of FY2019: ¥2.8 5.5 105%
billion)
2018/12 2019/12 Increase/
Unit: Billion yen Main factors for increase/decrease
Actual Forecasts Decrease
Revenue from operations 42.8 50.0 7.1
Brokerage 3.7 4.5 0.7
Net sales from property sales to investors +¥6.2 billion
Asset solution 13.6 19.5 5.8 (FY2018: ¥10.3 billion; FY2019: About ¥16.5 billion)
Management service, etc. 3.9 4.0 0.0
Parking lots business 21.5 22.0 0.4
Gross profit from property sales to investors -¥1.1 billion
Operating income 6.3 5.5 (0.8) (FY2018: ¥3.6 billion; FY2019: About ¥2.5 billion)
Copyright © Tokyo Tatemono Co., Ltd All Rights Reserved. 28(3) Real Estate Service Business:
Main Operating Indicators
• Asset Solution: Despite harsh acquisition environment attributable to decrease in cap rates and other factors, securing stock
mainly in central Tokyo.
• Parking lots business: Number of parking spaces increased by 617 from the end of June to 67,353 due to opening of large
facilities and other factors.
(Billion yen) (Parking spaces)
50 70,000
68,578
68,101
40 67,202 67,353
66,938 66,736
66,227 66,131
65,688
30
47.3 65,000
20 43.3
35.6
27.7
10
0 60,000
2016/12 2017/12 2018/12 2019/9
(at end of September 2019)
Other 1.5% 55,000
2017/9 2017/12 2018/3 2018/6 2018/9 2018/12 2019/3 2019/6 2019/9
Other
11.0% Office buildings
Major regional cities
20.2%
19.5%
Central Tokyo Commercial facilities
Greater Tokyo
(23 wards of Tokyo) & hotels
(Tokyo and 3 neighboring prefectures) Condominiums
57.3% 33.7%
21.7% for sale & rent
35.1%
Breakdown by Area of Location Breakdown by Asset Type
Copyright © Tokyo Tatemono Co., Ltd All Rights Reserved. 29(4) Other:
First Three Quarters of FY2019 Results & Full-Year Forecasts
• First three quarters of FY2019: Increase in revenue due in part to higher occupancy of existing facilities in the leisure business
and the senior & child care business.
• Full year: Outlook is increase in revenue and income due in part to higher occupancy of existing facilities in the leisure business
and the senior & child care business.
2018/9 2019/9 Increase/ 2019/12 Achievement
Unit: Billion yen Main factors for increase/decrease rate
Actual Actual Decrease Forecasts
Revenue from operations 17.7 20.1 2.4 25.0 81%
Leisure business 10.6 11.1 0.4 15.0 74%
Senior & child care business * 5.1 6.2 1.0 Higher occupancy of existing facilities, etc. 8.0 78%
Other 1.8 2.7 0.8 2.0 138%
Operating income 0.1 1.5 1.4 0.5 305%
2018/12 2019/12 Increase/
Unit: Billion yen Main factors for increase/decrease
Actual Forecasts Decrease
Revenue from operations 24.0 25.0 0.9
Leisure business 14.6 15.0 0.3
Senior & child care business * 7.1 8.0 0.8 Higher occupancy of existing facilities, etc.
Other 2.3 2.0 (0.3)
Operating income 0.1 0.5 0.3
* The child care business, which had been included in “Other,” has been reclassified to “Senior business,” effective from FY2019.
In conjunction, “Senior business” has been renamed “Senior & child care business.”
The actual figures of FY2018 have been restated under the new classification.
Copyright © Tokyo Tatemono Co., Ltd All Rights Reserved. 30MEMO
Copyright © Tokyo Tatemono Co., Ltd All Rights Reserved. 31(4) Other:
Initiatives for Overseas Business
• Engaging in investment in businesses in China and Asia where high returns can be expected by obtaining business
opportunities in growth markets as one of the measures in property sales business.
• Projected balance of investment for the FY2019 is scheduled to be around ¥60.0 billion in total.
Basic Strategy
・ Conduct business centering on partnership with local partners who are familiar with the local market and have superior development
and sourcing capabilities.
・ Dispatch resident officers from the Company to the area in order to manage risks based on the Company’s view and enhance
relationship with the partners.
・ Invest mainly in property sales business (residences) primarily in countries in China and Asia which the Company invested before.
FY of
Scale (Total number of Status
Name of project Location Main uses Total area construction
units/total floor space) (End of Sept.)
completion
Shenyang Tomorrow Square Project Shenyang City Residence, commercial, office Approx. 199,000 m² Approx. 5,900 units 2013 onward On sale
Qingdao Project Qingdao City Residence, commercial Approx. 86,000 m² Approx. 1,800 units 2015 onward Sold out
Yangzhou-Kita Project Yangzhou City Residence, commercial Approx. 95,000 m² Approx. 2,200 units 2016 onward Sold out
Xuzhou Qiaohu Project Xuzhou City Residence Approx. 122,000 m² Approx. 1,900 units 2019 onward On sale
China
Yangzhou-Minami Project Yangzhou City Residence, commercial Approx. 94,000 m² Approx. 1,200 units 2019 onward On sale
Yangzhou-Higashi Project Yangzhou City Residence, commercial Approx. 64,000 m² Approx. 970 units 2021 onward Before sale
Yinchuan Jinfeng Project Yinchuan City Residence, commercial Approx. 98,000 m² Approx. 1,200 units 2021 onward Before sale
Jiaxing Tongxiang Project Jiaxing City Residence Approx. 42,000 m² Approx. 500 units 2020 onward On sale
Singapore CPF Building Redevelopment Project Singapore Office Approx. 4,400 m² Approx. 57,400 m² 2020 Under development
Former Site of Yangon Military Museum Office, commercial, hotel 2021 Under development
Redevelopment Project Yangon, Myanmar Approx. 16,000 m² Approx. 92,000 m²
Sukhumvit 26 Project Bangkok, Thailand Residence Approx. 3,200 m² Approx. 150 units 2021 On sale
Asia
Sathorn 12 Project Bangkok, Thailand Residence Approx. 2,900 m² Approx. 250 units 2022 On sale
Sukhumvit 38 Project Bangkok, Thailand Residence Approx. 5,700 m² Approx. 300 units 2023 Before sale
Office: Approx. 47,000 m²
Dharmawangsa Project Jakarta, Indonesia Office, residence Approx. 16,000 m² 2021 On sale
Residence: Approx. 80 units
Loggia Project Jakarta, Indonesia Residence Approx. 11,900 m² Approx. 500 units 2023 Before sale
* Newly acquired projects are highlighted in red
Copyright © Tokyo Tatemono Co., Ltd All Rights Reserved. 32You can also read