A Proposed Prediction System and Analysis of Nutrients Uptake for Better Crop Growth in Hydroponics System - sciforum
←
→
Page content transcription
If your browser does not render page correctly, please read the page content below
Proceedings

A Proposed Prediction System and Analysis of Nutrients
Uptake for Better Crop Growth in Hydroponics System †
Swapnil Verma and Sushopti D. Gawade *

                                          Mumbai University, Mumbai post code, India; swapnilv202@gmail.com
                                          * Correspondence: sgawade@mes.ac.in
                                          † Presented at the 1st International Electronic Conference on Agronomy, 3–17 May 2021; Available online:
                                            https://iecag2021.sciforum.net/.

                                          Abstract: With the ascent of new techniques in farming, Hydroponics, an efficient and smart
                                          method of cultivating crops in water is becoming an increasingly popular choice for growing crops.
                                          It is likewise being utilized for augmenting crop yield. Water nutrient management thus becomes a
                                          vital technique for ensuring optimal requirements for crop growth. A balanced supply of these nu-
                                          trients is the key to healthy plants. We studied the dynamics of the nutrients uptake for the tomato
                                          crop which aids in enhancing its absolute crop growth rate (CGR). This paper proposes a framework
                                          to predict the absolute CGR using machine learning technique for the tomato crop in hydroponics.
                                          Input variables like Electric conductivity (EC) limit, Nutrient solution (NS), ion concentration up-
                                          take, dry weight matter of the fruits are contributing factors for the feasible growth of hydroponic
                                          tomato crops. The study shows positive and negative correlations with the growth parameter dry
                                          weights of the fruits. The dynamics of uptake of nutrient ions Na, K, Mg, N and Ca during growth
                                          of tomato fruits was shown and its effect on the target variable absolute growth was studied. This
                                          correlation analysis helped us determine the important variables that affect the CGR and will give
                                          us more insights on the correct supply of nutrients for good growth and development of the crops.
                                          The proposed system design provides a smart and efficient way to predict and achieve good abso-
                                          lute CGR while estimating the optimum value of the essential parameters will help us in achieving
                                          good quality yields.

Citation: Verma, S.; Gawade, S.D. A       Keywords: hydroponics; absolute crop growth rate (CGR); nutrient solution (NS), dry weight mat-
Proposed Prediction System and            ter; electric conductivity (EC) limit; correlations
Analysis of Nutrients Uptake for
Better Crop Growth in Hydroponics
System. Proceedings 2021, 68, x.
https://doi.org/10.3390/xxxxx             1. Introduction
                                               Hydroponics is a soil-less method to cultivate crops in water. This zero soil cultiva-
Published: date
                                          tion method represents an excellent opportunity for the agriculture domain, especially in
Publisher’s Note: MDPI stays neu-
                                          areas dealing with challenges like unmanageable soil degradation and restrained water
tral with regard to jurisdictional        sources [1]. Furthermore, this agricultural practice demonstrates excellent results towards
claims in published maps and institu-     an environment-friendly and user-friendly farming. It is also a reliable tool for the future
tional affiliations.                      of upcoming challenges in terms of food security [1]. Various parts of the globe that face
                                          challenges like unpredictable weather patterns, excessive heat, reduced space availability,
                                          are taking hydroponics as an alternate approach to farming and a potential solution for
                                          their problems. The world commercial hydroponics industry has multiplied 4 to 5-fold in
Copyright: © 2021 by the authors.
                                          the last decade and is currently approximated between 20,000 and 25,000 hectares with a
Submitted for possible open access
                                          farm gate value of US $6 to $8 billion. (Hydroponic Green Technologies India Pvt Ltd-
publication under the terms and
                                          HGTIPL, India). As a result, farming practices are rapidly shifting to more automated and
conditions of the Creative Commons
                                          precision farming practices for better crop yields and financial gains [2]. With the new era
Attribution      (CC   BY)      license
                                          of big data, techniques such as machine learning and artificial intelligence available, data
(http://creativecommons.org/licenses
/by/4.0/).
                                          can be used to analyze, generate patterns and make predictions [2].

Proceedings 2021, 68, x. https://doi.org/10.3390/xxxxx                                                           www.mdpi.com/journal/proceedings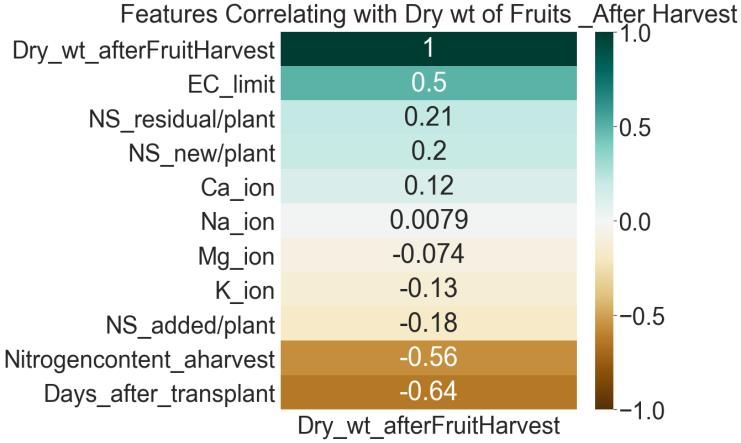
Proceedings 2021, 68, x FOR PEER REVIEW                                                                                  2 of 11

                                      Hydroponics farming can be broadly divided into three types: Nutrient Film tech-
                                 nique (NFT), Aquaponics, and Deep Flow technique. The Nutrient film technique (NFT)
                                 is one of the hydroponic methods wherein a shallow stream of water containing the re-
                                 quired dissolved nutrients also called as Nutrient solution (NS) is used which is a good
                                 medium for plant growth. It is re-circulated through the roots of the plants in watertight
                                 pipes, also termed as channels. The rationale of the set up and working of the NFT is the
                                 recycling of the NS. In this system, NS is enriched with material like sand, vermiculite, or
                                 rock wool which is passed and re-circulated through a slope consisting of plants placed
                                 in a plastic trough. It provides the optimum amount of nutrients to the plant through its
                                 root system. It is ideal for short term crops like lettuce, tomatoes, strawberry, and rasp-
                                 berries. Hydroponics has been termed as a promising tool in the areas with limited land
                                 resources. It offers major advantages over the traditional soil farming and other cultiva-
                                 tion methods. Low cost of installment, easy operation, management and effective utiliza-
                                 tion of nutrients, and recycling of water are some of the reasons which has made it a pop-
                                 ular choice [3]. In general, closed hydroponic systems have lower water and nutrient re-
                                 quirements for plant growth [4] due to the recycling of water and nutrients. The field of
                                 hydroponics is relatively new and combining it with advancing technologies and compu-
                                 tation can provide cost and time effective solutions. Some of the limitations in the area of
                                 hydroponics include the lack of:
                                 (1) effective management of nutrients used in the water for hydroponic crops,
                                 (2) detailed analysis and study of parameters that promote rapid growth with good
                                     quality yields, and,
                                 (3) easy and smart approaches, wherein automation processes using machine learning
                                     can help us in predicting.
                                      Different types of algorithms are used in-order to estimate and predict accurate val-
                                 ues of the parameters involved during the growth process of the crops. This will enhance
                                 the efficiency and make hydroponics farming an easy and smart technique to maximize
                                 yields.

                                 2. Related Work
                                       Paper [5], discusses the application of Fuzzy algorithm Mamdani method to predict
                                 the growth and development of hydroponic watercress. The concept behind the work is
                                 to use the Fuzzy Inference System (FIS) which is basically a computing system that works
                                 on the principle of fuzzy reasoning and a similitude of human reasoning to predict crop
                                 growth. The process constructed the rule base system using the fuzzy algorithm Mamdani
                                 method, and it can form twenty-seven rules. The prediction system utilizes the independ-
                                 ent variables having a high impact on the growth of the watercress. Authors in [6] pro-
                                 posed a system to monitor the growth of the plant using IoT and a fuzzy logic to maintain
                                 optimum water supply and nutrient levels. The design is effective when compared to the
                                 traditional methods used in hydroponics to monitor the nutrient and water requirements
                                 during the life-cycle of the plant. In paper [7] specifically, artificial neural networks were
                                 applied to a model that predicts the values of pH and EC of the system. These predictions
                                 are very important because they are required by other intelligent systems that ensure the
                                 proper and optimal operation of the hydroponic system. This work also connects artificial
                                 intelligence and machine learning with hydroponic systems that opens the way to further
                                 advancement and study of smart systems in the field of hydroponics that will lead to more
                                 precise cultivation. The authors in [8] utilized algorithms like neural networks to predict
                                 optimum values of temperature, pH, humidity data were obtained by sensors. The paper
                                 discusses the use of machine learning and IoT in hydroponics farming which can facilitate
                                 the farmers to do their work without continuous supervision thereby making it an effi-
                                 cient and easy method. In paper [9] machine learning techniques like k-nearest neighbor
                                 and lasso regression have been used for nutrient value predictions and thereby helping to
                                 maximize the crop yields.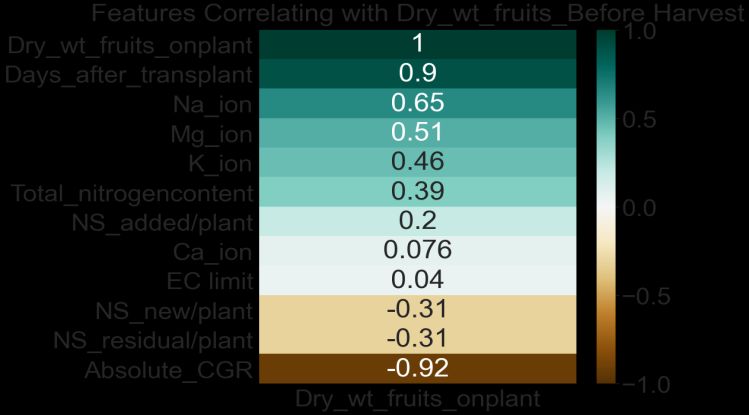
Proceedings 2021, 68, x FOR PEER REVIEW 3 of 11
The authors in [10] highlighted the importance of machine learning techniques in
accurate crop prediction and analysis which has a positive impact on the resource man-
agement and environment.
3. Proposed System Design
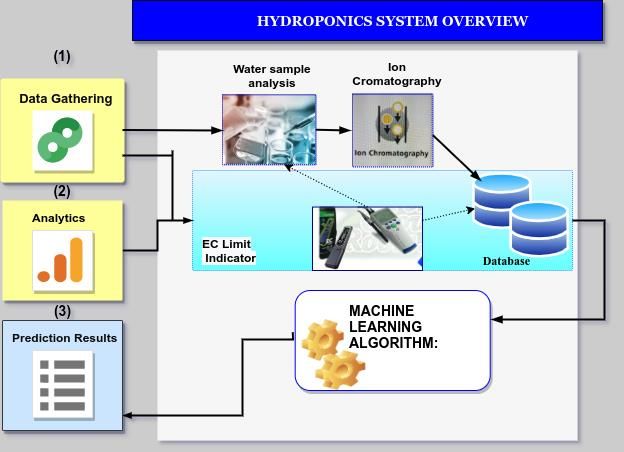
The proposed system design shown in Figure 1, depicts the proposed framework for
prediction of absolute CGR using machine learning. The steps followed are data gathering
which includes water sample analysis, that undergoes the ion chromatography process,
to determine ion concentrations. The EC limit, dry weight matter of the entire plant and
fruits are the other input variables used in the database for analysis. The outputs from the
data gathering and analytic steps will be fed to the machine learning algorithm to derive
prediction results. The complete process is elaborated in three sections: design architec-
ture, prediction system, flowchart of the system.
Figure 1. Hydroponics systems overview: Comprising of 3 stage: (i) Data gathering. (ii) Analytic,
(iii) Prediction Results.
3.1. System Design Architecture
The complete setup is divided into three main parts: (i) data gathering (ii) analytics
and (iii) prediction results. The system is flexible, easily adaptable, and can be used for
crops suitable for NFT. The tomato crops were cultivated with a soil-less NFT, a re-circu-
lated close system [11]. In our case, we consider tap water samples for analysis however
we can also use rain water or treated or recycled water in NFT. The minimum value of
temperature was maintained at 12 °C, and the ventilation temperature was set to 20 °C
[11]. The NS solution can be bought premixed based on quantity requirements or can be
prepared by self-based [12]. The formulation for the NS should be crop targeted and op-
timal. NS was added for hydroponic tomato crops and the volume of the NS was meas-
ured with the help of a flow meter [11]. Every 2 days, every tank was refilled with fresh
NS up to the initial volume. The amount of nutrients, salts, or impurities, in the water, is
referred to the Electric conductivity (EC) limit. For maintaining optimum levels of EC,
authors from the study [11] set up the EC to levels (5, 7.5 and 10 dS·m−1, note that these
values can vary for different crops). EC-based nutrient control for hydroponics crop cul-
tivation may provide amounts of nutrients that are not in optimal amounts for the plants
[13], hence cannot be used directly to determine the ions concentration [3]. An ion chro-
matography process Dionex model DX500; Dionex Corporation, Sunnyvale, CA, USA)
process was used by [11], to indicate the total dissolved ion concentrations in the solution.
The information provided the values for the ion concentration (cations) in the various
parts of the tomato plant, which is subdivided into the leaf, stem, fruits, and roots. A min-
imum temperature of 12 °C was set and ventilation temperature was 20 °C with a relative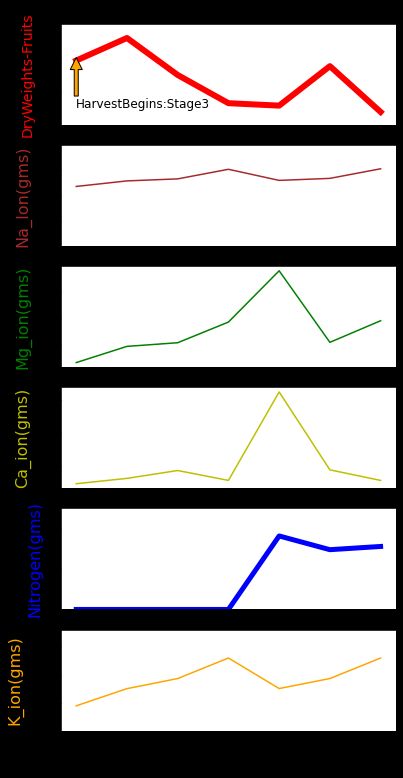
Proceedings 2021, 68, x FOR PEER REVIEW 4 of 11
humidity that was always higher than 50%, except for 2 days, in which it reached 45% [11].
Fortnightly, one plant from each experiment area was taken for study. The plant density
was found to be 3.3 plants m−2. A forced-draft oven was used to determine the dry matter
weight and measured with two decimal places to weigh it [11]. The variables that were
measured included dry matter weight of the entire plant (leaves, roots, stem, fruit), EC
limit, NS consumption, absolute CGR total Nitrogen content of leaves and fruits, the ion
concentrations for every organ was further divided according to their origin (i.e., fruits
from before and after harvest). The data-set values are stored in an excel sheet that con-
tains raw data with the following parameters of a soilless tomato crop for a period of 167
days which is approximately 5.5 months. We updated the data set with absolute CGR
values and an average has been taken for the ions concentrations whose nine observations
were taken per day. These details are used for the statistical data analysis and the highly
correlated variables will be fed into the machine learning algorithm to predict an output
for the target variable i.e., absolute CGR in our proposed system. Since the data is ana-
lyzed at each stage it will aid us in calculating the concentration of the elements into the
NS and the mineral composition of the plants on a daily basis [11]. The growth and devel-
opment parameters of the crops is highly dependent on dry weight matter of its yields
and the entire growth of plant (Growth and development indices in crop production by
Souvik Ganguly). Hence we have discussed these growth parameters in detail. The input
data-set consists of observation during the growth of the hydroponic tomato crop in the
Mediterranean region of Europe [11]. The data-set includes:
The entire dry matter weight of the tomato plant (in grams) and dry weights of the
different parts i.e., leaves, stems, fruits and roots,
nutrient solution (NS) consumption. (All data is expressed in litres/plant). NS
fresh/new Plant, fresh NS stands for the NS added after the NS was completely re-
placed. NS added plant,is the (NS added for the first time) and lastly the NS residual
of the plant left during the cycle and at the end of it was measured,
uptake of inorganic cations, namely Sodium (Na), Potassium(K), Calcium (Ca), Mag-
nesium (Mg), split for the various parts (stem, leaves, fruits, and roots) and is ex-
pressed in gm L−1d−1 (grams per liter per day),
Nitrogen content for the several parts of the plant (leaves, stems, roots and fruits),
and
Days after Transplant (DAT).
3.2. Prediction System
The prediction part of the system design is based on the premise of using machine
learning techniques to predict the absolute CGR of the plants, ‘x’ days ahead in time. The
model aims to predict the absolute CGR output based on parameters such as: dry weight
matter of the entire plant (stem, leaves, roots, fruits), NS, ion uptakes of the fruit samples
before and after harvest, EC limit, and total nitrogen content of the fruit. The absolute
CGR of the crop can be calculated by the given formula [11]:
W2 − W1
Absolute CGR = (1)
t2 − t1
where, W1 and W2 are dry weights of the tomato plant in grams with respect to time in
days t1 and t2. It indicates the rate of increase of the entire dry weight matter of the plant.
Unit of Absolute CGR: grams (dry matter weight/day).
3.3. System Flowchart
The following steps describe the approach in greater detail:
And are shown in Figure 2.
Step 1: Collection water samples for analysis (Tap water).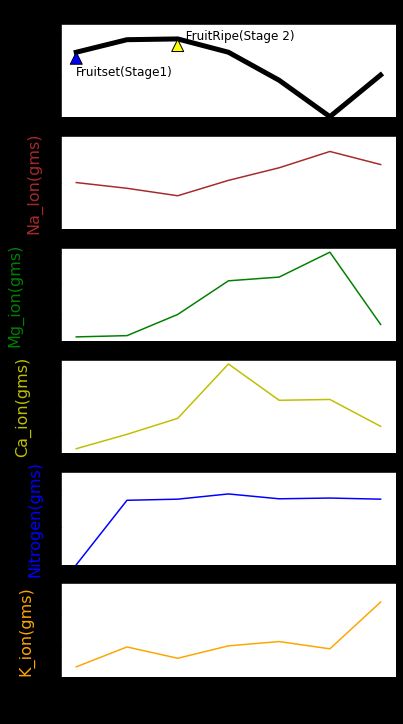
Proceedings 2021, 68, x FOR PEER REVIEW                                                                                  5 of 11

                                       Step 2: Setup and adjustment system parameters according to (tomato) crop require-
                                 ments EC limit range (5, 7.5, 10) led lights range 400–700 nm, and NS injection.
                                       Step 3: Ion chromatography used to determine ion cation and anions i.e., ion concen-
                                 tration.
                                       Step 4: Collection for nutrient data analysis by taking input variables like ion concen-
                                 tration, Nitrogen content, EC limit, NS, and dry weights of the entire plant (tomato crop).
                                       Step 5: Calculation of the absolute crop growth ratio using Equation (1).
                                       Step 6: Correlation between input variables and target variable absolute CGR.
                                       Step 7: Application of machine learning algorithm on the data set of the given varia-
                                 bles.
                                       Step 8: Prediction results (Output: Absolute CGR).
                                       END.

                                 Figure 2. Flowchart of the system.

                                 4. Data Analysis
                                 4.1. Nutrient Analysis
                                       A nutrient solution (NS) is a liquid fertilizer solution adjusted in fixed compositions
                                 to enhance the crop growth and protect it from nutrient deficiencies [12].The plant’s need
                                 is fulfilled through the ionic form of nutrients supplied through the water and nutrient
                                 fertilizer added. The NS varies from crop to crop along with their growth duration and
                                 environmental conditions. NS are basically composed of macro and micro nutrients clas-
                                 sified as Potassium (K), Nitrogen (N), Calcium (Ca), Magnesium (Mg), and micro nutri-
                                 ents classified as Sodium (Na) [4]. Macro nutrients are utilized in greater quantities when
                                 compared with micro nutrients. In hydroponic systems, plants and crops are generally
Proceedings 2021, 68, x FOR PEER REVIEW 6 of 11
nurtured and grown in water mixed with liquid nutrient solution (NS) in it [13]. The so-
lution is monitored at regular intervals and circulated to ensure that the correct chemical
composition is maintained. They have a definite composition and a relatively high con-
centration of nutrients adjusted according to its electric conductivity (EC) [13]. The EC is
proportional to the total dissolved cations and anions present in the solution, making it a
suitable measurement parameter of nutrient solution strength [13]. An optimum oxygen
supply, potential of hydrogen (pH levels), EC limit and optimal temperature conditions
are required. Environmental factors and NS are the two key factors for productivity in
hydroponics [12]. Supply of nutrient elements has to be monitored continuously during
the growth cycle and it depends upon the requirement of crops, and the frequency of us-
age [12]. In the setup, the authors [11] used NS and supplied it over the whole benches
using pumps (one for every bench) submerged into tanks (one for every bench system).
The EC limit was set up to (5, 7.5 and 10 dS·m−1), during the entire process, above which,
the NS was completely replaced with a fresh NS and is labeled as NS new plant [6]. After
every 2 days, every tank was replaced with fresh NS (NS new plant) up to the initial vol-
ume of the tank. In addition, the volume of NS residual during the end of the cycle was
also measured [11]. The readings were taken for the period of 167 days i.e., 22 weeks ap-
proximately. The NS consumption was mainly due to transpiration, because in a Nutrient
Film Technique (NFT) system the evaporation is negligible, referred to a single plant [11].
The author [11] divided the volume of NS added to each tank by the plant’s number. Ion
concentrations for Na, K, Ca, Mg, and N for various organs like stem, leaves, fruits and
roots were measured by using ion chromatography.
4.2. Fruit Analysis
The destructive samples (before harvest) of tomato plant were taken every 2–3 weeks
until 56 days after transplantation (DAT) to determine the ion uptake analysis of Na, K,
Mg, Ca and Nitrogen (N) content for the fruits. A forced-draft oven was used to calculate
the dry matter weight and a balance with two decimal places was used [11], all the obser-
vation values are taken in grams. The growth parameters included the dry weight matter
of the tomato fruits and absolute CGR of the entire plant. The absolute CGR of the plant
was observed (during destructive sampling of fruits, while fruits were not harvested). Af-
ter a period of 116 (DAT) i.e., around 3 and a half months, tomato fruit samples were
harvested and their ion uptake was analyzed every 6–8 days along with the tomato fruit
dry matter weights.
5. Results and Discussions
5.1. Absolute Growth Rate of the Entire Plant and Phases of Tomato Growth
The fruits were first observed on the plant during the initial Stage I i.e., (Fruit set)
after 56 (DAT), as shown in Figure 3 the absolute CGR of the tomato plant was 2.7 gms/day
during this stage. After 77 days NS (new plant) solution was added multiple times to the
tomato plant. At Stage II: (Fruit ripening) after 93 days an exponential growth rate of the
plant was observed with a maximum absolute CGR of 4.27 gms/day. The NS new plant
was added multiple times during this stage as well. At Stage III (Fruit maturity and har-
vest), 116 (DAT) the fruits were matured and harvested, however a decrease in the abso-
lute CGR was observed at this stage with a value of 2.7 g/day. A continuous supply of NS
was maintained till 167 days during the stage III, which indicated an increase in the de-
mand of ions by the plants for the (Fruit set); a slight increase of 0.01 in the CGR was also
observed during the late stages of harvest.Proceedings 2021, 68, x FOR PEER REVIEW 7 of 11
Figure 3. absolute CGR of the entire tomato plant over a period of 21 weeks (159 days) approxi-
mately in the NFT Hydroponics system.
5.2. Nutrient Ion Uptakes during Different Growth Stages of Tomato Fruit before and after
Harvest and Its Impact on Absolute CGR
The macro and micro nutrient ion uptakes of the tomato fruits during the entire
growth process of 167 days are shown in Figure 4, and Table I, Table II. The ion uptake
rates were in the order K > N > Na > Mg > Ca during both the stages (before and after
harvest). In the initial period of Stage I and Stage II (Fruit set and Fruit ripening) the con-
centration of the ion uptake was observed in the range (0–1.8) gm L−1d−1, however the K
ion showed a significant difference in the uptake with highest values of uptake in range
(21–33) gm L−1 d−1 The nutrient uptake rates increased significantly after the fruits started
maturing and were ready to harvest until day 142. The variation trends in ion concentra-
tions show that there was an increasing trend for all the ions after 93 (Fruit Ripe: Stage II)
and highest absolute CGR (4.27 gm d−1) was observed simultaneously. In the later period
a decreasing trend was observed for the CGR and absorption levels of all the ions except
K ions. respectively. The maximum uptake rates of K, N, Na, Mg and Ca was 31.47, 1.90,
1.67, 1.74 and 1.23 gm L−1d−1 respectively. Figure 5 shows the dynamics of nutrient uptakes
from day 116, the harvest stages (Stage III) and its impact on the dry weight matter of the
fruits. Nitrogen absorption was too low hence was not observed until day 139. Dry weight
matters of the fruits showed an increase till 124 (DAT). A rapid decrease in weights was
observed till day 146. The trends in variation for Na, Ca, Mg, N and K ions did not follow
the trends in variation of the dry weight matter. The maximum concentrations values ob-
served were 1.67, 1.008, 1.74, 1.90, 31.47 respectively. K ions continued to have the highest
absorption rates while the uptake rate of Ca ions was observed to be the lowest during
the entire growth cycle as compared to the other ions.
Table 1. Ion concentrations for tomato fruits after harvest.
DAT Na Mg Ca N K Dry Weight of Fruits
116 1.18 0.87 0.73 0 27.12 39.12
124 1.29 0.99 0.81 0 28.74 45.82
130 1.33 1.01 0.93 0 29.64 34.82
139 1.52 1.17 0.78 0 31.47 26.44
146 1.30 1.55 2.12 1.82 28.75 25.72
158 1.34 1.02 0.94 1.48 29.64 37.45
167 1.53 1.18 0.78 1.56 31.47 23.84Proceedings 2021, 68, x FOR PEER REVIEW 8 of 11
Table 2. Ion concentrations for tomato fruits before harvest.
Stages of Growth DAT Na Ca Mg N K Absolute CGR
Stage I 56 1.00 0.70 1.08 0 21.57 2.7
70 0.88 0.78 1.07 1.73 24.77 1.43
Stage II 93 0.72 0.89 1.25 1.76 22.95 4.27
116 1.05 0.23 1.52 1.90 24.95 4.18
128 1.32 1.003 1.55 1.77 25.64 −0.61
Stage III 142 1.67 1.008 1.74 1.79 24.47 −4.91
158 1.47 0.80 1.17 1.76 31.47 0.01
Figure 4. (ION ANALYSIS BEFORE and AFTER HARVEST) Dynamics of nutrient ion uptake of the tomato fruits and
related variation trends with absolute CGR before harvest, and variation trends of dry weight matter of the fruits after
harvest in a closed NFT hydroponics system.
Figure 5. Heat map depicts correlation analysis between dry weight matter of the fruits on the
plant before harvest with different input variables during the growth process.Proceedings 2021, 68, x FOR PEER REVIEW 9 of 11
5.3. Relationships between Growth Parameters, Absolute CGR, Dry Weight Matter of Tomato
Fruits with Other Input Variables
The Figure 5, shows a strong positive correlation was observed between the dry
weights and DAT which indicates a good productive yield with time. Negative correla-
tions were observed with the CGR of the plant during this stage. NS (NS added) played
an important role during the growth process and had a positive correlation with the in-
crease in dry weights. Other variables like EC limit had a weak correlation indicating
greater absorption of dissolved ions during this stage Na ions observed the highest corre-
lations of 0.65 explaining its possible good precipitation. It was observed that Ca ion had
a very weak correlation of 0.076 during the growth process before harvest. The dry
weights of fruit samples after harvest shown in Figure 6, observed a high positive corre-
lation of 0.5 with EC limit (increased values of EC) suggested that the fruits possibly ab-
sorbed more water instead of dissolved ions [13], during the Stage 3: (Fruit maturity and
harvest). NS (new plant) continued to play a critical role during the harvest stages as well
with a positive correlation of 0.2. No positive correlations were observed with (DAT) and
N, Na, K, Mg ions.
Figure 6. Heat map depicts correlation analysis of dry weight matter of fruits after harvest with
the different input variables during the entire growth process.
We proposed and designed a flexible framework for hydroponics that can be used in
the prediction of the absolute CGR. The three stages in our system are interdependent
with each other and aim to predict the CGR in an easy manner utilizing input variables
important during the growth process. The environmental conditions set in the NFT closed
hydroponic system were good to support the optimal cultivation of the tomato plants. A
detailed study analysis shows the nutrient concentrations and dynamics of ions uptakes
of Na Ca, Mg, K and N at different stages of growth for the tomato fruit. The absolute
CGR of the plant was calculated and observed for all the different stages of the tomato
plant. No significant changes were observed between the absolute CGR and the different
stages of fruit growth. The correlation analysis further suggested the input variables
which had a strong impact on the growth parameters like dry weight of the entire fruits.
It was observed that nutrient ion Na had the highest correlation, these ions enhance the
growth and development of the tomato plants and also contribute in improving the fla-
vors of the edible parts [13]. Ca had a lowest rate of uptake and the weakest correlation
with the dry weight matter of the fruits, indicating that the amount in the nutrient solution
absorbed was not optimal for tomato growth. The supply of Ca ions is more essential for
rapid increase in fruit size [13]. Hence higher amounts of Ca should be added during the
growth process in order to prevent their deficiency during the growth process and pro-
mote good yields of tomato. The K and Mg ions had positive correlations and variation
trends during the growth process. Elevated levels of K ions may improve the fruits [14].
Higher EC values indicate more ions in the solution [13]. The EC limit remained constantProceedings 2021, 68, x FOR PEER REVIEW 10 of 11
(5,7.5,10) during the growth of tomatoes indicating that a similar amount of ions were
absorbed at this interval. However, an exponential growth in the tomato plants and in-
creased EC correlation values indicate that the water absorption was more as compared
to the dissolved ions in the solution. These results indicate that specific ion monitoring
and adjustments are required (preferred over EC based control methods) for better up-
takes which can result in good growth and development of the plants in hydroponics.
6. Future Work
Our system approach is smart and easy however can be specific by using efficient
algorithms like Random forest, Deep neural networks. Currently comparative study is
done on various machine learning algorithms performances for soil cultivation, however
it could be useful if more comparative study is done with hydroponics data-sets, including
more variables. In our current approach we only focus on predicting the absolute CGR
however other parameters like dry weight matter, relative growth rate can also be utilized
which help us in determining faster growth rate. Other areas of study like better analysis
of nutrient uptake of different water samples like recycled water or rain water which is
beyond the scope of this paper, can also be very useful.
7. Conclusions
This paper proposed a smart and easy framework that can be used to predict absolute
CGR based on the machine learning paradigm in hydroponics. We aim to automate our
process and reduce the complexities involved in order to achieve optimum growth rates
for the crops. The analysis shown here will assist in the identification of parameters im-
portant for an increased growth rate. The results show that the NS and NS (new plant)
used played a critical role during the entire growth period and aided the increase in ab-
solute CGR of the entire plant and tomato yields (dry weights). The Na and K ions showed
a significant increase in the uptake as compared to other ions, however Ca ions observed
lowest rates of absorption during the entire growth process indicating better adjustments
to be done in the NS. A regular monitoring of ions instead of EC based controls is a better
way to prevent the nutrient deficiencies observed and promote good growth. These anal-
yses facilitate us with better insights for good tomato yields and the proposed technique
presented can be used to predict absolute crop growth rate in an effective manner for
tomatoes. The overall aim of our work is to propose: a machine learning approach to pro-
vide useful insights into the field of hydroponics and minimize the complexities during
the process. The controlled environment with precision techniques used in the framework
is the future of our farming and can be utilized in any hydroponic crop in general thereby
helping in maximizing crop yields.
Funding: This research received no external funding.
Institutional Review Board Statement:
Informed Consent Statement:
Data Availability Statement:
Conflicts of Interest: The authors declare no conflict of interest.
References
1. Sambo, P.; Nicoletto, C.; Giro, A.; Pii, Y.; Valentinuzzi, F.; Mimmo, T.; Lugli, P.; Orzes, G.; Mazzetto, F.; Astolfi, S.; et al. Hydro-
ponic Solutions for Soilless Production Systems: Issues and Opportunities in a Smart Agriculture Perspective. Front Plant Sci.
2019, 10, 923.
2. Hong, Z. A Data-Driven Approach to Soil Moisture Collection and Prediction Using a Wireless Sensor Network and Machine
Learning Techniques. 2015. Available online: https://www.ideals.illinois.edu/handle/2142/88145 (accessed on 20 January 2021).
3. Christie, E. Water and Nutrient Reuse within Closed Hydroponic Systems. 2014. Available online: https://digitalcommons.geor-
giasouthern.edu/cgi/viewcontent.cgi?article=2154&context=etd (accessed on).Proceedings 2021, 68, x FOR PEER REVIEW 11 of 11
4. Maneejantra, N.; Tsukagoshi, S.; Lu, N. A Quantitative Analysis of Nutrient Requirements for Hydroponic Spinach (Spinacia
oleracea L.) Production Under Artificial Light in a Plant Factory. J. Fertil. Pestic. 2016, 7, 2, doi:10.4172/2471-2728.1000170.
5. Sudana, I.M.; Purnawirawan, O.; Arief, U.M. Prediction system of hydroponic plant growth and development using algorithm
Fuzzy Mamdani method. AIP Conf Proc. 2017, 1818, 020052.
6. Herman, H.; Surantha, N. Intelligent Monitoring and Controlling System for Hydroponics Precision Agriculture. In Proceedings
of the 2019 7th International Conference on Information and Communication Technology (ICoICT), Kuala Lumpur, Malaysia,
24–26 July 2019; doi:10.1109/icoict.2019.8835377.
7. Ferentinos, K.P.; Albright, L.D. Predictive neural network modelling of pH and electric conductivity in deept through hydro-
ponics. Trans. ASAE 2002, 45, doi:10.13031/2013.11412.
8. Saraswathy, D.V.R.; Nithiesh, C.; Kumaravel, S.P.; Ruphasri, S. Integrating Intelligence in Hydroponic Farms. 2020. Available
online: https://papers.ssrn.com/abstract=3657121 (accessed on).
9. Srinidhi, H.K.; Shreenidhi, H.S.; Vishnu, G.S. Smart Hydroponics System Integrating with IoT and Machine Learning Algorithm.
In Proceedings of the 2020 International Conference on Recent Trends on Electronics, Information, Communication Technology
(RTEICT), Bengaluru, India, 12–13 November 2020; pp. 261–264.
10. Srivani, P.; Devi, C.Y.; Manjula, S.H. A Controlled Environment Agriculture with Hydroponics: Variants, Parameters, Method-
ologies and Challenges for Smart Farming. In Proceedings of the 2019 Fifteenth International Conference on Information Pro-
cessing (ICINPRO), Bengaluru, India, 20–22 December 2019; pp. 1–8.
11. Signore, A.; Serio, F.; Santamaria, P. Growth Analysis and Nutrient Solution Management of a Soil-Less Tomato Crop in a
Mediterranean Environment. Brown Univ. Dig. Addict. Theory Appl. 2019, 4, 38.
12. Kumar, P.; Saini, S. Nutrients for Hydroponic Systems in Fruit Crops. In Urban Horticulture; Solankey, S.S., Akhtar, S., Maldo-
nado, A.I.L., Rodriguez-Fuentes, H., Contreras, J.A.V., Reyes, J.M.M., Eds.; IntechOpen: Rijeka, Croatia, 2020.
13. Lee, J.Y.; Rahman, A.; Azam, H.; Kim, H.S.; Kwon, M.J. Characterizing nutrient uptake kinetics for efficient crop production
during Solanum lycopersicum var. cerasiforme Alef. growth in a closed indoor hydroponic system. PLoS ONE 2017, 12,
e0177041, doi:10.1371/journal.pone.0177041.
14. Botrini, L.; Graifenberg, A.; di Paola, M.L. Potassium affects sodium content in tomato plants grown in hydroponic cultivation
under saline-sodic stress. HortScience 2000, 35, 1220–1222.
15. Growth and Development Indices in Crop Production by Souvik Ganguly. Available online: https://www.slideshare.net/ (ac-
cessed on).You can also read


