Normal sonographic liver and spleen dimensions in a central European pediatric population
←
→
Page content transcription
If your browser does not render page correctly, please read the page content below
Waelti et al. BMC Pediatrics   (2021) 21:276
https://doi.org/10.1186/s12887-021-02756-3

 RESEARCH ARTICLE                                                                                                                                   Open Access

Normal sonographic liver and spleen
dimensions in a central European pediatric
population
Stephan Waelti1,2,3* , Tim Fischer2,3, Simon Wildermuth2,3, Sebastian Leschka2,3, Tobias Dietrich2,3,
Sabine Guesewell4, Pascal Mueller5, Michael Ditchfield6 and Stefan Markart1,2

  Abstract
  Background: Organ size is influenced by a number of factors. Age, height, weight, and ethnicity are known
  influencing factors. Pediatric populations have changed over time, puberty beginning earlier resulting in a changing
  growth pattern of their organs. Hence, contemporary charts using local data are considered the most appropriate
  for a given population. Sonographic charts for liver size for a predominantly Caucasian population are limited,
  which has implications for clinical practice. The aim of this study was to define a contemporary normative range of
  liver and spleen sizes for a healthy, predominantly Caucasian population and for all pediatric age groups (0–18
  years) and to investigate whether there is a size difference between genders and ethnicities.
  Methods: Retrospective study including children with normal sonographic findings and no evidence of liver or
  splenic disease clinically. Craniocaudal and anteroposterior dimensions are measured for the right and left lobe of
  the liver, and craniocaudal dimension for the spleen. Relationship of the liver and spleen dimensions with age,
  body length, body surface area, weight, and gender were investigated. Charts of normal values were established.
  Values were compared to studies involving other ethnicities and to one study carried out in 1983 involving the
  same ethnicity.
  Results: Seven hundred thirty-six children (371 boys, 365 girls) aged 1 day - 18.4 years were included. From the
  second year of life, the craniocaudal dimension of the right lobe of the liver is 1–2 cm larger in the Central
  European population compared with non-Caucasian populations at a given age. Liver size of Central European
  children in 2020 is greater compared to a similar population almost 40 years ago. The craniocaudal dimension of
  the spleen of Central European, US-American and Turkish children is similar. The difference between genders is
  statistically significant for both the liver and the spleen, being larger in boys.
  Conclusion: Contemporary and ethnically appropriate reference charts for liver and spleen measurements should
  be used, especially for liver size. The effect of ethnicity is reduced if patient height rather than age is referenced.
  Keywords: Liver size, Spleen size, Ultrasound, Children, Caucasian

* Correspondence: stephan.waelti@kssg.ch
1
 Department of Radiology and Nuclear Medicine, Children’s Hospital of
Eastern Switzerland, Claudiusstrasse 6, 9006 St. Gallen, Switzerland
2
 Department of Radiology and Nuclear Medicine, Cantonal Hospital St.
Gallen, Rorschacher Strasse 95, 9007 St. Gallen, Switzerland
Full list of author information is available at the end of the article

                                        © The Author(s). 2021 Open Access This article is licensed under a Creative Commons Attribution 4.0 International License,
                                        which permits use, sharing, adaptation, distribution and reproduction in any medium or format, as long as you give
                                        appropriate credit to the original author(s) and the source, provide a link to the Creative Commons licence, and indicate if
                                        changes were made. The images or other third party material in this article are included in the article's Creative Commons
                                        licence, unless indicated otherwise in a credit line to the material. If material is not included in the article's Creative Commons
                                        licence and your intended use is not permitted by statutory regulation or exceeds the permitted use, you will need to obtain
                                        permission directly from the copyright holder. To view a copy of this licence, visit http://creativecommons.org/licenses/by/4.0/.
                                        The Creative Commons Public Domain Dedication waiver (http://creativecommons.org/publicdomain/zero/1.0/) applies to the
                                        data made available in this article, unless otherwise stated in a credit line to the data.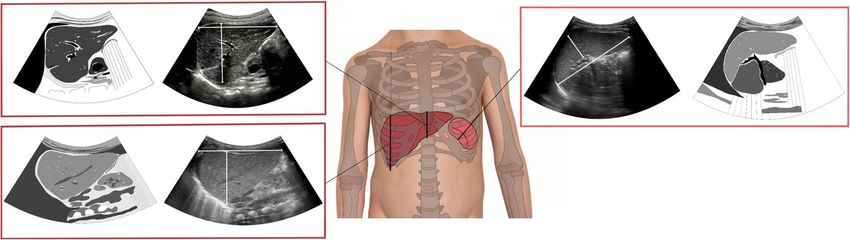
Waelti et al. BMC Pediatrics   (2021) 21:276                                                                  Page 2 of 10

Background                                                    weight and body surface. We also investigated the influ-
Abdominal ultrasound is routinely used in pediatric pa-       ence of gender.
tients in the investigation of many diseases and to meas-
ure and monitor normal organ growth [1, 2]. The size of
the liver and spleen can provide important clues about        Methods
the presence of certain pathologies. Accordingly, refer-      Organ sizes are routinely measured at our hospital dur-
ring clinicians frequently ask for liver and spleen size,     ing each abdominal sonography. The measurements are
even though the sonographic measurement of liver size         made during breath-holding in older children and dur-
in particular has certain limitations.                        ing quiet breathing in younger children.
   Organ size is influenced by a number of factors. Age,         For liver and spleen size, we have based our measure-
height, weight, body surface area and ethnicity are           ment technique on the publication by Konus et al. [2].
known influencing factors and has been well docu-             We strictly adhere to this standardized technique in
mented for the kidneys [3–7]. Hence, charts using local       everyday clinical practice enabling comparability in
data are considered the most appropriate for a given          follow-up examinations. Liver measurements are per-
population [3, 8].                                            formed in the supine position, based on external orienta-
   With changes in nutrition and disease profiles,            tion lines. Craniocaudal and anteroposterior dimensions
pediatric populations have also changed over time, pu-        are obtained in the midclavicular plane for the right liver
berty beginning earlier resulting in a changing growth        lobe and midsternal plane for the left liver lobe. Midster-
pattern of their organs. The average age of menarche in       nal plane means that the plane passes through the xiph-
girls declined over the past century from an average age      oid process. Craniocaudal diameters are measured in a
of 16–17 years to 12–13 years [9, 10]. American boys          horizontal line parallel to the abdominal wall (Fig. 1). In
reach puberty 6 months to 2 years earlier than just a few     both planes, the upper margin of the liver is defined as
decades ago [11]. Therefore, the use of contemporary          the uppermost edge under the dome of the diaphragm,
charts is important. The timing of puberty also differs       whereas the lower margin is defined as the lowermost
between ethnicities. African American boys commence           edge of the lobe. A short segment of the most cranial
puberty the earliest, at around 9 years of age, while         part of the liver is sometimes not visible due to the
Caucasians and Hispanic boys commencing on average            acoustic shadowing of the lung, especially in the right
at age 10 years [11]. This further emphasizes the import-     liver lobe. If despite the use of convex probes this
ance of using charts based on data from the same              problem persists, we extrapolate the assumed curva-
ethnicity.                                                    ture of the upper edge of the liver and perform the
   Only a limited number of contemporary studies of           measurement. The anteroposterior diameter is mea-
normative sonographic liver size in children have been        sured at a perpendicular angle to the craniocaudal
published and include a Turkish population aged 0–16          measurement. The midclavicular plane is always used,
years in 1998 [2], a Brazilian population aged 0–7 years      even if the right lobe of the liver reaches far inferiorly
in 2009 [12], an Indian population aged 0–12 years in         (ie. so-called Riedel lobe).
2010 [13], a Nepalese population aged 0–15 years in              Spleen measurements are performed in the supine
2014 [5] and a second Nepalese population aged 0–15           position. The ultrasound probe is positioned in the cra-
years in 2015 [6]. Sonographic charts for liver size for a    niocaudal course of the intercostal spaces at the level of
predominantly Caucasian population are limited. To our        the splenic hilum. Measurements are performed at the
knowledge, only one such study exists, published in           visually maximal distance between the most superome-
1983 with 194 German children aged 0–18 years [14].           dial and inferolateral points of the spleen. The splenic
   The lack of contemporary normative charts has impli-       transverse diameter is measured at right angles to this at
cations for clinical practice: At our pediatric hospital in   the level of the hilum from the medial to the lateral edge
Central Europe with predominantly Caucasian patients,         (Fig. 1). Accessory spleens were not included in the
using the available reference charts, we have found a         measurements.
high frequency of hepatomegaly in the absence of other           The organs were measured on a Philips IU22 (Philips
findings of liver disease. This may lead to unnecessary       Healthcare, Best, the Netherlands) or GE Logic E9 (GE
hepatological and/or hematological consultations and la-      Healthcare, Waukesha, WI) ultrasound systems. Mea-
boratory tests, with associated unnecessary cost and un-      surements were performed by one of two pediatric radi-
certainty for the affected families.                          ologists with 10 and 19 years of experience, personally or
   The aim of this study was to define a contemporary         by one of five registrars with 1–5 years of experience.
normative range of liver and spleen sizes for a predom-       The registrars’ measurements were each reviewed during
inantly Caucasian population and for all pediatric age        the examination by one of the two pediatric radiologists
groups (0–18 years) in correlation with age, height,          and corrected if necessary.
Waelti et al. BMC Pediatrics    (2021) 21:276                                                                                         Page 3 of 10

 Fig. 1 Schematic representation showing the planes and reference points for liver and spleen measurements. Left liver lobe plane is established
 by the midsternal line and right liver lobe plane by the midclavicular line. Spleen measurements are performed in the craniocaudal course of the
 intercostal spaces at the level of the splenic hilum. Measurements are performed between the most superomedial and the most inferolateral
 points of the spleen. The transverse diameters are measured at right angles to the craniocaudal measurements

   We retrospectively searched our RIS/PACS system for                     Statistical analysis
pediatric patients aged 0–18 years who had undergone                       All processing and analysis were carried out with the
abdominal sonography between May and September                             software R, Version 4.0.2. Children were subdivided into
2020 and had no pathologic findings related to the liver                   age groups based on their age in days. The main mea-
or spleen, neither clinically nor sonographically. The                     sures of interest, i.e., right liver lobe craniocaudal diam-
radiological reports were screened for the presence of                     eter and spleen length, were summarized in tables of
normal findings for the liver and spleen. The clinical                     descriptive statistics by age group after checking that
data was screened for the presence of diseases that may                    they were normally distributed within age groups. The
affect the liver and spleen size which included cystic fi-                 dependence of these organ size measures on age and on
brosis, hepatitis, liver steatosis, hemoglobinopathies, on-                body size was further described with Spearman rank cor-
cologic diseases (e. g. leukemia), cardiopathies, previous                 relations and represented graphically using scatter plots
liver surgery, portal vein pathology, scoliosis, growth dis-               with smoothing lines for the 5th, 50th, and 95th percen-
orders, chromosomal anomalies, syndromic diseases and                      tiles obtained through additive quantile regression.
drugs. The clinical data was also screened for patho-                         Because earlier studies suggested a decreasing rate of
logical liver enzymes and cholestasis parameters. If any                   organ growth with age (faster growth in very young chil-
of these abnormalities were present, the child was ex-                     dren), the presence of a non-linearity in the relationship
cluded from the study. Premature births and twins/mul-                     between organ size and age was tested with linear modes
tiple pregnancies were excluded until the age of 2 years.                  that included a quadratic term.
Older, former premature infants and twins were in-                            To compare organ dimensions between genders, gen-
cluded in the study using the chronological age. Chil-                     eralized additive models including gender and a smooth-
dren with urinary tract infection were included. If                        ing term for age were fitted to obtain an estimate of the
several abdominal ultrasounds were performed on a                          mean difference between boys and girls at the same age.
child during the study period, only the first examination                  We also fitted models including a second smoothing
was included. All ethnic groups were included in the                       term for height to see whether differences in organ size
study and non-Caucasians were not excluded.                                persisted after adjusting for differences in body size.
   We then reviewed the image quality and excluded pa-                        To compare age-dependent organ sizes in our study
tients if all hepatic and splenic measurements were not                    population with those of children in other world region,
performed or it was considered of poor quality (e.g., due                  tables of summary statistics for right liver lobe cranio-
to movement artifact or abdominal gas distention or                        caudal diameter and spleen length by age group, includ-
acoustic shadowing of the lung prevented reliable mea-                     ing the minimal and maximal age of each age group,
surements). For the normal echogenicity of the liver, we                   mean organ size, and the standard deviation, were ex-
used the echogenicity of the right renal cortex as a refer-                tracted from publications. These summary measures
ence. Patients with pathological echogenicity of the liver                 were chosen because they were given in all publications.
parenchyma or an abnormal position of the organs were                      The US study [15] provided data separately for boys and
excluded. The patients age at examination, gender,                         girls. These were pooled using weighted means of each
height, and weight was recorded within the RIS/PACS                        gender’s mean and variance (squared SD). Mean age per
system.                                                                    group was calculated as the mean of the group’s age
   Ethics approval was obtained from the local Ethics                      range. Mean organ size was plotted against mean age for
committee.                                                                 each study population. Mean liver size was also plotted
Waelti et al. BMC Pediatrics        (2021) 21:276                                                                                      Page 4 of 10

against mean height (or mean of the age group’s height                               (Fig. 2A, C). The relationship of liver size with body
range) to determine whether differences in liver size                                height and BSA was more linear (Fig. 2B, D). The non-
were associated with differences in body size.                                       linearity of the increase in liver size with age was statisti-
                                                                                     cally significant (p < 0.001) for both dimensions of the
Results                                                                              right lobe and for the craniocaudal dimension of the left
2133 abdominal sonographies were performed during                                    lobe. For the anteroposterior dimension of the left lobe,
the study period. Of these, 1397 (65.5%) sonographies                                the non-linearity was not statistically significant (p =
were excluded for clinical reasons, pathological hepatic                             0.10). For the right lobe’s craniocaudal dimension, the
or splenic findings, inadequate measurement, incomplete                              non-linearity implies a mean growth rate of 1 cm/year
data (missing patient height or weight) or for multiple                              until 3 years but only 0.33 cm/year from 3 to 18 years.
abdominal sonographies performed on the same child.                                     At any given age or body height, the range of nor-
Ultimately, the study population consisted of 736 ab-                                mal values for right-lobe craniocaudal dimension was
dominal sonographies from 736 children (371 (50.4%)                                  approximately 4 cm, or mean ± 2 cm (Fig. 2A, B, C,
boys and 365 (49.6%) girls). The age ranged from full-                               D). The association with weight became weak beyond
term newborn (1 day) to 18.4 years (median 7.3 years).                               30 kg (Fig. 2C), reflecting both the decreasing growth
The median height was 123 cm (range 43–196 cm),                                      rate with age and the weak relationship between
weight 25 kg (2–96 kg), body surface area [16] 0.92 m2                               organ size and BMI.
(0.15–2.28 m2) and BMI: 16.6 kg/m2 (11.2–34.8 kg/m2).                                   Correlations between liver dimensions and age or body
The patient population of our hospital consists of ap-                               size were generally stronger for the right lobe than for
proximately 95% Caucasians, 2% Asians, 1% Africans                                   the left lobe, and stronger for the craniocaudal than for
and 2% others.                                                                       the anteroposterior dimension (Table 2).
                                                                                        The difference between genders was statistically sig-
Liver                                                                                nificant (p < 0.05) for both dimensions of the right liver
Descriptive statistics for the right lobe craniocaudal                               lobe and for the anteroposterior dimension of the left
diameter within each age group are given in Table 1.                                 liver lobe. For these dimensions, the liver diameter of
  There was a non-linear relationship between the cra-                               girls was on average between 0.17 and 0.24 cm smaller
niocaudal diameter of the right lobe and age or weight                               than that of boys. The difference in liver size between
Table 1 Right liver lobe craniocaudal diameter
Age group              Height                  n            Mean              SD           Minimum          Maximum          Percentiles (cm)
                       range (cm)                           (cm)              (cm)         (cm)             (cm)             5th            95th
0–1 mo*                47–55                   22           6.2               0.95         4.7              8                5.2            8
> 1–6 mo               43–72                   49           6.8               0.92         4.6              8.4              5.2            8.3
> 6–12 mo              53–86                   45           7.9               1.34         4.1              10.5             5.4            10.0
> 1–2 yr               71–97                   54           8.4               1.27         5.4              11.4             6.2            10.3
> 2–3 yr               70–110                  33           8.8               1.16         6.4              11.1             7.1            10.8
> 3–4 yr               91–119                  30           9.6               0.90         7.1              11.2             8.3            11.0
> 4–5 yr               90–112                  34           9.9               0.85         7.7              11.8             8.8            11.2
> 5–6 yr               103–128                 53           10.5              1.13         7.3              13.0             8.9            12.1
> 6–7 yr               109.5–142               39           10.9              1.17         8.8              13.4             9.2            13.0
> 7–8 yr               110–144                 45           11.0              1.24         8.5              13.6             9.2            12.7
> 8–9 yr               121–148                 46           12.0              1.40         9.0              15.2             9.9            14.8
> 9–10 yr              121–164                 34           12.0              1.34         9.6              15.8             10.2           13.6
> 10–11 yr             123–162                 42           12.2              1.10         10.1             16.0             10.5           13.7
> 11–12 yr             82–160                  35           12.2              1.47         8.2              15.6             10.2           14.3
> 12–13 yr             94–181                  41           12.5              1.59         7.2              16.5             10.5           14.8
> 13–14 yr             142–171                 32           13.5              1.21         11.6             15.8             11.9           15.6
> 14–15 yr             149–178.5               40           13.7              1.32         11.2             18.0             11.6           15.8
> 15–16 yr             153–196                 28           13.4              1.95         8.7              16.2             9.4            15.9
> 16–18 yr             149–183.2               34           14.3              1.36         11.7             17.0             12.2           16.4
Descriptive statistics for right liver lobe craniocaudal diameter within each age group
Waelti et al. BMC Pediatrics (2021) 21:276 Page 5 of 10
Fig. 2 Scatter plots of right liver lobe craniocaudal diameter against (A) age, (B) body height, (C) weight and (D) body surface area, with
smoothing lines for the 5th, 50th, and 95th percentiles, obtained through quantile regression
genders could be partly, but not fully, explained by the linear (Fig. 3B). Quantile regression indicates a normal
fact that girls were generally smaller than boys (mean range of approximately 4 cm in young children, which
height difference at the same age: − 1.3 cm, mean weight widened up to 6 cm in the oldest children (Fig. 3A).
difference: - 0.61 kg). If body height was included in the There was a significant difference between genders for
generalized additive models, differences between genders both dimensions of spleen size. At the same age, girls had
were reduced by 25–30% and no longer statistically sig- spleens on average 0.24 cm smaller in longitudinal dimen-
nificant (p > 0.05, Table 3). sion and 0.17 cm smaller in transversal dimension than
boys. The gender difference in transversal dimension in-
Spleen creased significantly with age (p = 0.013 for the age*gender
Descriptive statistics for spleen length within each age interaction). The gender difference was slightly reduced if
group are given in Table 4. body height was taken into account (females were then
There was a non-linear relationship between both 0.19 and 0.14 cm smaller in the two dimensions), but still
spleen dimensions and age (Fig. 3A) or weight (Fig. 3C). highly significant (p < 0.001). This was also true if body
The mean increase in spleen length with age was 0.79 cm/ weight was additionally taken into account.
year until 3 years and 0.24 cm/year above 3 years. The
mean growth in transverse dimension with age was 0.25 Discussion
cm/year until 3 years and 0.09 cm/year above 3 years. The Patient demographic (age) and morphometric (height,
relationship of spleen size with body height was essentially weight) factors have been shown to influence liver and
Table 2 Correlations between liver diameters and age or body size
Body Right liver lobe diameter Left liver lobe diameter
measure craniocaudal anteroposterior craniocaudal anteroposterior
Age 0.87 (0.85 to 0.89) 0.81 (0.78 to 0.83) 0.75 (0.71 to 0.78) 0.64 (0.59 to 0.68)
Height 0.89 (0.87 to 0.90) 0.83 (0.80 to 0.85) 0.75 (0.71 to 0.78) 0.65 (0.60 to 0.69)
Weight 0.88 (0.86 to 0.90) 0.85 (0.82 to 0.87) 0.73 (0.69 to 0.77) 0.68 (0.63 to 0.72)
BSAa 0.89 (0.87 to 0.90) 0.85 (0.82 to 0.87) 0.74 (0.70 to 0.77) 0.67 (0.63 to 0.71)
b
BMI 0.44 (0.38 to 0.50) 0.51 (0.45 to 0.57) 0.29 (0.23 to 0.36) 0.46 (0.40 to 0.52)
Spearman rank correlations between liver size and age or body size with 95% confidence intervals obtained through Fisher’s transformation.
a
BSA (Body Surface Area), bBMI (Body Mass Index)Waelti et al. BMC Pediatrics (2021) 21:276 Page 6 of 10
Table 3 Difference of liver diameters between genders children aged 0–18 years [14]. The need for a chart with
Model covariates Age Age and height mainly Caucasian patients is based on the premise that
diff (cm) p-value diff (cm) p-value organ size may be ethnicity-dependent. Ethnical differ-
Right lobe craniocaudal −0.24 0.012 −0.16 0.070 ences in renal size have been shown between African-
American and Caucasian children [20], between Hong
Right lobe anteroposterior −0.21 0.018 −0.16 0.067
Kong children and Western children [3], and between
Left lobe craniocaudal −0.09 0.288 −0.07 0.403
Australian aboriginal and non-Aboriginal children [8].
Left lobe anteroposterior −0.17 0.012 −0.13 0.055 The mean right liver lobe craniocaudal dimension was
Difference between genders as determined from models including smoothing initially similar in the Central European, Turkish and
terms for the covariates (1) age, (2) age and height. The mean difference
between genders (females compared with males) as well as the significance of Nepalese populations but diverged from the second year
this difference are given for each liver dimension of life of the children, being 1–2 cm larger in the Central
European population at a given age (Fig. 4A). Standard
spleen size [2, 5, 6, 12–15, 17–19]. As these factors obvi- deviations within age groups were similar in the Central
ously change during childhood, normative data on organ European and Turkish populations (on average 1.28 and
size in children is of great significance for differentiating 1.16 cm, respectively) and smaller in the Nepalese popu-
between a normal and pathological condition. Only a lation (0.86 cm). The difference between world regions
few charts are available for sonographic liver size in chil- was slightly reduced, but not eliminated, if the right liver
dren. These charts were not established with a mainly lobe craniocaudal dimension was related to body height
Caucasian population. The available, more recent main (Fig. 4B). Thus, for a given body height, children in Cen-
studies include a Turkish population aged 0–16 years in tral Europe had slightly larger livers than children in
1998 (307 patients) [2], a Brazilian population aged 0–7 Turkey and Nepal.
years in 2009 (584 patients) [12], an Indian population By comparing our European study population with an-
aged 0–12 years in 2010 (597 patients) [13], a Nepalese other European (Germany) study population from 1983
population aged 0–15 years in 2014 (225 patients) [5] [14], the slope and the intercept of the linear relation-
and a second Nepalese population aged 0–15 years in ship between body height and the right liver lobe cranio-
2015 (272 patients) [6]. As far as we know, the only Cau- caudal dimension differed clearly between the present
casian study was published in 1983 with 194 German study and the regression line reported for German
Table 4 Spleen length
Age group Height n Mean SD Minimum Maximum Percentiles (cm)
range (cm) (cm) (cm) (cm) (cm) 5th 95th
0–1 mo 47–55 22 4.8 0.6 3.5 6.3 4.1 6
> 1–6 mo 43–72 49 5.7 0.9 3.2 7.4 4.4 6.8
> 6–12 mo 53–86 45 6.2 0.8 4.8 7.8 5.2 7.7
> 1–2 yr 71–97 54 6.6 0.8 4.8 8.8 5.5 8.2
> 2–3 yr 70–110 33 7.4 1.0 4.5 9.0 6.0 8.9
> 3–4 yr 91–119 30 7.5 0.8 6.2 9.7 6.4 8.7
> 4–5 yr 90–112 34 8.1 0.9 6.2 10.6 6.9 9.3
> 5–6 yr 103–128 53 8.2 0.9 5.9 10.4 6.7 9.6
> 6–7 yr 109.5–142 39 8.4 0.8 6.3 10.0 7.4 9.6
> 7–8 yr 110–144 45 8.7 1.2 5.4 11.4 6.8 10.3
> 8–9 yr 121–148 46 9.2 0.9 7.5 11.7 7.9 10.5
> 9–10 yr 121–164 34 9.4 1.1 7.8 12.2 8.0 11.6
> 10–11 yr 123–162 42 9.8 1.2 7.4 13.0 8.3 12.0
> 11–12 yr 82–160 35 9.9 1.4 6.4 13.3 7.8 11.7
> 12–13 yr 94–181 41 10.2 1.1 7.2 12.5 8.8 12.0
> 13–14 yr 142–171 32 10.2 1.3 8.1 12.7 8.2 12.3
> 14–15 yr 149–178.5 40 10.5 1.1 8.6 13.0 8.8 12.2
> 15–16 yr 153–196 28 10.5 1.2 6.9 12.6 8.7 12.2
> 16–18 yr 149–183.2 34 10.9 1.4 8.1 14.3 8.8 13.4
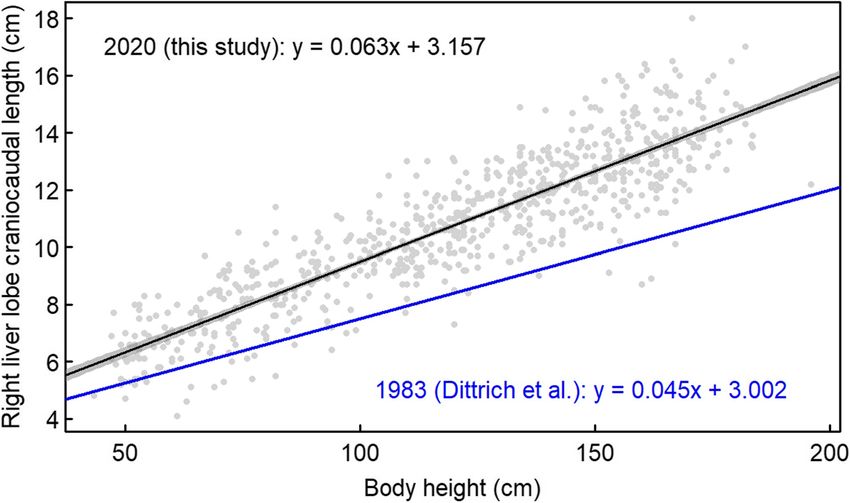
Descriptive statistics for spleen length within each age classWaelti et al. BMC Pediatrics (2021) 21:276 Page 7 of 10 Fig. 3 Scatter plots of spleen length against (A) age, (B) body height, (C) weight and (D) body surface area, with smoothing lines for the 5th, 50th and 95th percentiles, obtained through quantile regression children in 1983 (Fig. 5). Therefore, even for a given the 1998 Turkish population, as it is likely that the liver body height, Central European children had a larger liver size of Turkish children has also changed over time. It in 2020 than they had almost 40 years before. can be concluded that for liver size, local and current Hence, according to our data, liver size also differs be- reference charts should be used as far as possible. tween ethnic groups, not only compared to older studies The liver shape varies to some extent from one patient such as the 1998 Turkish study [2], but also compared to another. The wide range of normal dimensions of our to a recent 2015 Nepalese study population [6]. Com- study and of previous studies reflects that. Nevertheless, parison with the 1983 German study [14] shows that it is important to have reference charts for normal liver liver size has also changed over time within an ethnic dimensions in the pediatric age group to be a guide as to group, possibly due to increasing energy intake and body whether or not the liver size is normal. Liver diameters size. It is possible that the difference with a current can be measured in several ways. In four of the afore- Turkish population would not be as great as it was with mentioned studies [2, 5, 12, 13] the size of the right liver Fig. 4 Mean right liver lobe craniocaudal diameter by age group (A) and by body height (B) in the Central European population studied here and in Turkish and Nepalese populations based on published data. For each age group, liver dimensions are plotted against the mean of the age range (A) and the mean of the height range (B) included in the group
Waelti et al. BMC Pediatrics    (2021) 21:276                                                                                         Page 8 of 10

 Fig. 5 Linear relationship between body height and the right liver lobe craniocaudal diameter in the present study (regression line with 95%
 confidence band) and the regression line reported for children in Germany by Dittrich et al. [14]

lobe is measured in the midclavicular line. However, two                   15 years in 2015 (272 patients) [6], and a Turkish popu-
of these studies [12, 13] corrected the image plane so                     lation aged 0–16 years in 2018 (310 patients) [18].
that the right kidney was still well visualized. Calle-                      The spleen length of Central European, US-American
Torro et al. [17] have, in a review paper, attempted to                    and Turkish children was similar, whereas Nepalese chil-
compare the various methods of liver measurement and                       dren had smaller spleens (Fig. 6). The difference between
collate the data in varied age groups. Ultimately, the                     world regions was reduced, but not eliminated, if spleen
measuring is performed slightly differently in every trial,                length was related to body height. Thus, for a given body
and the patients collated in different age groups, limiting                height, children in Nepal had smaller spleens than chil-
the data analysis.                                                         dren in Turkey and Central Europe. The difference be-
   As in previous studies, the craniocaudal dimension of                   tween boys and girls at a certain age was slightly more
the right lobe of the liver demonstrated the strongest                     pronounced and more consistent in the US-American
correlation with age and body size and is therefore the                    study than in the present study, supporting the existence
most useful practical measurement.                                         of gender differences.
   Similar to Konus et al. [2] and Dittrich et al. [14], we                  When comparing ethnic groups, the difference for the
found that height and body surface area (BSA) had the                      spleen was less pronounced than for the liver; only Nep-
strongest correlation with liver size. In view of its simpli-              alese children had smaller spleens. We consider the use
city, we recommend using the patient height parameter.                     of a local reference chart to be appropriate, but not
   Some publications have concluded that gender impacts                    mandatory.
on renal size [4, 20, 21] and we therefore evaluated the                     The best correlation with spleen size was shown with
impact of gender on liver and spleen size. Konus et al.                    weight, BSA and height, with height and weight being
[2] did not find a statistically significant difference be-                the easiest to use in practice. There was also a significant
tween the two genders in liver and spleen dimensions in                    difference in spleen size between the genders. As with
any age group. This is not consistent with our results.                    the liver, we do not consider this difference relevant for
Both the liver and spleen are statistically significantly                  everyday use.
larger in boys. However, we do not consider the differ-                      In determining the presence of hepatic or splenic
ence significant at a clinical level and a chart of compos-                pathology, the dimensions of the organ are very relevant.
ite data simplifies the clinical application of the chart.                 Whether a routine measurement of the liver and spleen
   There is a greater number of publications, many of                      size should be carried out without evidence of a disease
which are recent, for splenic size. These include studies                  of these organs depends very much on the local practice
of an American population aged 0–17 years in 2004 (454                     and needs of the referring clinicians. Some clinicians will
patients) [15], an Indian population aged 0–12 years in                    use organ size in a similar way to body length, head cir-
2010 (597 patients) [13], a Nepalese population aged 0–                    cumference or body weight, as a marker of normal
Waelti et al. BMC Pediatrics      (2021) 21:276                                                                                                  Page 9 of 10

 Fig. 6 Mean spleen length by age group as well as approximate 5th and 95th percentiles (calculated as mean ± 2 SD) in the Central European
 population studied here and in three other populations based on published data. For each age group, spleen length is plotted against the mean
 of the age range included in the group

development. However, routinely measuring organ size                        Authors’ contributions
means that those with organs in the upper range of nor-                     StW and SM designed the study, performed the ultrasounds, gathered
                                                                            information, analyzed the data, and drafted the manuscript. PM provided
mal in size are at risk of being unnecessarily further in-                  clinical/laboratory data. SG performed the statistical analysis of the data. The
vestigated. We recommend measuring the size of the                          manuscript was subsequently reviewed by TF, SiW, SL, TD and MD. All
liver and spleen and comparing it with the reference                        authors have read and approved the final version of the manuscript.

charts if there are indications of a disease of these organs                Funding
or if a disease should be excluded.                                         The authors state that this work has not received any funding.
   The retrospective design of this study is a limitation,
                                                                            Availability of data and materials
since the measurements were not carried out by more
                                                                            The datasets used and/or analyzed during the current study are available
than one radiologist and therefore no interobserver                         from the corresponding author on reasonable request.
agreement could be determined. However, by having all
measurements performed or checked by one of the two                         Declarations
pediatric radiologists, we believe we have achieved a high                  Ethics approval and consent to participate
level of standardization. A prospective setting in which                    Institutional Review Board approval was obtained (Ethics Committee of
all measurements for each patient are carried out by sev-                   Eastern Switzerland). Written informed consent was waived by the
                                                                            Institutional Review Board (Ethics Committee of Eastern Switzerland).
eral radiologists and with the determination of the inter-
observer agreement should be the goal for a future                          Consent for publication
study.                                                                      Not applicable.

                                                                            Competing interests
Conclusion                                                                  The authors declare that they have no competing interests.
We have established reference charts for pediatric liver                    Author details
and spleen dimensions correlating with age, weight and                      1
                                                                             Department of Radiology and Nuclear Medicine, Children’s Hospital of
body length from a contemporary European, mainly                            Eastern Switzerland, Claudiusstrasse 6, 9006 St. Gallen, Switzerland.
                                                                            2
                                                                             Department of Radiology and Nuclear Medicine, Cantonal Hospital St.
Caucasian population and cover patients aged 0–18                           Gallen, Rorschacher Strasse 95, 9007 St. Gallen, Switzerland. 3University of
years. Gender had a significant influence on organ size,                    Zurich, Faculty of Medicine, Pestalozzistrasse 3, 8091 Zurich, Switzerland.
                                                                            4
but this difference was not felt to be relevant in daily                     Cantonal Hospital St. Gallen, Clinical Trials Unit, Biostatistics, Bedastrasse 1,
                                                                            9000 St. Gallen, Switzerland. 5Division of Pediatric Gastroenterology and
clinical practice. Ethnicity has a greater influence on                     Hepatology, Children’s Hospital of Eastern Switzerland, Claudiusstrasse 6,
liver size compared to spleen size and therefore local ref-                 9006 St. Gallen, Switzerland. 6Department of Diagnostic Imaging, Monash
erence charts should be used when available.                                Health, Monash Children’s Hospital, 246 Clayton Road, Clayton 3168,
                                                                            Australia.

Abbreviations                                                               Received: 17 March 2021 Accepted: 6 June 2021
BMI: Body Mass Index; BSA: Body Surface Area; PACS: Picture archiving and
communication system; RIS: Radiological Information System; SD: Standard
Deviation; US: Ultrasound
                                                                            References
                                                                            1. Groell R, Machan L, Schaffler GJ, Uggowitzer M, Peichel KH. Morphometric
Acknowledgements                                                                measurement of abdominal organs. Comparison of ultrasound and spiral
Not applicable.                                                                 CT. Acta Radiol. 1997;38(6):982–5.
Waelti et al. BMC Pediatrics (2021) 21:276 Page 10 of 10
2. Konus OL, Ozdemir A, Akkaya A, Erbas G, Celik H, Isik S. Normal liver, spleen,
and kidney dimensions in neonates, infants, and children: evaluation with
sonography. AJR Am J Roentgenol. 1998;171(6):1693–8.
3. Luk WH, Lo AX, Au-Yeung AW, Liu KK, Woo YH, Chiang CC, et al. Renal
length nomogram in Hong Kong Asian children: sonographic measurement
and multivariable approach. J Paediatr Child Health. 2010;46(6):310–5.
4. Loftus WK, Gent RJ, LeQuesne GW, Metreweli C. Renal length in Chinese
children: sonographic measurement and comparison with western data. J
Clin Ultrasound. 1998;26(7):349–52.
5. Amatya P, Shah D, Gupta N, Bhatta NK. Clinical and ultrasonographic
measurement of liver size in normal children. Indian J Pediatr. 2014;
81(5):441–5.
6. Thapa NB, Shah S, Pradhan A, Rijal K, Pradhan A, Basnet S. Sonographic
assessment of the Normal dimensions of liver, spleen, and kidney in healthy
children at tertiary care hospital. Kathmandu Univ Med J (KUMJ). 2015;
13(52):286–91.
7. Coombs PR, Lavender I, Leung MYZ, Woods JC, Paul E, Webb N, et al.
Normal sonographic renal length measurements in an Australian pediatric
population. Pediatr Radiol. 2019;49(13):1754–61.
8. Spencer J, Wang Z, Hoy W. Low birth weight and reduced renal volume in
Aboriginal children. Am J Kidney Dis. 2001;37(5):915–20.
9. Buttke DE, Sircar K, Martin C. Exposures to endocrine-disrupting chemicals
and age of menarche in adolescent girls in NHANES (2003-2008). Environ
Health Perspect. 2012;120(11):1613–8.
10. Euling SY, Selevan SG, Pescovitz OH, Skakkebaek NE. Role of environmental
factors in the timing of puberty. Pediatrics. 2008;121(Suppl 3):S167–71.
11. Herman-Giddens ME, Steffes J, Harris D, Slora E, Hussey M, Dowshen SA,
et al. Secondary sexual characteristics in boys: data from the pediatric
research in office settings network. Pediatrics. 2012;130(5):e1058–68.
12. da Rocha APSF SMS, de Oliveira IRS, Widman A, Chammas MC, de Oliveira
LAN, Cerri GG. Sonographic determination of liver size in healthy newborns,
infants and children under 7 years of age. Radiol Bras. 2009;42(1):7–13.
13. Dhingra B, Sharma S, Mishra D, Kumari R, Pandey RM, Aggarwal S. Normal
values of liver and spleen size by ultrasonography in Indian children. Indian
Pediatr. 2010;47(6):487–92.
14. Dittrich M, Milde S, Dinkel E, Baumann W, Weitzel D. Sonographic biometry
of liver and spleen size in childhood. Pediatr Radiol. 1983;13(4):206–11.
15. Megremis SD, Vlachonikolis IG, Tsilimigaki AM. Spleen length in childhood
with US: normal values based on age, sex, and somatometric parameters.
Radiology. 2004;231(1):129–34.
16. Haycock GB, Schwartz GJ, Wisotsky DH. Geometric method for measuring
body surface area: a height-weight formula validated in infants, children,
and adults. J Pediatr. 1978;93(1):62–6.
17. Calle-Toro JS, Back SJ, Viteri B, Andronikou S, Kaplan SL. Liver, spleen, and
kidney size in children as measured by ultrasound: a systematic review. J
Ultrasound Med. 2020;39(2):223–30.
18. Ozdikici M. The relationship between splenic length in healthy children
from the eastern Anatolia region and sex, age, body height and weight. J
Ultrason. 2018;18(72):5–8.
19. Rosenberg HK, Markowitz RI, Kolberg H, Park C, Hubbard A, Bellah RD.
Normal splenic size in infants and children: sonographic measurements. AJR
Am J Roentgenol. 1991;157(1):119–21.
20. Chen JJ, Pugach J, Patel M, Luisiri A, Steinhardt GF. The renal length
nomogram: multivariable approach. J Urol. 2002;168(5):2149–52.
21. Zerin JM, Meyer RD. Sonographic assessment of renal length in the first
year of life: the problem of "spurious nephromegaly". Pediatr Radiol. 2000;
30(1):52–7.
Publisher’s Note
Springer Nature remains neutral with regard to jurisdictional claims in
published maps and institutional affiliations.You can also read