THE ECONOMIC OUTLOOK FOR WASHTENAW COUNTY IN 2019-2021
←
→
Page content transcription
If your browser does not render page correctly, please read the page content below

THE ECONOMIC OUTLOOK FOR
               WASHTENAW COUNTY IN 2019–2021
                                                                           Prepared by
                                                                          Jacob Burton
                                                                   Gabriel M. Ehrlich
                                                                    Donald R. Grimes
                                                             Michael R. McWilliams

                                    Prepared for

                                  March 28, 2019

This report was prepared in connection with a presentation to the Washtenaw Economic
Club. The report is available online at https://lsa.umich.edu/econ/rsqe.html.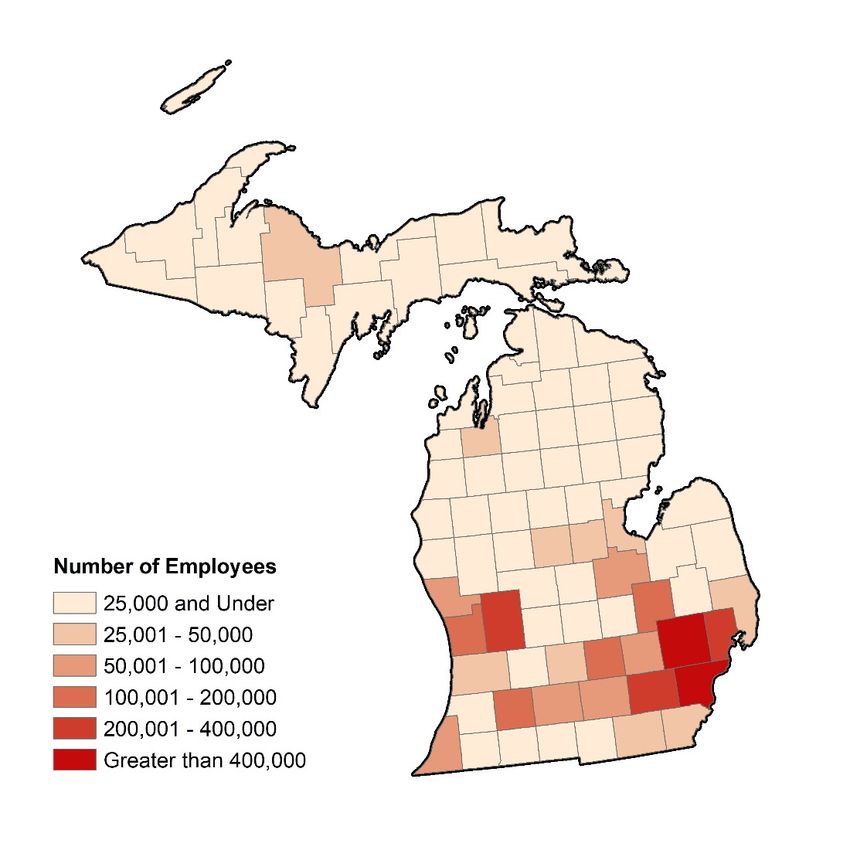
1

Introduction: the Current State of Washtenaw County’s Economy

       Based on data through the second quarter of 2018, we currently estimate that payroll

employment in Washtenaw County grew by 2,300 jobs, or 1.1 percent, for the year. That pace

would be below the average annual growth rate of 1.8 percent the county has enjoyed during its

current expansion. The slowdown was concentrated in the government sector, which in

Washtenaw is dominated by the University of Michigan and Eastern Michigan University. Private

sector employment growth held steady with the pace from 2017. We expect the trend from 2018

to continue over the next few years, with growth continuing at a slower pace than in the earlier

part of the expansion period.

                                        Figure 1
                        Job Growth in Washtenaw County, 1991–2018

       Figure 1 displays payroll employment growth in Washtenaw County over the years 1991–

2018. Based on our estimate for 2018, Washtenaw has added an average of 3,500 payroll jobs per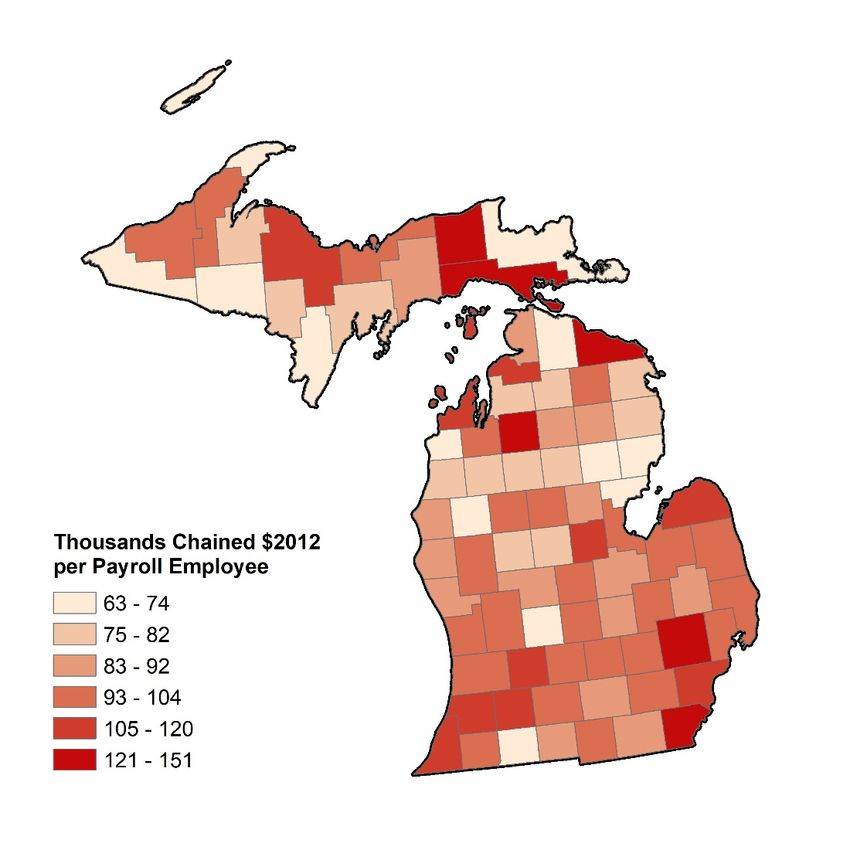
2

year since 2009, or 31,400 in total. Washtenaw’s payroll job count reached a new all-time high of

212,600 jobs in 2018, surpassing the previous year’s record of 210,200 jobs.

       Figure 2 shows Washtenaw’s unemployment rate from 1991–2018 alongside the U.S. rate.

The unemployment rate for Washtenaw ticked down to 3.2 percent in 2018 after holding roughly

flat in the 3.6–3.7 percent range in the preceding three years. Washtenaw’s unemployment rate in

2018 was 5.4 percentage points below the prior peak of 8.6 percent in 2009. Washtenaw has seen

even lower rates in the past, however, with an all-time low of 1.6 percent averaged in 1999. That

experience provides hope that the unemployment rate can continue to fall.

                                    Figure 2
    Unemployment Rates for Washtenaw County and for the United States, 1991–2018

       Real wage growth has been the missing piece of the labor market recovery nationally, and

Washtenaw is no exception. Average real wages for payroll employees have increased by an

average of just 0.4 percent per year since 2009. Wage growth has been even grimmer for blue

collar workers, whose real wages have fallen by an average of 1.5 percent per year in that time.
3

Although we foresee real wage growth remaining mostly sluggish over the next few years, we are

optimistic that it will extend more broadly through Washtenaw’s economy, with blue-collar

workers, highly-educated service workers, and less educated service workers all seeing raises.

        The focus of this report is whether or not Washtenaw County can continue its economic

growth over the next three years. Before turning to our current forecast, however, we look back on

our prior estimates from one year ago and assess how well we have performed.

Review of the Forecast for 2018: A Report Card

        A year ago, we presented our thirty-third annual economic outlook for Washtenaw County.

We can now compare last year’s forecast of employment, unemployment, and inflation for 2018

to the currently estimated outcomes.

        In our forecast last March, we expected that Washtenaw would add 3,721 payroll jobs in

2018, for a growth rate of 1.8 percent. We now estimate that the county added only 2,346 jobs, for

a growth rate of 1.1 percent. Our forecast of job growth was therefore 0.7 percentage points too

high, an overestimate of 1,375 jobs. As shown in Table 1, that miss is similar to our

average absolute forecast error over the past 33 years of 0.6 percentage points, or 6 workers

per every thousand.1

        We always examine where among the major industry divisions our forecast error came

from to get a better sense of current trends in the economy. It turns out that almost all of last year’s

error can be traced to a much weaker performance by state government. Last year we forecast that

employment in state government would grow by 1,973 jobs; instead employment increased by

1
  Our forecast and estimates for 2018 are based on data through the second quarter of 2018. As of the writing of this
report, some preliminary statistics for the third quarter of 2018 have been released, but not yet the industry detail
necessary to update the full forecast. Based on the preliminary data for the third quarter, we expect growth for 2018
to be a bit higher than we have estimated here, which would lead to a smaller forecast error for 2018.
4

only 637. Therefore, all of our last year’s forecast error was caused by an overestimate of growth

in state government employment.

                                                Table 1
                                Report Card: Track Record over the Years

                                      Percentage                                     Percentage
                                    forecast error                                 forecast error
             Year of forecast       for total jobs1         Year of forecast       for total jobs1
                  1986                   -1.4                     2003                  +1.0
                  1987                   -0.8                     2004                  +0.2
                  1988                   -1.2                     2005                  +0.42
                  1989                   -0.6                     2006                  +0.7
                  1990                  +0.8                      2007                        0
                  1991                  +1.4                      2008                  +0.6
                  1992                  +0.5                      2009                  +1.0
                  1993                  +1.3                      2010                   -2.3
                  1994                    n.a.                    2011                   -0.6
                  1995                  +0.2                      2012                   -0.4
                  1996                  +0.3                      2013                        0
                  1997                  +0.4                      2014                  +1.1
                  1998                   -0.5                     2015                  +0.2
                  1999                      0                     2016                   -0.4
                  2000                      0                     2017                   -0.3
                  2001                  +0.3                      2018                  +0.7
                   2002                 +0.3
             1
               Positive numbers indicate that the forecast was too high; negative, too low.
             2
               Estimate.

                             Average absolute forecast error 1986–2018: 0.6%

                                                          Forecast             Actual
                                                           2018                2018
                       Unemployment rate                    3.3%                3.2%
                       Consumer inflation rate              2.6%                2.4%
5

        We were virtually spot-on in forecasting job growth in the private sector. We forecast the

private sector would grow by 1,665 jobs, and we now estimate that the number of private sector

jobs grew by 1,646. Within the private sector, we underestimated employment growth in the

goods-producing sector, especially the motor vehicle manufacturing sector, which added 618 jobs

instead of losing 91 jobs as we expected. We are not certain where those motor vehicle

manufacturing job gains occurred. It is possible that some temporary employees were converted

to permanent employees in one of our auto parts manufacturing plants.2 Within the private service-

providing sector, our largest error was in retail trade. Rather than holding essentially flat, as we

had expected, employment in this sector fell by 600. Despite the closures of some iconic stores,

our forecast for department stores and other general merchandise stores was actually too strong:

the industry shed only 16 jobs versus the 75 we expected. Instead, the large and unanticipated job

losses in the retail sector were in food, drug, and clothing stores.

        The bottom of Table 1 shows the forecast and actual values for the unemployment rate and

the local consumer price inflation rate in 2018. We had forecast an average unemployment rate of

3.3 percent for the year, one-tenth of a percentage point higher than the actual rate of 3.2 percent.

We did similarly well in our forecast of the local consumer inflation rate for 2018. We had forecast

a rate of 2.6 percent for the year, two-tenth of a percentage point higher than the realized rate of

2.4 percent. The realized rate of local inflation represents a significant pickup from the rates of

negative 1.4 percent in 2015 and positive 1.6 percent in 2016. It reflects a smaller pickup in

national inflation over the same period, along with a tighter local labor market.

2
 Temporary employees are counted in the employment services industry, which is part of the service sector of the
economy. Consistent with this potential explanation, employment in the employment services industry declined
unexpectedly in 2018.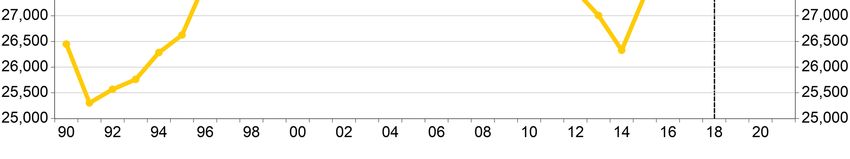
6

National Outlook: 2019–2021

        Figure 3 displays our forecast of real GDP growth through 2021.3 The yellow bars display

annual average growth rates, while the blue line displays quarterly rates. Real GDP grew by 2.9

percent in 2018, the strongest reading in thirteen years. GDP growth slowed during the course of

2018, however, from an annual rate of 4.2 percent in the second quarter to 2.6 percent in the fourth

quarter.

        We expect GDP growth to decelerate over the next few years as the temporary boost from

the tax cuts in the Tax Cuts and Jobs Act of 2017 and the extra spending from the fiscal 2018 and

2019 federal budgets fades. Our forecast assumes no further tariffs imposed by the United States

or retaliatory tariffs by other nations and very gradual further monetary tightening from the Federal

Reserve.

                                              Figure 3
                                 Growth of Real U.S. GDP, 2017–2021

3
 Gross Domestic Product (GDP) comprises all of the goods, services, and structures produced in the economy. Real
GDP is adjusted for price inflation to be expressed in chained 2012 dollars.
7
Figure 4 shows that as the economy slows over our forecast horizon, so do U.S. light vehicle sales.
Total light vehicle sales set an all-time high of 17.5 million units in 2016, but that pace now feels
like a distant memory. Sales fell to 17.2 million units in 2018, and we are projecting them to total
16.9 million this year before sliding to 16.8 million in 2020 and 16.5 million in 2021. The decline
is driven by automobiles, as light truck sales, which include minivans, SUVs, and CUVs, continue
to eke out gains. We see the light truck share of vehicle sales edging up to 76 percent of the market
by the end of 2021.
Figure 4
U.S. Light Vehicle Sales, 1991–2021
The decline in light vehicle sales over our forecast period obscures a more heartening trend,
which is that real U.S. light vehicle output continues to inch up. The difference between the trends
for sales and output arises from the diverging fortunes of automobiles and light trucks seen in
Figure 4. Because light trucks contain much more value added than automobiles, the continued
growth of light truck sales outweighs the decline in auto sales when it comes to vehicle output.8
Figure 5 shows our forecast for real U.S. light vehicle output, which grows from 546 billion
chained 2012 dollars in 2018 to 565 billion dollars in 2021, for a modest average growth rate of
1.2 percent per year.
Figure 5
Real U.S. Light Vehicle Output, 1991–2021
Figure 6 displays our forecast for Detroit Three light vehicle sales. The Detroit Three share
of the light vehicle market fell from 42 percent in 2017 to 41.7 percent last year, and we see it
falling further to 41.4 percent in 2019. It then edges back up to 41.5 percent over the next two
years. When combined with the falling size of the overall market, our forecast implies that Detroit
Three light vehicle sales decline from 7.2 million units in each of 2017 and 2018 to 7.0 million
units per year in 2019 and 2020 and 6.8 million units in 2021. Our forecast makes several relatively
optimistic assumptions: that the contract negotiations between the United Autoworkers and the
Detroit Three automakers are completed without a prolonged work stoppage; the United States-
Mexico-Canada Agreement is ratified successfully in all three nations; the Trump administration9
does not impose new tariffs on automotive imports from the European Union; and the trade
tensions with China do not result in any substantial new tariffs.
Figure 6
Total vs. Detroit Three U.S. Light Vehicle Sales, 2017–2021
Washtenaw County Outlook: 2019–2021
Our economic outlook for Washtenaw County through 2021 encompasses employment,
unemployment, inflation, and real wages. First, we evaluate the county’s prospects for job growth
in total, putting that in context with recent job market developments.
Employment
The Washtenaw County economy is now well into its tenth year of expansion since the
previous recession’s low point in the summer of 2009. The expansion to date has been brisk, with
31,391 job additions from calendar year 2009 to 2018, a growth rate of 1.8 percent per year. Over
that same period, the county’s job growth outpaced both the nation’s average rate of 1.4 percent
per year and Michigan’s 1.5 percent per year.10
The county economy added 2,346 jobs in 2018, for an increase of 1.1 percent, the second
smallest annual job gain since the end of the recession. As noted, though, we see job growth in the
county continuing through 2021, bringing the span of the expansion to twelve years. That would
be the longest sustained employment expansion in the county’s history since at least 1969, when
annual employment data was first collected at the county level.
Figure 7
Job Growth in Washtenaw County, 1991–2021
As the labor market approaches full employment, we see job growth continuing at around
the pace seen in 2018. Figure 7 shows that we are forecasting that the county will add a total of
7,244 jobs over the next three calendar years: 2,090 jobs in 2019; 2,628 in 2020; and 2,626 in
2021. Those additions translate to an average rate of 1.1 percent per year, the same as the county
experienced in 2018.
To provide additional context for recent history and our forecast, Figure 8 shows the
historical and forecast quarterly path of total jobs from the start of 2000 to the end of 2021 for both11
Washtenaw County and the state of Michigan. For comparison purposes, both paths are indexed
to equal 100 in the second quarter of 2000, which represents Michigan's previous peak employment
level.4
Figure 8
Total Jobs in Washtenaw County, 2000Q1–2021Q4
From its peak employment quarter in the spring of 2001 (index value of 100) to its trough
in the summer of 2009, the county lost 15,705 jobs, with 64 percent of the losses occurring in the
two-year period from summer 2007 to summer 2009. Washtenaw recovered to its previous peak
employment level in the first quarter of 2013. It has added 32,247 jobs from the employment trough
in summer 2009 to the end of the currently published data in the second quarter of 2018. From
then to the end of 2021, we are forecasting that the county will create an additional 8,841 jobs,
4
An index value of 90 indicates that employment in a given period is 90 percent of its level in the base period, or 10
percent lower than the base-period value. An index value of 110 indicates a level of employment that is 10 percent
higher than its level in the base period.12
thus cumulating to 40,088 job additions from the quarterly bottom of the downturn through the
end of 2021.
In contrast, Michigan as a whole is not forecast to regain its previous peak employment
level even by the end of our forecast period in 2021. Statewide employment fell more sharply
during the downturn on a proportional basis than employment in Washtenaw, and it has also been
slower to recover. Michigan’s employment index reached a low point of 81.7 in the summer of
2009. Washtenaw County’s employment index also reached its low point in that quarter, but at a
higher index value of 92.2. From then through the end of 2018, Michigan’s employment index
recovered to a value of 94.8, indicating that the state remained 5.2 percent below its peak
employment level. In contrast, we estimate that Washtenaw’s employment level exceeded its
previous peak by 8.7 percent at the end of last year. We expect the gap between the two indices to
continue growing through the end of 2021, when Washtenaw’s employment level will be 12.6
percent higher than in spring 2001, while the state’s employment level will remain 3.3 percent
lower.
Real Wage
Figure 9 shows the average real wage for all workers in Washtenaw County from 1990 to
2021 (all wages reported in this section have been adjusted for inflation using the national
Consumer Price Index and are expressed in 2017 dollars).5 Real wage growth for all workers in
5
The wage series are averages per worker. The nominal series is from the Bureau of Labor Statistics Quarterly Census
of Employment and Wages and does not include variations in hours worked, a measure that is not available to us in
the necessary detail. This is likely less of a consideration over the longer term than at the business cycle frequency.
On the other hand, these data include all payroll income, including profit sharing bonuses, overtime and holiday pay,
and other irregular income, which is not included in the more commonly cited Bureau of Labor Statistics Current
Employment Statistics hourly and weekly wage data. Wages are adjusted for inflation using the U.S. Consumer Price
Index for all urban consumers.13
the county averaged 1.3 percent per year between 1990 and 2000, before slowing to only 0.3
percent growth per year between 2000 and 2007. Average real wages in the county reached a peak
of $58,437 in that year. They then began to fall during and after the Great Recession, reaching a
low of $54,203 in 2011 (a decline of 7.2 percent over that four-year period). Real wages grew
slowly, by 0.5 percent per year, over the next three years, to an average of $55,102 in 2014.
Between 2014 and 2018, real wages accelerated to an average of 1.2 percent per year, helped by
very modest price inflation. The average real wage in the county reached $57,845 in 2018, slightly
below the peak in 2007. We estimate that the real wage will increase by 1.6 percent in 2019, to
$58,758, slightly above 2007 levels. We are forecasting that accelerating consumer price inflation
will constrain real wage growth to only 0.4 percent in both 2020 and 2021, so that the average real
wage will reach $59,264 in 2021.
Figure 9
Average Real Wage in Washtenaw County, 1990–202114
Figure 10 shows the average real wage from 1990 to 2021 for two industry group
combinations. The first is traditionally blue-collar industries, and the second is service-providing
industries that tend to employ highly-educated workers. We will call the latter group higher-
education service industries.6 In 1990, the average real wage in the blue-collar industries ($69,545)
was about one-third higher than the average real wage in the higher-education service industries
($51,858). The average real wage in the blue-collar industries increased by 1.0 percent per year on
average from 1990 through 2007, reaching a peak of $81,935 in 2007. With the onset of the Great
Recession, the average blue-collar wage began to fall sharply, partly because of job losses in high-
paying industries such as motor vehicle manufacturing. Average real wages reached a low of
$64,354 in 2013, 7.5 percent below 1990 levels. Since 2013, the average blue-collar wage has
increased slowly, by 0.2 percent per year on average. In 2018 average wages in these industries
($64,857) remained below 1990 levels. We expect that over the next three years the average blue-
collar wage will grow at a faster clip (0.8 percent per year), but that by 2021 real wages will still
remain 4.4 percent below 1990 levels and 18.8 percent below the 2007 peak levels.7
6
Blue-collar industries include natural resources and mining, construction, manufacturing, and transportation.
High- education service industries include government, education and health services, professional services and
corporate headquarters, wholesale trade, financial activities, and information services.
7
The average wage in any industry group reflects both the wages in a detailed industry and the share of the group
accounted for by the detailed industry. Thus, a change in the mix of industries over time can cause a change in the
average wage, apart from any change in actual wage levels. Part of the reason for the large decline in the average wage
in the blue-collar industries after 2007 was the disproportionate loss of jobs in relatively high-wage industries such as
motor vehicle manufacturing. Another reason for the decline in blue-collar wages is that the wages in the auto industry
itself also fell sharply.15
Figure 10
Average Real Wage in Washtenaw County, 1990–2021,
Blue Collar and Higher-Education Service Industries
In contrast, the average wage in the higher-education service industries grew relatively
steadily during the historical period. The average wage in those industries overtook the average
wage in the blue-collar industries for the first time in 2015, reaching $66,093. We forecast average
wages in the higher-education service industries to grow by an average of 0.7 percent per year
between 2018 and 2021. We expect the average wage in these industries to reach an all-time high
of $68,231 in 2021.
Figure 11 shows the average real wage for service-providing industries that tend to employ
workers with less education, which we will call lower-education service industries.8 We show
wages for this industry group on a separate graph because they are substantially lower than wages
in the other two industry groups.
8
Such industries include retail trade, leisure and hospitality services, business support services such as temporary help
services, and the miscellaneous other services category, which includes repair and personal services.16
Figure 11
Average Real Wage in Washtenaw County, 1990–2021,
Lower-Education Service Industries
The average real wage in the lower-education service industries grew steadily from 1992
through 2002, when it reached a peak of $31,955. Wages in these industries then generally declined
through 2014, to an average of only $26,328. Between 2014 and 2018, real wages grew at an
average rate of 1.4 percent per year, helped by low price inflation and increases in Michigan’s
minimum wage. We anticipate that wage gains in these industries will continue over the next three
years, with real wage growth averaging 1.0 percent per year. Nonetheless, we forecast that by
2021, average real wages ($28,726) in the low-education service industries will remain 10 percent
below their peak level in 2002.
In summary, the 2000s have been a mixed bag for real wages in Washtenaw County. We
estimate that the average real wage across all industries increased by a total of 1.1 percent from
2000 to 2018, an average rate of less than 0.1 percent per year. This weak growth reflects the fact
that the average real wage actually fell during that time interval in two broad industry groups, blue-17
collar industries (–0.8 percent per year) and lower-education service industries (–0.5 percent per
year). Higher-education service industries (the largest of the three industry groups), on the other
hand, experienced sustained real wage growth of 0.4 percent per year. The good news is that we
are forecasting real wage growth in all three industry groups over the forecast period, with the
most rapid growth expected in the lower-education service industries.
Employment by Industry
Table 2 divides the total job movements we project over our forecast period among twenty-
three major industry divisions.9 The table includes, for each industry, our preliminary estimates of
the level of employment in 2018; the forecast change for each of 2019, 2020, and 2021; and the
cumulative change over the three-year period 2018–21. The table also includes the average annual
wage for each industry category in 2017, as does the appendix.10 Total employment is forecast to
grow by 2,090 jobs, or 1.0 percent, in 2019. Job growth then accelerates to about 1.2 percent per
year in each of 2020 and 2021, generating job gains of 2,628 and 2,526, respectively.
Over one-third (36 percent) of all job gains in Washtenaw County over the next three years
are expected to occur in the government sector. We expect that federal government employment
will decline by 117 jobs over the next three years, albeit with a temporary spike in 2020 because
of the employment of census workers in the county. Employment in local government, which
includes public K-12 education and Washtenaw Community College, lost jobs every year between
2010 and 2016, even as the economy overall was adding jobs. This period of job losses finally
came to an end in 2017, when local government added 285 jobs, followed by a gain of 156 jobs in
9
The appendix divides the job movements into 145 finer divisions.
10
The historical employment data are from the Bureau of Labor Statistics Quarterly Census of Employment and Wages.
The average annual wage includes both full- and part-time workers, weighted equally. Consequently, the average
wages for industries that employ a disproportionately large number of part-time workers, such as retail trade and
leisure and hospitality, are much lower than they would be if the wages were calculated only for full-time workers.18 2018. We anticipate that local government will continue to grow over the next three years, contributing a total of 245 job additions, for an average growth rate of 0.7 percent per year.
19

                                                             Table 2
                              Forecast of Employment in Washtenaw County by Major Industry Division
                                                           2018–2021
                                                                                                                  Average
                                                                                 Employment Change                Annual
                                                       Estimate                        Forecast                    Wage
                                                        2018           '18–'19   '19–'20      '20–'21   '18–'21    2017
TOTAL JOBS (Number of persons)                         212,561          2,090     2,628         2,526    7,244    $57,706
 (Annual percentage change)                               (1.1)         (1.0)     (1.2)        (1.2)
 TOTAL PRIVATE                                          132,436        1,352     1,596        1,670     4,618      55,554
  GOODS-PRODUCING                                        19,537          158        84           41       283      64,279
   Natural resources, mining, construction                4,482          133       134          123       391      60,351
   Manufacturing                                         15,055           26       -50          -82      -107      65,453
    Motor vehicles                                        4,756          -41       -57          -72      -170      63,245
    Other manufacturing                                  10,299           67         6          -11        62      66,342
  PRIVATE SERVICE-PROVIDING                             112,898        1,194     1,512        1,629     4,335      54,097
   Trade, transportation, and utilities                  24,645          120       205          219       544      45,970
     Wholesale trade                                      5,466          148       152          151       450      75,940
     Retail trade                                        15,663          -90       -35          -19      -145      30,266
     Transportation, warehousing, and utilities           3,516           62        89           87       238      73,385
   Information                                            4,568           33        41           49       123      94,939
   Financial activities                                   6,462           13        58           63       134      72,763
   Professional and business services                    27,495          459       502          500     1,461      78,591
     Professional, scientific, and technical             16,949          470       445          436     1,352      96,179
     Management of companies and enterprises              1,224           40        11           -1        50     173,252
     Administrative support and waste management          9,323          -51        46           65        60      36,405
   Private education and health services                 26,683          300       393          462     1,156      52,250
   Leisure and hospitality                               17,772          252       275          283       810      19,766
   Other services                                         5,078           20        37           54       111      31,744
   Unallocated private services                             195           -5         0            0        -5      60,659
 GOVERNMENT                                              80,125          738     1,033          855     2,626      61,249
  State government                                       64,497          679       898          921     2,499      61,976
20
Employment growth in state government, which includes the University of Michigan,
Michigan Medicine, and Eastern Michigan University, slowed in 2018 to 1.0 percent from 3.4
percent in 2017. The industry’s average annual growth rate between 2000 and 2017 was 2.4
percent, also substantially higher than 2018’s rate. We are forecasting that employment gains will
remain subdued over the next three years, cumulating to 2,499 jobs, for an average growth rate of
1.3 percent per year.
The private goods-producing sector is forecast to add only 283 jobs over the next three
years, as job losses in transportation equipment manufacturing (–170) partially offset modest job
gains in other manufacturing (62) and relatively strong job gains in natural resources and
construction (391).
The manufacturing industries that we anticipate will gain the most jobs over the next three
years are fabricated metals manufacturing (81), plastic products manufacturing (59), machinery
manufacturing (55) and food processing (53). In addition to transportation equipment,
manufacturing industries that we expect to lose jobs include printing (–146) and computer and
electronic products manufacturing (–82).
Job growth in the private service-providing sector in 2019 is forecast to register 1,194 (1.1
percent), an acceleration from the gain of 830 (0.7 percent) in 2018. Job growth in the sector
continues to accelerate to 1,512 in 2020 and 1,629 in 2021.
Retail trade is forecast to lose 145 jobs over the next three years (–0.3 percent per year).
The largest job losses are expected at department and other general merchandise stores (–118),
sporting goods, hobby and book stores (–70), and gasoline stations (–22). We are forecasting very
modest job gains over the next three years at motor vehicle dealers (18), building materials stores
(18) and non-store retailers (15). Multiple factors contribute to the weak job growth we foresee in21
the retail sector. Online retailers and big box stores employ fewer workers than traditional retailers,
while labor costs in the sector are rising, driven by a tighter labor market and an increasing
minimum wage.
Elsewhere in the trade, transportation, and utilities super-sector, wholesale trade is forecast
to see above-average growth, with 450 job gains over the next three years (an average pace of 2.7
percent per year), as is transportation services (251 jobs over the period, an average pace of 2.6
percent per year). On the other hand, employment at utilities is forecast to decrease by 12 jobs over
the next three years.
Information services is forecast to see relatively weak job growth over the next three years,
cumulating to 123 jobs (0.9 percent per year). Financial activities is forecast to have even weaker
job growth, cumulating to 134 jobs (0.7 percent per year). The weakness in the financial sector is
caused by a substantial decline in employment in the credit intermediation industry. This industry,
which includes both depository (banking) and non-depository credit granting establishments, is
forecast to lose 132 jobs over the next three years. The rest of the financial activities sector,
including insurance and real estate, should see moderate job growth over the next three years.11
The professional and technical services industry is forecast to add 459 jobs this year,
followed by job gains of 502 in 2020 and 500 in 2021. Over the three-year forecast period,
professional services is forecast to add 1,461 jobs (2.6 percent growth per year). With this gain,
professional services accounts for about one in every five jobs created in the county over the next
three years, more than double its share of the county’s employment base in 2018.
11
Note that these job gains do not show all of the improvement in the local residential real estate industry, because
real estate agents are predominantly self-employed, and thus are not counted in the data on establishment employment
shown here.22
Within the professional and technical services industry category, the largest job gains over
the next three years are in computer systems design (305), testing laboratories (304), other
professional services (291), and physical, engineering, and biological research (277). The
professional and technical services industry category pays very well, an average of $96,179 per
year in 2017. It also tends to employ relatively well-educated workers, those with at least a
bachelor’s degree. Washtenaw County’s success in creating jobs in this industry category has been
an important driver, along with the significant growth of state government, of the county’s
economic prosperity over the past several decades.
The management and corporate headquarters industry (average pay in 2017 of $173,252)
is quite small in Washtenaw County, but it is forecast to add 50 jobs over the next three years. The
administrative support and waste management industry adds only 60 jobs over the next three years
(0.2 percent per year). This weak performance reflects job losses in 2019 and small job gains in
2020 and 2021. Most of the net job gains over the next three years will be in waste management,
as employment in employment services, which mostly consists of temporary help agencies, is
forecast to decline slightly.
The private education and health services industry is forecast to add jobs at an accelerating
pace over the next three years, with job gains of 300 in 2019, 393 in 2020, and 462 in 2021,
cumulating to a total job gain of 1,156 over the next three years. Private education services account
for only 11 of these new jobs; virtually all of the job gains are in private health care and social
assistance (1,145).
Nearly one-half of the employment gains in private health care over the next three years
are in physicians’ offices (561 jobs or 3.8 percent per year). Over this period, employment in23
private hospitals is forecast to increase by 233 (1.1 percent per year), while employment in home
health care services is forecast to decline by 34.
Employment in the leisure and hospitality sector is forecast to grow by 810 jobs over the
next three years (1.5 percent per year). This sector includes arts and recreation; food services and
drinking places; and hotels. The arts and recreation industry, which is projected to gain 192 jobs
over the forecast horizon, includes businesses such as golf courses, fitness facilities, and the
performing arts.12
Employment at local hotels and other lodging places jumped by 104 jobs in 2016 and 143
jobs in 2017 as some new hotels opened, but declined by 21 jobs in 2018. We expect employment
at local lodging places to decline slowly over the next three years for a total loss of 22 jobs. Full-
service restaurants add 305 jobs over the next three years (1.6 percent per year). Employment in
limited-service restaurants (better known as fast-food restaurants) also grows 1.6 percent per year,
cumulating to a total gain of 237 jobs.
The miscellaneous other services sector includes a grab bag of individual industries such
as repair services, including motor vehicle repair shops; personal services, such as hair salons and
dry cleaners; membership organizations; and private household services. Collectively, these
industries add 111 jobs (an increase of 0.7 percent per year) over the forecast period.
Unemployment
Figure 12 displays our forecast for the unemployment rate in Washtenaw County and the
United States through 2021. The local unemployment rate declined from 3.6 percent in 2017 to
3.2 percent last year, after staying stuck in the 3.6–3.7 percent range since 2015. The national
12
Much of the last category resides in public universities in Washtenaw County, and thus is not counted in the private
sector.24
unemployment rate also fell rapidly from 2017 to 2018, from 4.4 percent to 3.9 percent. Going
forward, we expect the unemployment rate in Washtenaw to continue falling, to 2.8 percent in
2019, 2.6 percent in 2020, and 2.5 percent in 2021. That would be the county’s lowest
unemployment rate since the year 2000, but would still be nearly a percentage point higher than
the county’s all-time low unemployment rate of 1.6 percent recorded in 1999. In contrast to our
forecast for Washtenaw County, we expect the national unemployment rate to settle just a bit below
its 2018 level over the next few years, at 3.7 percent in 2019 and 3.6 percent in 2020 and 2021.
Figure 12
Unemployment Rates for Washtenaw County and the United States, 1991–2021
Inflation
Figure 13 displays our forecast of local inflation, measured by the growth rate of the Detroit
Consumer Price Index (CPI).13 Local and national inflation registered 2.4 percent in 2018, pushed
upward by a large increase in energy prices that persisted through most of the year. Energy prices
13
Consumer price data are compiled at the regional level; they are not available for the county in isolation.25
tumbled toward the end of the year and the start of 2019, which should cause inflation to dip this
year. We are forecasting national inflation of 1.7 percent and local inflation of only 1.3 percent for
the year. Inflation then inches back up toward the Federal Reserve’s target of 2.0 percent as energy
prices stabilize; we are forecasting local inflation of 2.0 percent per year in 2020 and 2021, while
national inflation registers 2.0 percent in 2020 and 2.1 percent in 2021.14
Figure 13
Inflation Rate, National and Detroit CPIs, 1991–2021
Washtenaw County Gross Domestic Product (GDP)
In December 2018, the Bureau of Economic Analysis released prototype statistics for Gross
Domestic Product (GDP) by county.15 The estimates currently cover only the years 2012 to 2015,
and the next release is not due until December of 2019. Therefore, as of now the historical time
14
The Federal Reserve targets an alternative measure of price inflation, the Personal Consumption Expenditures (PCE)
Chain-Type Price Index published by the Bureau of Economic Analysis. It has historically tended to run about 0.4
percentage points below the Consumer Price Index, so the Federal Reserve’s 2 percent target for PCE inflation
translates to roughly 2.4 percent for CPI inflation. That means we are forecasting inflation to run slightly below the
Federal Reserve’s target in 2020 and 2021.
15
The statistics are available at https://www.bea.gov/data/gdp/gdp-county.26
series is not long enough, and the data releases are not timely enough, to include county-level GDP
in our forecast. Nonetheless, the data contain valuable insights regarding Washtenaw County’s
economy. With that in mind, in this section we explore the new county-level GDP data and what
they tell us about Washtenaw County’s economy.
Gross domestic product measures the value of all of the goods and services produced in a
particular location over a specific time period; real GDP adjusts that measure for inflation. The
BEA adjusts all of the real GDP statistics reported in this section to be expressed in 2012 chained
dollars using a different methodology and price index than we used to adjust wages earlier in the
report. Therefore, the two sets of numbers are not exactly comparable.
The left panel of Figure 14 displays a map of county-level real GDP in 2015 for all of the
counties in Michigan. Over three-fifths (62 percent) of the state’s GDP was produced in the five
largest counties: Kent, Macomb, Oakland, Washtenaw, and Wayne. Oakland’s real GDP was $101
billion in 2015, making it the only county in Michigan with a GDP of over $100 billion. Wayne
was second among Michigan counties, with GDP of $81 billion, followed by Kent and Macomb,
with GDPs of $37 billion and $32 billion, respectively. As of 2015, Washtenaw County’s real GDP
was just over $20 billion, fifth highest out of the 83 counties in Michigan.
The right panel of Figure 14 displays a map of county-level real GDP growth rates over
the period 2012–2015. Washtenaw’s average growth rate was 1.3 percent per year in that period,
just above Michigan’s statewide rate of 1.2 percent. Washtenaw ranked 29th in the state over that
period, roughly in line with Oakland (27th), Wayne (33rd), and Macomb (37th), but a bit behind
Kent (18th). Washtenaw is one of 25 counties in Michigan that experienced real GDP growth in
each year from 2013–2015.27
Figure 15 depicts 2015 payroll employment by county in the left panel and real 2015 GDP
per payroll worker in the right panel. Similarly to the distribution of real GDP, nearly three-fifths
(57 percent) of Michigan’s payroll employment can be found within its five largest counties.
Washtenaw’s count of 202,000 payroll employees as of 2015 was also the fifth-highest in the state,
behind the same counties.
Dividing Washtenaw’s real GDP by its payroll employee count implies that Washtenaw
had a real GDP of $98,936 per payroll employee in 2015. That ranked 27th out of the Michigan
counties. (Luce County, in the Upper Peninsula, ranked highest on that measure, with a real GDP
per worker of over $150,000, but the small size of the Luce and many of the other highly ranked
counties and the disproportionately large presence of mining and utility activity in those counties
means their relatively high rankings should be taken with a grain of salt.16) Washtenaw also lagged
its larger county peers in Michigan on this measure, however: Oakland registered real GDP per
worker of $143,085, and Wayne registered $115,369. Macomb’s real GDP per worker of $102,844
and Kent’s level of $100,244 were closer to, but still higher than, Washtenaw’s.
Although the data in the prototype statistics is limited, we speculate that a relatively large
number of part-time student employees may explain why otherwise prosperous Washtenaw
County lags its peers in real GDP per worker. Consistent with that hypothesis, Washtenaw’s real
GDP per government employee was only $75,500 in 2015, ranking 46th out of Michigan’s 83
counties. Kent ($92,000), Macomb ($110,300), Oakland ($95,200), and Wayne ($99,200) all
comfortably exceeded Washtenaw on this measure. Washtenaw’s private sector real GDP per
worker was $112,800 in 2015, ranking 14th among all counties in Michigan. That level was higher
16
Detailed Industry data are not available by county, but statewide in 2015 real GDP per mining worker ($342,900)
was three times the overall average ($110,200), and real GDP per utility worker ($446,400) was four times the overall
value.28 than in Kent ($100,900) and Macomb ($102,000), although it was a bit lower than in Wayne ($117,600) and substantially lower than in Oakland ($146,400).
29

           Figure 14: Real Gross Domestic Product by Michigan County

                                             Percentage Change Real GDP
2015 Real GDP
                                             2012–2015 (annualized)
30
Figure 15: Payroll Employment and Real GDP per Worker by Michigan County
2015 Payroll Employment 2015 Real GDP per Worker31
Conclusion
Although Washtenaw County grew more slowly in 2018 than it had over the preceding few
years, a slowdown was bound to come sometime in the face of an increasingly tight labor market.
We do not believe that last year’s moderation in job growth portends a contraction after nine
consecutive years of growth. Instead, we are calling for three more years of growth at roughly the
pace seen in 2018, along with falling unemployment and real wage growth, that while moderate,
spreads to a large proportion of the economy.
Our relatively upbeat outlook for the Washtenaw economy assumes a national economy
that also continues to deliver moderate growth. A national recession, which is not in our baseline
forecast, would present a considerable headwind to Washtenaw’s growth prospects. Likewise, a
major disruption to international trade or a major slowdown in the state’s manufacturing sector are
potential risks to our forecast. That being said, our baseline forecast is that Washtenaw County
will enjoy at least three more years of positive economic news, extending its current growth streak
to twelve calendar years.
As Washtenaw’s expansion matures, growth slows to a moderate average rate of 1.1
percent per year over our three-year forecast period. That translates to a total of 7,244 job additions.
The tight labor market supports real wage growth of 0.8 percent per year over the forecast period,
higher than the historical average of 0.5 percent from 1991–2018. Those are the key components
needed for continuing economic success.32
Appendix
Forecast of Jobs in Washtenaw County by Detailed Industry Division
Estimated Forecast Average Wage
2018 2019 2020 2021 2017
Total wage and salary employment 212,561 214,652 217,280 219,806 $57,706
Total government 80,125 80,864 81,896 82,752 61,249
Federal government 3,942 3,901 3,968 3,824 82,083
Post office 571 566 562 559 59,793
Hospital 2,526 2,498 2,468 2,437 82,136
Other federal government 845 837 939 829 96,453
State government 64,497 65,177 66,075 66,996 61,976
Local government 11,686 11,785 11,853 11,931 49,927
Education and health services 7,271 7,335 7,385 7,435 48,303
Other local government 4,416 4,451 4,468 4,496 52,556
Total private 132,436 133,788 135,384 137,054 55,554
Goods-producing 19,537 19,696 19,780 19,821 64,279
Natural resources and mining 245 247 250 251 31,794
Construction 4,238 4,368 4,500 4,621 62,194
Buildings 1,269 1,309 1,355 1,395 58,091
Residential 724 750 791 828 46,473
Nonresidential 545 559 563 568 75,855
Heavy and civil engineering construction 381 384 394 405 71,410
Specialty trade contractors 2,588 2,675 2,751 2,821 62,510
Building foundation and exterior 448 473 496 517 53,164
Building equipment 1,290 1,332 1,364 1,396 70,178
Building finishing 538 548 562 576 53,857
Other specialty trade 311 323 328 331 56,738
Manufacturing 15,055 15,081 15,030 14,948 65,453
Food 882 901 919 935 45,603
Printing and related support activities 1,696 1,641 1,595 1,550 40,492
Chemicals 698 711 722 731 72,193
Plastics and rubber products 1,499 1,523 1,542 1,558 82,152
Fabricated metal products 1,272 1,308 1,333 1,354 57,511
Machinery 1,029 1,063 1,077 1,084 72,737
Computer and electronic products 1,142 1,118 1,089 1,060 95,533
Transportation equipment 4,756 4,715 4,658 4,586 63,245
Miscellaneous manufacturing 1,395 1,412 1,424 1,436 77,553
Medical equipment and supplies 804 799 790 781 89,478
Other miscellaneous manufacturing 590 613 634 655 60,380
Other manufacturing 686 689 672 654 55,225
Private service-providing 112,898 114,092 115,604 117,233 $54,097
Trade, transportation, and utilities 24,645 24,765 24,970 25,189 45,970
Wholesale trade 5,466 5,613 5,765 5,916 75,940
Merchant wholesalers, durable goods 3,042 3,141 3,234 3,324 82,026
Merchant wholesalers, nondurable goods 1,822 1,848 1,883 1,919 62,962
Electronic markets and agents and brokers 602 625 649 672 84,176
Retail trade 15,663 15,573 15,537 15,518 30,266
Motor vehicles 1,693 1,690 1,699 1,711 55,756
Furniture and home furnishings 573 568 573 578 38,766
Electronics and appliances 712 718 719 720 43,238
Building materials and garden supplies 1,417 1,418 1,426 1,435 39,868
Food and beverages 3,102 3,090 3,095 3,102 23,438
Health and personal care stores 1,032 1,027 1,025 1,028 35,889
Gasoline stations 522 515 507 500 20,18433
Appendix (continued)
Forecast of Jobs in Washtenaw County by Detailed Industry Division
Estimated Forecast Average Wage
2018 2019 2020 2021 2017
Retail trade (continued)
Clothing and accessories 1,308 1,303 1,305 1,308 18,867
Sporting goods, hobby, book, music stores 646 619 597 576 18,483
General merchandise 3,220 3,180 3,140 3,101 23,741
Miscellaneous store retailers 903 906 907 909 21,507
Nonstore retailers 535 539 544 550 35,736
Transportation and warehousing 3,097 3,164 3,257 3,348 62,639
Truck transportation 615 594 597 601 63,443
Other transportation and warehousing 2,482 2,570 2,660 2,747 62,414
Utilities 419 414 410 407 147,824
Information 4,568 4,601 4,642 4,691 94,939
Publishing industries, except Internet 1,803 1,797 1,794 1,794 83,913
Newspaper, book, and directory publishers 301 289 277 266 63,438
Software publishers 1,502 1,508 1,517 1,528 88,664
Telecommunications 348 336 332 328 64,379
Data processing, hosting, and related services 1,035 1,055 1,067 1,078 88,076
Other information 1,381 1,413 1,449 1,491 122,190
Financial activities 6,462 6,475 6,533 6,596 72,763
Finance and insurance 3,959 3,923 3,928 3,936 83,684
Credit intermediation and related activities 2,150 2,078 2,047 2,018 72,065
Depository credit intermediation 1,173 1,177 1,182 1,189 64,814
Other credit intermediation and related 977 901 864 829 80,150
Insurance carriers and related activities 980 988 997 1,006 70,788
Other finance 829 857 884 912 133,003
Real estate and rental and leasing 2,504 2,552 2,605 2,660 $54,892
Real estate 2,214 2,268 2,321 2,376 51,395
Lessors of real estate 979 993 1,002 1,011 46,123
Offices of real estate agents and brokers 221 225 232 238 65,453
Activities related to real estate 1,015 1,049 1,087 1,126 53,601
Rental and leasing services 210 209 211 212 45,590
Lessors of nonfinancial intangible assets 79 76 74 72 178,060
Professional and business services 27,495 27,955 28,457 28,957 78,591
Professional and technical services 16,949 17,419 17,864 18,300 96,179
Legal services 1,029 1,047 1,066 1,084 83,730
Accounting and bookkeeping 585 587 583 580 63,444
Architectural and engineering 4,758 4,859 4,976 5,101 112,071
Engineering 1,234 1,237 1,235 1,230 97,935
Testing laboratories 3,106 3,188 3,294 3,410 122,496
Other architectural and engineering 418 434 447 461 73,622
Specialized design 267 280 292 305 70,782
Computer systems design and related services 3,189 3,324 3,419 3,493 103,331
Management and technical consulting 2,385 2,402 2,426 2,452 96,251
Scientific research and development 2,952 3,049 3,136 3,219 102,672
Physical, engineering, and bio. research 2,745 2,845 2,935 3,022 105,772
Social science and humanities research 207 204 201 197 64,425
Advertising, PR, and related services 228 226 223 220 66,970
Other professional and technical services 1,556 1,644 1,743 1,846 48,834
Management of companies and enterprises 1,224 1,264 1,275 1,274 173,252
Administrative and waste services 9,323 9,272 9,318 9,383 36,405
Administrative and support services 8,673 8,604 8,634 8,684 33,51534
Appendix (continued)
Forecast of Jobs in Washtenaw County by Detailed Industry Division
Estimated Forecast Average Wage
2018 2019 2020 2021 2017
Administrative and support services (continued)
Office administrative services 585 581 581 582 107,474
Employment services 5,177 5,101 5,116 5,144 24,853
Business support 357 354 353 352 44,588
Services to buildings and dwellings 1,682 1,684 1,694 1,707 30,828
Other administrative and support services 872 885 891 899 38,472
Waste management and remediation services 650 668 684 698 79,676
Private education and health services 26,683 26,984 27,377 27,839 52,250
Private educational services 3,170 3,157 3,168 3,181 36,503
Private elementary and secondary schools 1,045 1,041 1,041 1,043 38,842
Other private educational services 2,126 2,116 2,127 2,138 35,381
Private health care and social assistance 23,513 23,826 24,209 24,658 54,406
Ambulatory health care services 9,747 9,959 10,199 10,469 73,255
Offices of physicians 4,692 4,867 5,053 5,254 106,136
Offices of dentists 1,295 1,306 1,320 1,338 55,054
Offices of other health practitioners 743 771 796 823 42,470
Home health care services 1,444 1,423 1,414 1,410 29,995
Other ambulatory health care services 1,573 1,593 1,616 1,644 59,587
Nursing and residential care facilities 4,357 4,357 4,382 4,419 29,980
Community care facilities for the elderly 2,123 2,138 2,160 2,187 32,672
Other nursing and residential care facilities 2,233 2,219 2,222 2,232 27,762
Individual and family services 1,068 1,097 1,108 1,142 23,768
Child day care services 1,166 1,183 1,200 1,219 21,303
Hospitals, emergency relief, and vocational
rehabilitation services 7,176 7,230 7,319 7,408 $53,112
Leisure and hospitality 17,772 18,025 18,300 18,582 19,766
Arts, entertainment, and recreation 2,434 2,483 2,550 2,626 23,260
Amusements, gambling, and recreation 1,949 1,989 2,042 2,098 18,919
Golf courses and country clubs 537 551 566 579 21,412
Fitness and recreational sports centers 1,064 1,091 1,127 1,168 17,455
Other amusements, gambling, recreation 349 347 348 351 19,049
Performing arts, spectator sports, museums,
and parks 485 493 509 528 40,495
Accommodation and food services 15,338 15,542 15,750 15,957 19,242
Accommodation 1,313 1,306 1,297 1,291 25,151
Food services and drinking places 14,025 14,236 14,453 14,666 18,674
Special food services 1,108 1,119 1,138 1,155 22,684
Drinking places, alcoholic beverages 809 813 824 841 20,182
Restaurants and other eating places 12,108 12,304 12,491 12,670 18,202
Full-service restaurants 6,401 6,513 6,612 6,707 20,527
Limited-service restaurants 4,890 4,969 5,050 5,127 15,848
Cafeterias and nonalcoholic beverage bars 817 822 829 836 13,348
Other services 5,078 5,098 5,135 5,189 31,744
Repair and maintenance 1,045 1,054 1,067 1,079 40,702
Personal and laundry services 1,353 1,359 1,366 1,375 28,381
Membership associations and organizations 1,789 1,793 1,799 1,808 36,673
Private households 890 892 903 926 15,974
Unallocated private services 195 191 191 191 60,659
Addendum
Unemployment rate 3.2 2.8 2.6 2.5You can also read