4.3.8 HURRICANE AND TROPICAL STORM - Hunterdon County, NJ
←
→
Page content transcription
If your browser does not render page correctly, please read the page content below
Section 4.3.8: Risk Assessment - Hurricane and Tropical Storm
4.3.8 HURRICANE AND TROPICAL STORM
The following section provides the hazard profile (hazard description, location, extent, previous occurrences and
losses, probability of future occurrences, and impact of climate change) and vulnerability assessment for the
hurricane and tropical storm hazard in Hunterdon County.
2021 HMP CHANGES
Previous occurrences were updated with events that occurred between 2016 and 2020.
A vulnerability assessment was conducted for the hurricane and tropical storm hazard using a more accurate
and updated building inventory; Hazus v4.2 was also used to conduct a 100-year and 500-year Mean Return
Period assessment; it now directly follows the hazard profile.
Profile
Hazard Description
A tropical cyclone is a rotating, organized system of clouds and thunderstorms that originates over tropical or
sub-tropical waters and has a closed low-level circulation. Tropical depressions, tropical storms, and hurricanes
are all considered tropical cyclones. These storms rotate counterclockwise around the center in the northern
hemisphere and are accompanied by heavy rain and strong winds (NWS 2013a). Almost all tropical storms and
hurricanes in the Atlantic basin (which includes the Gulf of Mexico and Caribbean Sea) form between June 1
and November 30 (hurricane season). August and September are peak months for hurricane development
(NOAA 2013a).
Over a two-year period, the U.S. coastline is struck by an average of three hurricanes, one of which is classified
as a major hurricane. Hurricanes, tropical storms, and tropical depressions pose a threat to life and property.
These storms bring heavy rain, storm surge, and flooding (NOAA 2013b). The cooler waters off the coast of
New Jersey can diminish the energy of storms that have traveled up the eastern seaboard. However, historical
data show that a number of hurricanes/tropical storms have impacted New Jersey, often as the remnants of a
larger storm hitting the Gulf or Atlantic Coast hundreds of miles south of New Jersey. These storms maintain
sufficient wind and precipitation to cause substantial damage to the state.
Tropical cyclones most frequently affect New Jersey during the month of September, though the state has
experienced tropical cyclones throughout the hurricane season, excluding November. Because of peak warm
water temperatures in September, storms usually affect New Jersey during this time (Buchholz and Savadore
1993).
For the purpose of this HMP update, this hazard profile will include hurricanes and tropical storms. Detailed
information regarding these hazards in Hunterdon County are discussed further in this section.
Hurricanes and Tropical Storm
A tropical storm system is characterized by a low-pressure center and numerous thunderstorms that produce
strong winds and heavy rain (winds are at a lower speed than hurricane-force winds, therefore categorized as a
tropical storm instead of a hurricane). Tropical storms strengthen when water evaporated from the ocean is
released as the saturated air rises, resulting in condensation of water vapor contained in the moist air. They are
fueled by a different heat mechanism than other cyclonic windstorms such as Nor’Easters and polar lows. The
characteristic that separates tropical cyclones from other cyclonic systems is that at any height in the atmosphere,
DMA 2000 Hazard Mitigation Plan Update – Hunterdon County, New Jersey 4.3.8-1
May 2021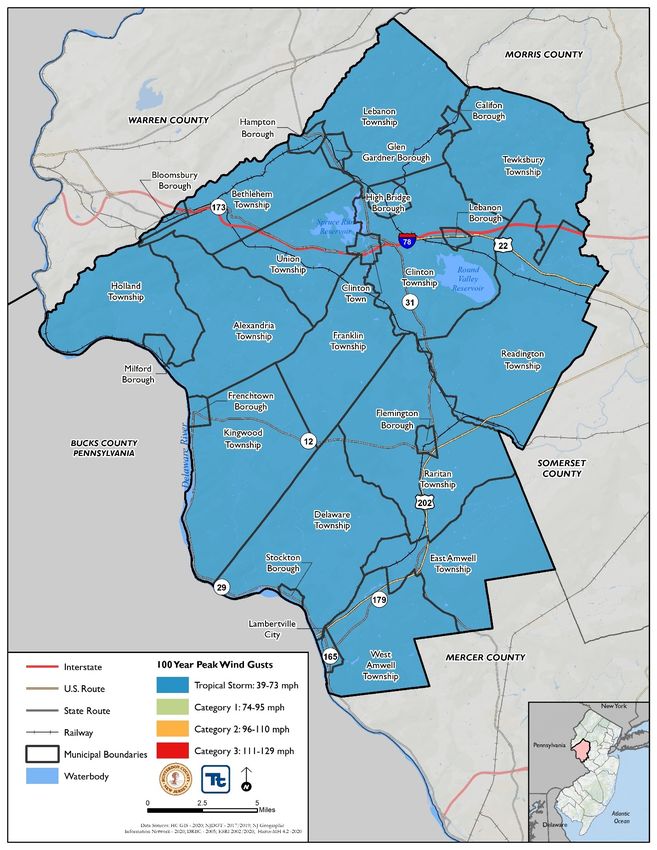
Section 4.3.8: Risk Assessment - Hurricane and Tropical Storm
the center of a tropical cyclone will be warmer than its surroundings; a phenomenon called “warm core” storm
systems (NOAA 2013).
A hurricane is a tropical storm that attains hurricane status when its wind speed reaches 74 or more miles per
hour (mph). Tropical systems may develop in the Atlantic between the Lesser Antilles and the African coast, or
may develop in the warm tropical waters of the Caribbean and Gulf of Mexico. These storms may move up the
Atlantic Coast of the United States and impact the Eastern Seaboard, or move into the United States through the
states along the Gulf Coast, bringing wind and rain as far north as New England, before moving offshore and
heading east.
NWS issues hurricane and tropical storm watches and warnings. These watches and warnings are issued or will
remain in effect after a tropical cyclone becomes post-tropical, when such a storm poses a significant threat to
life and property. The NWS allows the National Hurricane Center (NHC) to issue advisories during the post-
tropical stage. The following are the definitions of the watches and warnings:
Hurricane/Typhoon Warning is issued when sustained winds of 74 mph or higher are expected somewhere
within the specified area in association with a tropical, subtropical, or post-tropical cyclone. Because
hurricane preparedness activities become difficult once winds reach tropical storm force, the warning is
issued 36 hours in advance of the anticipated onset of tropical storm-force winds. The warning can remain
in effect when dangerously high water or combination of dangerously high water and waves continue, even
though winds may be less than hurricane force.
Hurricane Watch is issued when sustained winds of 74 mph or higher are possible within the specified area
in association with a tropical, subtropical, or post-tropical cyclone. Because hurricane preparedness
activities become difficult once winds reach tropical storm force, the hurricane watch is issued 48 hours
prior to the anticipated onset of tropical storm-force winds.
Tropical Storm Warning is issued when sustained winds of 39 to 73 mph are expected somewhere within
the specified area within 36 hours in association with a tropical, subtropical, or post-tropical storm.
Tropical Storm Watch is issued when sustained winds of 39 to 73 mph are possible within the specified area
within 48 hours in association with a tropical, sub-tropical, or post-tropical storm.
(NWS 2013).
Location
All of Hunterdon County is vulnerable to and are at risk for flooding due to heavy rains and damaging winds
produced by hurricanes and tropical storms.
Tropical Storm and Hurricane Tracks
NOAA’s Historical Hurricane Tracks tool is a public interactive mapping application that displays Atlantic Basin
and East-Central Pacific Basin tropical cyclone data. This interactive tool catalogs tropical cyclones that have
occurred from 1842 to 2020 (latest date available from data source). Between 1861 and 2020, 32 events
classified as either a hurricane, tropical storm, or tropical depression tracked within 65 nautical miles of
Hunterdon County. Figure 5.4.6- 1 displays tropical cyclone tracks for Hunterdon County that tracked with 65
nautical miles between 2015 and 2020 (only two events – Tropical Storm Fay and Tropical Storm Isaias in 2020,
identified as tropical storms when passing by the county). Refer to the “Previous Occurrences and Losses”
section for further information regarding hurricane and tropical storm events that impacted Hunterdon County.
DMA 2000 Hazard Mitigation Plan Update – Hunterdon County, New Jersey 4.3.8-2
May 2021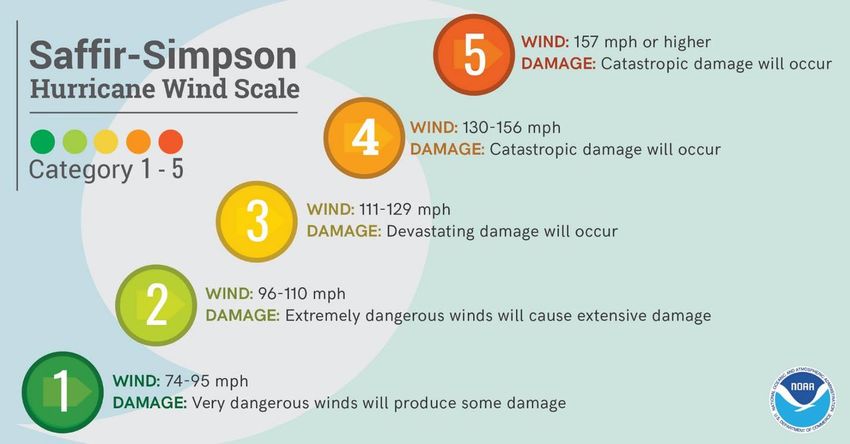
Section 4.3.8: Risk Assessment - Hurricane and Tropical Storm

Figure 4.3.8-1. Historical Tropical Storm and Hurricane Tracks 2015 to 2020

Source: NOAA 2021

Extent
The extent of a hurricane is categorized in accordance with the Saffir-Simpson Hurricane Scale. The Saffir-
Simpson Hurricane Wind Scale is a 1-to-5 rating based on a hurricane’s sustained wind speed. This scale
estimates potential property damage. Hurricanes reaching Category 3 and higher are considered major
hurricanes because of their potential for significant loss of life and damage. Category 1 and 2 storms are still
dangerous and require preventative measures (NOAA 2013b). Table 5.4.6-1 presents this scale, which is used
to estimate the potential property damage and flooding expected when a hurricane makes landfall.

         DMA 2000 Hazard Mitigation Plan Update – Hunterdon County, New Jersey                          4.3.8-3
         May 2021
Section 4.3.8: Risk Assessment - Hurricane and Tropical Storm
Figure 4.3.8-2. Saffir-Simpson Scale
Source: NWS 2020
Mean Return Period
In evaluating the potential for hazard events of a given magnitude, a MRP is often used. The MRP provides an
estimate of the magnitude of an event that may occur within any given year based on past recorded events. MRP
is the average period of time, in years, between occurrences of a particular hazard event, equal to the inverse of
the annual frequency of exceedance (Dinicola 2009).
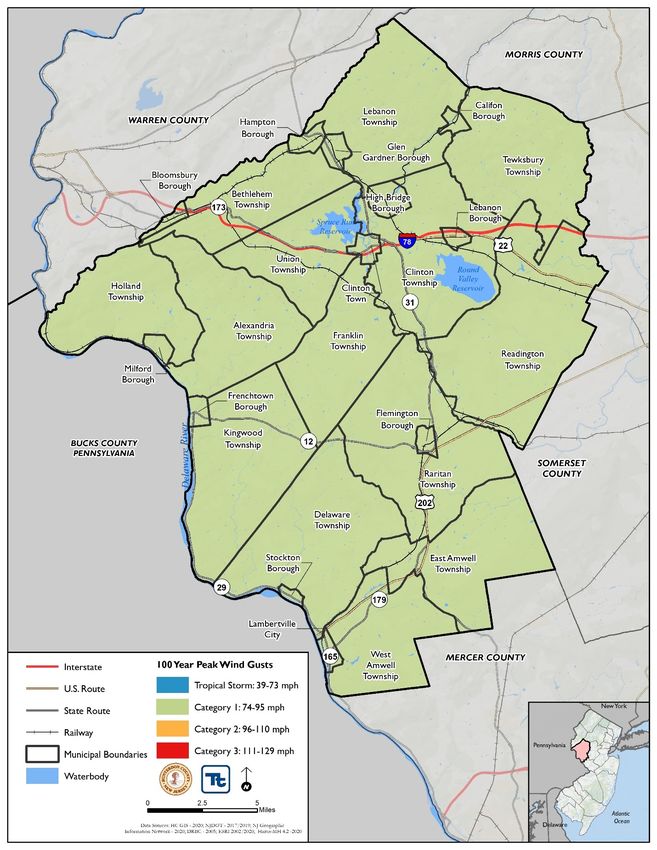
Figure 4.3.8-3 and Figure 4.3.8-4 display the estimated maximum 3-second gust wind speeds that can be
anticipated in the study area associated with the 100- and 500-year MRP events. These peak wind speed
projections were generated using Hazus model runs. The maximum 3-second gust wind speeds for Hunterdon
County are 61 to 71 mph (Tropical Storm), for the 100-year MRP event. The maximum 3-second gust wind
speeds for Hunterdon County are 77 to 88 mph (Category 1 hurricane), for the 500-year MRP event. The storm
tracks for the 100- and 500-year event were not available in Hazus; a Hazus-acknowledged error in this version
that will be addressed in the future. The associated impacts and losses from these 100-year and 500-year MRP
hurricane events are discussed later in the Vulnerability Assessment subsection.
DMA 2000 Hazard Mitigation Plan Update – Hunterdon County, New Jersey 4.3.8-4
May 2021Section 4.3.8: Risk Assessment - Hurricane and Tropical Storm
Figure 4.3.8-3. Wind Speeds for the 100-Year Mean Return Period Event
DMA 2000 Hazard Mitigation Plan Update – Hunterdon County, New Jersey 4.3.8-5
May 2021Section 4.3.8: Risk Assessment - Hurricane and Tropical Storm
Figure 4.3.8-4. Wind Speeds for the 500-Year Mean Return Period Event
DMA 2000 Hazard Mitigation Plan Update – Hunterdon County, New Jersey 4.3.8-6
May 2021Section 4.3.8: Risk Assessment - Hurricane and Tropical Storm
Previous Occurrences and Losses
FEMA Major Disasters and Emergency Declarations
Between 1954 and 2020, Hunterdon County was included in six declarations for hurricane and tropical storm-
related events. Table 4.3.8-1 lists these events.
Table 4.3.8-1. Flood-Related Disaster (DR) and Emergency (EM) Declarations 1954-2020
Declaration Event Date Declaration Date Event Description
EM-3148 September 16-18, 1999 September 17, 1999 Hurricane Floyd Emergency Declarations
DR-1295 September 16-18, 1999 September 17, 1999 Hurricane Floyd Major Disaster Declarations
August 26 – September 5,
EM-3332 August 27, 2011 Hurricane Irene
2011
August 26 – September 5,
DR-4021 August 31, 2011 Hurricane Irene
2011
October 26 – November
EM-3354 October 28, 2012 Hurricane Sandy
8, 2012
October 26 – November
DR-4086 October 30, 2012 Hurricane Sandy
8, 2012
Source: FEMA 2020
USDA Declarations
The Secretary of Agriculture from the U.S. Department of Agriculture (USDA) is authorized to designate
counties as disaster areas to make emergency loans to producers suffering losses in those counties and in counties
that are contiguous to a designated county. Between 2015 and 2020, the period for which data was available,
Hunterdon County was not included in any USDA agricultural disasters relating to hurricanes or tropical storms.
Hurricane and Tropical Storm Events
Hurricane and tropical storm events that have impacted Hunterdon County between 2015 and 2020 are listed in
Table 4.3.9-2. Please see Section 9 (Jurisdictional Annexes) for detailed information regarding impacts and
losses to each municipality.
Table 4.3.8-2. Hurricane and Tropical Storm Events in Hunterdon County, 2015 to 2020
FEMA
Declaration
Number Hunterdon
Date(s) Event (if County
of Event Type applicable) Designated? Location Description
Tropical Storm Fay moved northward along the coasts of
Delaware and New Jersey on the afternoon and evening of
July 10. The storm produced rainfall totals up to 3 to 6 inches
July 10, Tropical TBD, Hunterdon
N/A in New Jersey, with the highest totals occurring in the
2020 Storm pending County
southern part of the state. Some areas also experienced a
period of tropical storm force winds, especially near the
coast. Overall impacts from wind were limited.
Tropical Storm Isaias brought high winds, heavy rain, several
tornadoes, and coastal flooding to the mid-Atlantic region,
August 4, Tropical TBD, Hunterdon becoming the most impactful tropical cyclone to impact most
N/A
2020 Storm pending County of the region since Sandy in 2012.
Multiple reports of downed trees and power lines were
received, especially near Readington Twp where a 51 mph
DMA 2000 Hazard Mitigation Plan Update – Hunterdon County, New Jersey 4.3.8-7
May 2021Section 4.3.8: Risk Assessment - Hurricane and Tropical Storm
FEMA
Declaration
Number Hunterdon
Date(s) Event (if County
of Event Type applicable) Designated? Location Description
wind gust was also measured. Sustained tropical storm force
winds likely occurred.
Source: FEMA 2020; NOAA-NCEI 2020; NWS 2020; SPC 2020; NJOEM 2019
Note: Not all events that have occurred in Hunterdon County are included due to the extent of documentation and the fact that not all sources
have been identified or researched.
K: Thousand
DR Disaster Declaration (FEMA)
FEMA Federal Emergency Management Agency
Mph miles per hour
N/A Not Applicable
Probability of Future Occurrences
Hurricane return periods are the frequency at which a certain intensity of hurricane can be expected within a
given distance of a given location. For example, a return period of 20 years for a major hurricane means that on
average during the previous 100 years, a Category 3 or greater hurricane passed within 58 miles of a specific
location approximately 5 times. The return period of hurricanes for Hunterdon County was not calculated –
however the return period for surrounding counties is 18 to 19 years for a hurricane (greater than 64 mph winds)
and 74 to 76 years for a major hurricane (greater than 110 mph winds) (NOAA 2013).
In order to determine the recurrence interval and the average annual number of events, data from 1950 to 2020
was looked at using NOAA's Historical Hurricane Tracks tool. A 65 nautical mile radius was used to identify
any hurricane and tropical storm events Hunterdon County. Based on this data, 19 hurricanes, tropical storms,
or tropical depressions passed within 65 nautical miles of Hunterdon County. The table below shows these
statistics, as well as the annual average number of events and the estimated percent change of an event occurring
in a given year (NHC 2021).
Table 4.3.8-3 Probability of Future Occurrences of Hurricane and Tropical Storm Events
Rate of
Occurrence Recurrence
or Interval (in
Number of Annual years)
Occurrences Number of (# Probability of Percent chance
Between 1950 Events Years/Number Event in any of occurrence in
Hazard Type and 2020 (average) of Events) given year any given year
Tropical Depression 3 0.04 23.67 0.04 4.23
Tropical Storm 13 0.19 5.46 0.18 18.31
Hurricanes 0.04 23.67 0.04 4.23
3
(all categories)
Total 19 0.27 3.74 0.27 26.76
Source: NHC 2021
It is estimated that Hunterdon County will continue to experience direct and indirect impacts of hurricane and
tropical storms annually that may induce secondary hazards such as flooding, extreme wind, infrastructure
deterioration or failure, utility failures, power outages, water quality and supply concerns, and transportation
delays, accidents, and inconveniences.
DMA 2000 Hazard Mitigation Plan Update – Hunterdon County, New Jersey 4.3.8-8
May 2021Section 4.3.8: Risk Assessment - Hurricane and Tropical Storm
In Section 5.3, the identified hazards of concern for Hunterdon County were ranked. The probability of
occurrence, or likelihood of the event, is one parameter used for hazard rankings. Based on historical records
and input from the Planning Committee, the probability of occurrence for hurricane and tropical storms in the
county is considered “frequent” (likely to occur within 25 years, as presented in Table 5.3-3).
Climate Change Impacts
Providing projections of future climate change for a specific region is challenging. Shorter term projections are
more closely tied to existing trends making longer term projections even more challenging. The further out a
prediction reaches the more subject to changing dynamics it becomes.
Climate change includes major changes in temperature, precipitation, or wind patterns, which occur over several
decades or longer. Due to the increase in greenhouse gas concentrations since the end of the 1890s, New Jersey
has experienced a 3.5° F (1.9° C) increase in the State’s average temperature (Office of the New Jersey State
Climatologist 2020), which is faster than the rest of the Northeast region (2° F [1.1° C]) (Melillo et al. 2014) and
the world (1.5° F [0.8° C]) (IPCC 2014). This warming trend is expected to continue. By 2050, temperatures in
New Jersey are expected to increase by 4.1 to 5.7° F (2.3° C to 3.2° C) (Horton et al. 2015). Thus, New Jersey
can expect to experience an average annual temperature that is warmer than any to date (low emissions scenario)
and future temperatures could be as much as 10° F (5.6° C) warmer (high emissions scenario) (Runkle et al.
2017). New Jersey can also expect that by the middle of the 21st century, 70% of summers will be hotter than
the warmest summer experienced to date (Runkle et al. 2017). The increase in temperatures is expected to be
felt more during the winter months (December, January, and February), resulting in less intense cold waves,
fewer sub-freezing days, and less snow accumulation. Changes in winter temperatures could result in a change
in the frequency of ice jam events.
As temperatures increase, Earth’s atmosphere can hold more water vapor which leads to a greater potential for
precipitation. Currently, New Jersey receives an average of 46 inches of precipitation each year (Office of the
New Jersey State Climatologist 2020). Since the end of the twentieth century, New Jersey has experienced slight
increases in the amount of precipitation it receives each year, and over the last 10 years there has been a 7.9%
increase. By 2050, annual precipitation in New Jersey could increase by 4% to 11% (Horton et al. 2015). By the
end of this century, heavy precipitation events are projected to occur two to five times more often (Walsh et al.
2014) and with more intensity (Huang et al. 2017) than in the last century. New Jersey will experience more
intense rain events, less snow, and more rainfalls (Fan et al. 2014, Demaria et al. 2016, Runkle et al. 2017). Also,
small decreases in the amount of precipitation may occur in the summer months, resulting in greater potential
for more frequent and prolonged droughts (Trenberth 2011). New Jersey could also experience an increase in
the number of flood events (Broccoli et al. 2020).
A warmer atmosphere means storms have the potential to be more intense (Guilbert et al. 2015) and occur more
often (Coumou and Rahmstorf 2012, Marquardt Collow et al. 2016, Broccoli et al. 2020). In New Jersey, extreme
storms typically include coastal nor’easters, snowstorms, spring and summer thunderstorms, tropical storms, and
on rare occasions hurricanes. Most of these events occur in the warmer months between April and October, with
nor’easters occurring between September and April. Over the last 50 years, in New Jersey, storms that resulted
in extreme rain increased by 71% (Walsh et al. 2014) which is a faster rate than anywhere else in the United
States (Huang et al. 2017).
Climate change may result in changes to the frequency of coastal storms. A warmer atmosphere means storms
have the potential to be more intense (Guilbert et al. 2015) and occur more often (Coumou and Rahmstorf 2012,
Marquardt Collow et al. 2016, Broccoli et al. 2020). In New Jersey, extreme storms typically include coastal
nor’easters, snowstorms, spring and summer thunderstorms, tropical storms, and on rare occasions hurricanes.
Most of these events occur in the warmer months between April and October, with nor’easters occurring between
DMA 2000 Hazard Mitigation Plan Update – Hunterdon County, New Jersey 4.3.8-9
May 2021Section 4.3.8: Risk Assessment - Hurricane and Tropical Storm
September and April. Over the last 50 years, in New Jersey, storms that resulted in extreme rain increased by
71% (Walsh et al. 2014) which is a faster rate than anywhere else in the United States (Huang et al. 2017). As
temperatures increase so will the energy in a storm system, increasing the potential for more intense tropical
storms (Huang et al. 2017), especially those of Category 4 and 5 (Melillo et al. 2014).
As oceans warm, the length of hurricane season may expand. The past five hurricane seasons have featured a
tropical system occurring before the official start of the season. In 2016, a very rare winter hurricane named Alex
developed in the middle of January (BBC 2019). According to NOAA's database, 39 storms formed in the
Atlantic Basin before June 1 from 1851 through 2020, a long-term average of one such early storm every four
to five years. The 2010s had the most such storms, and there has been a steady increase since the 1990s. However,
the 1950s had six such storms, the 1930s had four and there was another four preseason storm streak from 1887
through 1890. It is possible there were other such storms in the era before satellites – before the mid-1960s –
that were missed by ship observations or reports from areas impacted. It remains to be seen if expansion of the
traditional hurricane season is a long-term trend or a common occurrence (Weather.com 2020).
Temperatures are predicted to increase in Hunterdon County and ocean temperatures are forecast to continue to
increase, which may lead to an increase in intensity and frequency of hurricanes. It remains to be seen if other
factors such as steering currents, atmospheric sheer, and the presence of Saharan dust will be impacted in ways
which increase or decrease the risk of hurricanes in Hunterdon County.
Vulnerability Assessment
To understand risk, a community must evaluate what assets are exposed and vulnerable in the identified hazard
area. For hurricanes and tropical storms, the entirety of Hunterdon County has been identified as the hazard
area. Therefore, all assets in the County (population, structures, critical facilities and lifelines), as described in
the County profile, are vulnerable. Potential losses associated with high-wind events were calculated for the
County for two probabilistic hurricane events: the 100-year and 500-year MRP hurricane events. The impacts
on population, existing structures, critical facilities and the economy are presented below.
Impact on Life, Health and Safety
The impact of a hurricane wind event on life, health, and safety is dependent upon several factors including the
severity of the event and whether or not adequate warning time was provided to residents. All Hunterdon County
residents are exposed to a hurricane wind event (125,051 persons; 2014-2018 American Community Survey 5-
year Estimate).
Research has shown that some populations, while they may not have more hazard exposure, may experience
exacerbated impacts and prolonged recovery if/when impacted. This is due to many factors including their
physical and financial ability to react or respond during a hazard. Economically disadvantaged populations are
vulnerable because they are likely to evaluate their risk and make decisions based on the major economic impact
to their family and may not have funds to evacuate. The population over the age of 65 is also vulnerable and,
physically, they may have more difficulty evacuating. Additionally, the elderly are considered vulnerable
because they require extra time or outside assistance during evacuations and are more likely to seek or need
medical attention which may not be available due to isolation during a storm event. Please refer to Section 3
(County Profile) for the statistics of these populations.
Residents may be displaced or require temporary to long-term sheltering. In addition, downed trees, damaged
buildings and debris carried by high winds can lead to injury or loss of life. Socially vulnerable populations are
most susceptible, based on a number of factors including their physical and financial ability to react or respond
during a hazard and the location and construction quality of their housing. Hazus estimates there will be zero
displaced households and no people will require temporary shelter due to a 100-year MRP event or a 500-year
DMA 2000 Hazard Mitigation Plan Update – Hunterdon County, New Jersey 4.3.8-10
May 2021Section 4.3.8: Risk Assessment - Hurricane and Tropical Storm
MRP event. Please note that estimates are only based on wind speed and do not account for sheltering needs
associated with flooding and storm surge that may accompany coastal storm events.
Impact on General Building Stock
Damage to buildings is dependent upon several factors, including wind speed, storm duration, and path of the
storm track. Building construction also plays a major role in the extent of damage resulting from a coastal storm.
Due to differences in construction, residential structures are generally more susceptible to wind damage than
commercial and industrial structures. Mobile/manufactured homes, and structures constructed of wood and
masonry buildings, in general, tend to experience more damage than concrete or steel buildings.
To better understand these risks, Hazus was used to estimate the expected wind-related building damages.
Specific types of wind damages are also summarized in Hazus at the following wind damage categories: no
damage/very minor damage, minor damage, moderate damage, severe damage, and total destruction. Table
4.3.8-4 summarizes the definition of the damage categories.
Table 4.3.8-4 Description of Damage Categories
Missile
Roof Window Impacts Roof Wall
Cover Door Roof on Structure Structure
Qualitative Damage Description Failure Failures Deck Walls Failure Failure
No Damage or Very Minor Damage
Little or no visible damage from the
outside. No broken windows, or failed
≤2% No No No No No
roof deck. Minimal loss of roof cover,
with no or very limited water
penetration.
Minor Damage
Maximum of one broken window, door One
or garage door. Moderate roof cover loss window,
>2% and
that can be covered to prevent additional door, or No one and ≤ Typically
>15% and 1 to 3
window breakage. Minor roof sheathing the larger of 5 to 10 No No
≤50% panels
failure. Some resulting damage to 20% & 3 impacts
interior of building from water.
Severe Damage
> the larger >3 Typically
Major window damage or roof sheathing
>50% of 20% & 3 and 10 to 20 No No
loss. Major roof cover loss. Extensive
and ≤50% ≤25% impacts
damage to interior from water.
Destruction
Typically
Complete roof failure and/or, failure of Typically
>50% >25% >20 Yes Yes
wall frame. Loss of more than 50% of >50%
impacts
roof sheathing.
Source: Hazus Hurricane Technical Manual
Out of these damage categories, most Hunterdon structures would experience no damage and a small amount,
minor damage. Table 4.3.8-5 indicates the number and type of buildings for each damage category.
DMA 2000 Hazard Mitigation Plan Update – Hunterdon County, New Jersey 4.3.8-11
May 2021Section 4.3.8: Risk Assessment - Hurricane and Tropical Storm
Table 4.3.8-5 Expected Damages from 100 and 500-Year MRP Hurricane Wind Events
100-year 500-year
Total Percent of Percent of
Number of Buildings in Buildings in
Occupancy Buildings in Severity of Expected Building Occupancy Building Occupancy
Class Occupancy Damage Count Class Count Class
None 53,245 99.9% 51,837 97.3%
Residential
Exposure Minor 38 0.1% 1,405 2.6%
(Single and 53,283 Moderate 0 0.0% 41 0.1%
Multi-Family
Dwellings) Severe 0 0.0% 0 0.0%
Complete Destruction 0 0.0% 0 0.0%
None 1,997 99.6% 1,968 98.2%
Minor 8 0.4% 36 1.8%
Commercial
2,005 Moderate 0 0.0% 1Section 4.3.8: Risk Assessment - Hurricane and Tropical Storm
Table 4.3.8-6 Estimated Building Value Damaged by the 100 and 500-Year MRP Hurricane-Related
Winds
Percent of Total Building
and Contents
Estimated Total Damages Replacement Cost Value
Total Replacement
Cost Value (All
Jurisdiction Occupancies) 100-Year 500-Year 100-Year 500-Year
Alexandria (Twp) $2,254,380,737 $372,809 $3,136,617SECTION 4.3.8: HURRICANE AND TROPICAL STORM
Table 4.3.8-7 Estimated Building Value of Residential, Commercial, and Other Occupancy Types Damaged by the 100-Year and 500-Year MRP
Hurricane-Related Winds
Estimated Residential Estimated Commercial Estimated Damages for All Other
Damages Damages Occupancies
Total Replacement Cost
Jurisdiction Value (All Occupancies) 100-Year 500-Year 100-Year 500-Year 100-Year 500-Year
Alexandria (Twp) $2,254,380,737 $350,735 $3,007,622 $5,645 $17,176 $16,429 $111,819
Bethlehem (Twp) $1,313,561,223 $173,176 $1,505,756 $1,720 $7,384 $7,616 $26,461
Bloomsbury (B) $302,046,816 $36,990 $321,614 $368 $1,576 $1,631 $5,660
Califon (B) $281,026,152 $32,302 $331,430 $1 $2,264 $1 $7,153
Clinton (T) $736,685,048 $261,787 $1,901,951 $9,105 $18,210 $3,640 $8,932
Clinton (Twp) $4,004,236,773 $597,680 $4,835,984 $14,348 $32,962 $38,747 $111,279
Delaware (Twp) $2,241,884,808 $712,007 $4,426,125 $5,818 $31,985 $5,132 $206,438
East Amwell (Twp) $1,607,249,557 $620,850 $3,188,379 $3,007 $19,197 $4,774 $97,983
Flemington (B) $1,131,732,147 $298,388 $1,657,825 $21,044 $64,026 $6,097 $37,884
Franklin (Twp) $1,911,341,862 $295,250 $2,366,532 $6,129 $18,765 $6,391 $134,941
Frenchtown (B) $488,631,192 $83,042 $610,414 $2,480 $10,423 $1,210 $19,617
Glen Gardner (B) $342,984,639 $55,066 $488,638 $0 $3,246 $0 $3,314
Hampton (B) $313,409,859 $42,427 $376,415 $0 $2,500 $0 $2,546
High Bridge (B) $828,154,125 $70,294 $854,829 $4,015 $8,213 $7,800 $17,118
Holland (Twp) $1,768,993,941 $310,594 $2,335,936 $640 $35,781 $8,607 $47,106
Kingwood (Twp) $1,712,064,139 $386,047 $2,837,710 $11,527 $48,453 $5,626 $91,196
Lambertville I $1,166,961,549 $518,821 $2,866,783 $8,438 $75,779 $5,098 $50,491
Lebanon (B) $530,649,358 $154,387 $1,037,311 $7,322 $17,581 $1,888 $5,587
Lebanon (Twp) $2,373,828,013 $210,016 $2,157,586 $8 $14,768 $27 $46,694
Milford (B) $527,153,351 $67,244 $576,543 $1,076 $3,299 $3,150 $21,404
Raritan (Twp) $8,605,785,368 $3,513,357 $19,290,143 $67,547 $222,432 $77,302 $348,496
Readington (Twp) $5,837,409,694 $2,269,551 $12,080,226 $19,366 $41,379 $45,425 $138,242
Stockton (B) $219,304,144 $56,844 $353,565 $464 $2,555 $409 $16,527
DMA 2000 Hazard Mitigation Plan Update – Hunterdon County, New Jersey 4.3.8-14
MONTH 2021SECTION 4.3.8: HURRICANE AND TROPICAL STORM
Estimated Residential Estimated Commercial Estimated Damages for All Other
Damages Damages Occupancies
Total Replacement Cost
Jurisdiction Value (All Occupancies) 100-Year 500-Year 100-Year 500-Year 100-Year 500-Year
Tewksbury (Twp) $2,842,570,106 $453,406 $3,099,195 $2,894 $6,506 $4,437 $10,909
Union (Twp) $1,836,082,381 $209,401 $2,093,261 $5,631 $15,086 $20,662 $69,649
West Amwell (Twp) $1,186,083,476 $418,264 $2,281,955 $5,838 $40,345 $5,936 $87,384
Hunterdon County
$46,364,210,456 $12,197,924 $76,883,727 $204,429 $761,890 $278,036 $1,724,828
(Total)
Source: Hazus 4.2; Hunterdon County GIS 2020; RS Means 2020
Notes: B – Borough; C – City; Twp. – Township; T = Town; % - Percent
DMA 2000 Hazard Mitigation Plan Update – Hunterdon County, New Jersey 4.3.8-15
MONTH 2021Section 4.3.8: Risk Assessment - Hurricane and Tropical Storm
Impact on Critical Facilities and Lifelines
Critical facilities are at risk of being impacted by high winds associated with structural damage, or falling tree
limbs/flying debris, which can result in the loss of power. Power loss can greatly impact households, business
operations, public utilities, and emergency personnel. For example, vulnerable populations in Hunterdon County
are at risk if power loss results in interruption of heating and cooling services, stagnated hospital operations, and
potable water supplies. Emergency personnel such as police, fire, and EMS will not be able to effectively
respond in a power loss event to maintain the safety of its citizens.
Hazus estimates the probability that critical facilities (i.e., medical facilities, fire/EMS, police, EOC, schools,
and user-defined facilities such as shelters and municipal buildings) could sustain damage as a result of 100-year
and 500-year MRP wind events. Additionally, Hazus estimates the loss of use for each facility in number of
days. Due to the sensitive nature of the critical facility dataset, individual facility estimated loss is not provided.
Table 4.3.8-8 and Table 4.3.8-9 summarize the percent probability that each facility type may experience damage
as a result of the 100- and 500-year MRP events.
Table 4.3.8-8 Estimated Impacts to Critical Facilities for the 100-Year Mean Return Period Hurricane-
Related Winds
100-Year Event
Percent-Probability of Sustaining Damage
Facility Type Loss of Days Minor Moderate Severe Complete
EOC 0 0.3% - 0.6% 0.0% 0.0% 0.0%
Medical 0 0.1% - 0.2% 0.0% 0.0% 0.0%
Police 0 0.3% - 0.6% 0.0% 0.0% 0.0%
Fire 0 0.2% - 0.3%Section 4.3.8: Risk Assessment - Hurricane and Tropical Storm
Impact on Economy
Damage to structures from flooding and wind can be the most immediate result of hurricane wind events;
however, this damage can have long-lasting impacts on the economy. When a business is closed during storm
recovery, there is lost economic activity in the form of day-to-day business and wages to employees. Overall,
economic impacts include the loss of business function (e.g., tourism, recreation), damage to inventory,
relocation costs, wage loss and rental loss due to the repair/replacement of buildings. As evidenced by Hurricane
Sandy, the State of New Jersey, including Hunterdon County, lost millions of dollars in wages and economic
activity.
Hazus estimates the total economic loss associated with each storm scenario (direct building losses and business
interruption losses). Direct building losses are the estimated costs to repair or replace the damage caused to the
building. This is reported in the “Impact on General Building Stock” subsection discussed earlier. Business
interruption losses are the losses associated with the inability to operate a business because of the wind damage
sustained during the storm or the temporary living expenses for those displaced from their home because of the
event. Refer to Table 4.3.8-10 for a summary of Hazus estimated economic losses for Hunterdon County caused
by the 100-year and the 500-year MRP hurricane wind events.
Table 4.3.8-10 Estimated Economic Losses for the 100-Year and 500-Year Mean Return Period
Hurricane Wind Events
Building and
Mean Return Inventory Relocation Content Rental
Period (MRP) Loss Loss Losses Wages Losses Losses Income Losses
100-year MRP $0 $170,000 $12,680,380,000 $0 $50 $0
500-year MRP $560,000 $2,184,030,000 $79,370,450,000 $54,680,000 $741,720,000 $30,070,000
Source: Hazus 4.2; Hunterdon County GIS 2020; RS Means 2020
Notes: MRP = Mean Return Period
Debris management can be costly and impact the local economy. Hazus estimates the amount of debris that
might be produced as result of the 100- and 500-year MRP wind events. Because the estimated debris production
does not include debris generated by flooding, this is likely a conservative estimate and could be higher if
multiple impacts occur. According to the Hazus Hurricane User Manual, estimates of weight and volume of
eligible tree debris consist of downed trees that would likely be collected and disposed at public expense. Refer
to the User Manual for additional details regarding these estimates. Table 4.3.8-11 summarizes the estimated
debris by municipality for the 100- and 500-year MRP wind events, which should be considered a lower-bound
analysis.
Table 4.3.8-11 Debris Production for 100- and 500-Year Mean Return Period Hurricane-Related Winds
Brick and Wood Concrete and Steel Tree Eligible Tree Volume
(tons) (tons) (tons) (cubic yards)
100- 500- 100- 100-
Jurisdiction Year Year Year 500-Year Year 500-Year 100-Year 500-Year
Alexandria (Twp) 12 231 0 0 0 2,332 0 2,046
Bethlehem (Twp) 0 102 0 0 0 0 0 0
Bloomsbury (B) 0 22 0 0 0 0 0 0
Califon (B) 0 17 0 0 0 0 0 0
Clinton (T) 4 60 0 0 91 317 610 2,137
DMA 2000 Hazard Mitigation Plan Update – Hunterdon County, New Jersey 4.3.8-17
May 2021Section 4.3.8: Risk Assessment - Hurricane and Tropical Storm
Brick and Wood Concrete and Steel Tree Eligible Tree Volume
(tons) (tons) (tons) (cubic yards)
100- 500- 100- 100-
Jurisdiction Year Year Year 500-Year Year 500-Year 100-Year 500-Year
Clinton (Twp) 27 368 0 0 0 1,760 0 2,910
Delaware (Twp) 56 424 0 0 2 6,682 3 5,080
East Amwell (Twp) 39 279 0 0 0 5,474 0 3,737
Flemington (B) 10 133 0 0 69 279 538 2,159
Franklin (Twp) 9 251 0 0 0 2,235 0 1,657
Frenchtown (B) 2 57 0 0 0 1,257 0 930
Glen Gardner (B) 0 34 0 0 0 0 0 0
Hampton (B) 0 26 0 0 0 0 0 0
High Bridge (B) 0 51 0 0 0 0 0 1
Holland (Twp) 12 181 0 0 0 776 0 703
Kingwood (Twp) 11 265 0 0 0 5,843 0 4,322
Lambertville (C) 34 278 0 0 0 289 0 1,994
Lebanon (B) 4 43 0 0 57 170 327 983
Lebanon (Twp) 0 114 0 0 0 1 0 1
Milford (B) 2 44 0 0 0 444 0 390
Raritan (Twp) 135 1,037 0 0 1,634 8,490 3,857 18,785
Readington (Twp) 25 514 0 0 1,163 6,561 1,812 9,911
Stockton (B) 4 34 0 0 0 535 0 406
Tewksbury (Twp) 18 171 0 0 0 0 0 1
Union (Twp) 10 170 0 0 0 1,318 1 1,545
West Amwell (Twp) 17 222 0 0 0 4,882 0 3,486
Hunterdon County
431 5,128 0 0 3,015 49,646 7,149 63,185
(Total)
Source: Hazus 4.2; Hunterdon County GIS 2020
Notes: B – Borough; C – City; T – Town; Twp. – Township
Impact on the Environment
According to the State of New Jersey 2019 Hazard Mitigation Plan, coastal storms can impact various natural
land resources that can be easily uprooted by major wind events and storm surge. Extreme winds from hurricanes
or tropical storms may create several tons of debris because the wind tears apart foliage and trees in Hunterdon
County. Plants along waterways may be uprooted from surge causing even further instability and alterations of
the shoreline. Consequentially, natural habitat that shelters the County from wind and storm surge can be
destroyed, impacting future mitigation (NJOEM 2019).
The impacts of hurricane related windstorms on the environment typically take place over a larger area. Where
these events occur, widespread, severe damage to plant species is likely. This includes uprooting or destruction
of trees and an increased threat of wildfire in areas where dead trees are not removed. Section 4.3.5 (Flood)
provides additional environmental impacts due to flooding from heavy rainfalls.
DMA 2000 Hazard Mitigation Plan Update – Hunterdon County, New Jersey 4.3.8-18
May 2021Section 4.3.8: Risk Assessment - Hurricane and Tropical Storm
Future Changes that May Impact Vulnerability
Understanding future changes that effect vulnerability in the County can assist in planning for future
development and ensure establishment of appropriate mitigation, planning, and preparedness measures. The
County considered the following factors to examine potential conditions that may affect hazard vulnerability:
Potential or projected development
Projected changes in population
Other identified conditions as relevant and appropriate, including the impacts of climate change
Projected Development
Understanding future changes that impact vulnerability in the Hunterdon County can assist in planning for future
development and ensuring that appropriate mitigation, planning, and preparedness measures are in place. It is
anticipated that any new development and new residents will be exposed to the hurricane and tropical storm
hazard. However, due to increased standards and codes, new development might be less vulnerable to wind-
related hazards compared to the aging building stock. The tables and hazard maps included in the jurisdictional
annexes contain additional information regarding the specific areas of development that would increase County
vulnerability to a wind event.
Projected Changes in Population
Hunterdon County has experienced a decrease in population of approximately 2.5-percent between 2010 and
2018. According to the American Community Survey 5-year population estimates, in 2018 Hunterdon County
had a population of 125,051. The Township of West Amwell and the Borough of Bloomsbury have experienced
the greatest decline with a decrease of 27.8-percent and 17.1-percent, respectively. Projections for the County’s
population vary, as population counts have fluctuated over the past few years. Whereas the population declined
from 2015 to 2016, it increased from 2016 to 2017 and again from 2017 to 2018 (U.S. Census 2018).
Even though the population has decreased over the past decade, any changes in the density of population can
impact the number of persons exposed to hurricanes and tropical storms. As the population changes, so will the
number of people impacted by this hazard.
Effect of Climate Change on Vulnerability
As discussed above, most studies project that the State of New Jersey will see an increase in average annual
temperatures and precipitation. An increase in temperatures may also lead to an increase in the frequency and
intensity of coastal storms. More frequent and severe storms will increase the County’s vulnerability to both
wind-related and storm surge impacts.
The northeast region of the United States has experienced a greater increase in extreme precipitation than any
other region in the U.S. between 1958 and 2010, the Northeast experienced more than 70% increase in the
amount of precipitation falling in rain events (Global Change 2014). Refer to Section 4.3.5 (Flood) for a
discussion related to the impact of climate change due to increases in rainfall. An increase in storms will produce
more wind events and may increase tornado activity. With an increased likelihood of strong winds and tornado
events, all the County’s assets will experience additional risk for losses as a result of extreme wind events.
Change of Vulnerability Since the 2016 HMP
Since the 2016 analysis, population statistics have been updated using the 2014-2018 American Community
Survey. The Hazus wind analysis was performed in Hazus v4.2 for Hunterdon County and was based on the
most current and best available data, including building and critical facility inventories. The general building
stock was also updated using RS Means 2020 building valuations that estimated replacement cost value for each
DMA 2000 Hazard Mitigation Plan Update – Hunterdon County, New Jersey 4.3.8-19
May 2021Section 4.3.8: Risk Assessment - Hurricane and Tropical Storm
building in the inventory. This provides an up-to-date look at the entire building stock for Hunterdon County
and gives more accurate results for the exposure and loss estimation analysis. Additionally, the 2016 critical
facility dataset was updated by the County.
DMA 2000 Hazard Mitigation Plan Update – Hunterdon County, New Jersey 4.3.8-20
May 2021You can also read