Dust devils as observed by Mars Pathfinder
←
→
Page content transcription
If your browser does not render page correctly, please read the page content below
JOURNAL OF GEOPHYSICAL RESEARCH, VOL. 108, NO. E12, 5133, doi:10.1029/2000JE001421, 2003

Dust devils as observed by Mars Pathfinder
Francesca Ferri,1,2 Peter H. Smith,3 Mark Lemmon,4 and Nilton O. Rennó5
Received 1 November 2000; revised 31 July 2003; accepted 2 September 2003; published 11 December 2003.

[1] Dust devils are localized meteorological phenomena frequently observed in terrestrial
dry lands and desert landscapes as well as on Mars. They are low-pressure, warm core
vortices that form at the bottom of convective plumes and loft dust from the surface. They
move with the speed of the ambient wind and are tilted by wind shears. The Mars
Pathfinder detected dust devils as dust plumes in the Imager for Mars Pathfinder images
and as low-pressure convective vortices in the meteorological Mars Pathfinder
Atmospheric Structure Investigation/Meteorology (ASI/MET) experiment data. The
Pathfinder data have been analyzed in terms of dust devil size, spatial distribution, and
frequency of occurrence. The results show that the Pathfinder imaging and MET
observations are consistent with each other and with the observations made by the Viking
1 Orbiter and Mars Global Surveyor. The dust devil’s ability to loft dust into the
atmosphere has been investigated and a thermodynamic theory for dust devils has been
used to calculate their physical parameters relevant to dust transport. The dust devils
observed in an active day provide a pumping rate larger than the dust-settling rate derived
from the optical obscuration of the Pathfinder rover solar panels. Therefore dust devils are
a major factor in transporting dust from the surface to the atmosphere at the Pathfinder
site.   INDEX TERMS: 6225 Planetology: Solar System Objects: Mars; 5409 Planetology: Solid Surface
Planets: Atmospheres—structure and dynamics; 3322 Meteorology and Atmospheric Dynamics: Land/
atmosphere interactions; 5445 Planetology: Solid Surface Planets: Meteorology (3346); KEYWORDS: dust
devils, Mars, Pathfinder
Citation: Ferri, F., P. H. Smith, M. Lemmon, and N. O. Rennó, Dust devils as observed by Mars Pathfinder, J. Geophys. Res.,
108(E12), 5133, doi:10.1029/2000JE001421, 2003.

1. Introduction                                                            are the combined coexistence of deep convective plumes
                                                                           and ambient vorticity.
  [2] When the midday Sun heats the ground, warm air
                                                                             [3] The existence and intensity of a dust devil depends on
immediately above the surface raises generating convective
                                                                           the depth of the convective plume and the presence of wind
plumes. As pockets of warm air rise, they frequently interact
                                                                           shears. Intense free convection occurs under conditions of
with the ambient wind field and causes air moving toward
                                                                           deep convective layer, super-adiabatic temperature lapse
the center of the updraft to spin while attempting to
                                                                           rate, and strongly heated surface (large surface heat flux).
conserve angular momentum. Surface friction reduces the
                                                                           The Viking and Pathfinder landers confirmed that these
angular momentum of the spinning air parcels and perturbs
                                                                           conditions are met near local midday in the summer
the balance between centrifugal and pressure gradient
                                                                           hemisphere of Mars, where dust devils are frequently
forces. The decrease in the centrifugal forces makes the
                                                                           observed between 9 am to 3 pm local time. They last as
near surface warm air to nconverge toward the vortex
                                                                           long as the convective plume is active and vorticity is
center. The radial inflow into the rising plume, in turn,
                                                                           present. When a dust devil moves across a cold terrain,
increases the concentration of the ambient vorticity. If dust
                                                                           the convective plume is cut-off by the decrease in surface
is entrained in the rising vortex, it becomes a dust devil. The
                                                                           heat flux and the dust column disappears.
conditions for the generation of these convective vortices
                                                                             [4] Dust devils have been observed on Mars by the
                                                                           Vikings orbiters and landers [Ryan and Lucich, 1980;
                                                                           Thomas and Gierasch, 1985], by the Mars Pathfinder
   1
     Center of Studies and Activities for Space (CISAS), ‘‘G. Colombo,’’   [Schofield et al., 1997; Metzger et al., 1999] and by the
University of Padova, Padova, Italy.                                       Mars Global Surveyor (MGS) camera [Edgett and Malin,
   2
     Also at Planetary and Space Sciences Research Institute (PSSRI),
Open University, Milton Keynes, UK.
                                                                           2000]. MGS images show an extensive network of dust
   3
     Lunar and Planetary Laboratory, University of Arizona, Tucson,        devil tracks globally distributed around the planet and
Arizona, USA.                                                              changing seasonally.
   4
     Texas A and M University, College Station, Texas, USA.                  [5] Dusty conditions seem to be normal in the Martian
   5
     Department of Atmospheric, Oceanic and Space Sciences, University
of Michigan, Ann Arbor, Michigan, USA.
                                                                           atmosphere as shown by observations from ground and
                                                                           space. Even before their detection, Martian dust devils have
Copyright 2003 by the American Geophysical Union.                          been hypothesized to be important in the initiation of large
0148-0227/03/2000JE001421$09.00                                            dust storms [Neubauer, 1967; Gierasch and Goody, 1973]

                                                                      7-1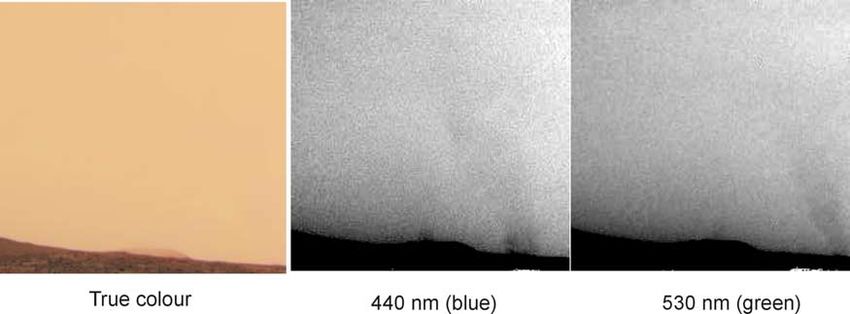
7-2                       FERRI ET AL.: DUST DEVILS AS OBSERVED BY MARS PATHFINDER

         Figure 1. Twin Peaks and dust devils over the North Peak. Top: true color image of Mars based upon
         three filters (670, 530 and 440 nm), showing the panorama including the Twin Peaks as seen from the
         Pathfinder. The image has been derived from the frames taken near local noon on sol 10. There exist two
         dust devils (‘‘167’’ and ‘‘161’’) hidden in the haze, near the North Twin Peak. They are revealed in the
         blue filter frames by flat field correction and contrast enhancement. Bottom: two dust plumes are barely
         visible in two panorama frames in blue filter taken 6 min apart, looking at the North Twin Peak (the
         white spots on the horizon at the right and on the land are just ghosts of the Martian surface present in the
         frame used as flat field).

and in the maintenance of the general atmospheric dust           for Mars Pathfinder (IMP) images containing the horizon. A
content [Ryan and Lucich, 1980]. In the absence of other         possible detection, not confirmed by other data, has been
dust entrainment mechanisms, the Martian dust-settling rate      recorded in the atmospheric opacity data. The pressure
is rapid enough to clear the atmosphere over a period of a       sensor has recorded the signatures of the passage of 79
few weeks after a global dust storm [Pollack et al., 1979].      vortices. None of these events have been verified with
Some process replenishes atmospheric dust to maintain the        images because of the lack of simultaneous measurements
constant optical depth observed by past Mars Landers.            in both instruments.
Strong local vortices (dust devils) are more efficient in
entraining dust from the surface into the atmosphere than        3. Dust Plumes in the Imager for Mars Pathfinder
horizontal winds. Therefore dust devils may be the primary       Images
dust entrainment mechanism on Mars.
  [6] We have searched all Pathfinder’s horizon images for         [8] The Martian atmosphere is dusty, and the sky at the
faint dust devils, and Mars Pathfinder Atmospheric Struc-        horizon has essentially the same color as the dust devils
ture Investigation/Meteorology (ASI/MET) observations to         with a contrast of typically 1– 3%. Dust devils, illuminated
detect signatures of the passage of small-scale vortices over    by the Sun, appear as dark shadow plumes. The presence of
the Pathfinder meteorological sensors. The location and size     the dust plumes in the images of the Imager for Mars
of the dust devils observed in images have been estimated        Pathfinder (IMP) has been revealed through contrast manip-
using a model based only on the assumption that they move        ulation. Since the Martian aerosols have a low reflectance in
with the speed of a constant ambient wind. A scaling theory      blue wavelengths, it is easier to detect dust devils in images
for dust devils [Rennó et al., 1998, 2000] is used to           taken with the blue filter (440 nm).
calculate the values of the physical parameters of Martian         [9] A true color image of the Martian sky at the horizon,
dust devils and to estimate their potential to pump dust into    based upon the superposition of three filters (red, green, and
the atmosphere.                                                  blue) is shown at the top of Figure 1. The image, showing
                                                                 the panorama including the Twin Peaks as seen from the
                                                                 Pathfinder, has been derived from frames taken near the
2. Data Analysis                                                 local noon on sol 10. There are two dust devils hidden in
  [7] In the Pathfinder data set, dust devils have been          this image. They are revealed through contrast enhancement
detected as dust plumes in the images and as convective          of the frames in the blue filter.
vortices in the ASI/MET temperature, pressure and wind             [10] Previous work, using spectral differencing tech-
measurements. Fourteen dust plumes were found in Imager          niques revealed five localized dust plumes in IMP images
FERRI ET AL.: DUST DEVILS AS OBSERVED BY MARS PATHFINDER 7-3
Table 1. Dust Devils Found in IMP Imagesa from a frame of the same sol containing large portion of
Estimated sky.
Dust Devil Time, Azimuth, Distance, Estimated Size, [11] Almost all frames containing features recognized as
Number Date h deg km m dust devils are from ‘‘Gallery Panorama’’ sequence from
002 Sol 2 15:06:03 91.0 6.98 – sols 10 and 11. The only exception is a dust devil detected
149 Sol 10 11:16:59 334.2 5.51 – on sol 2, before the IMP mast was deployed. For the Gallery
Couch Sol 10 11:34:12 305.7 17.18 245
230b
Panorama sequence, the IMP camera stepped in a counter-
161 Sol 10 11:40:30 287.3 13.86 92 clockwise direction sequentially imaging through the red
145b (670 nm), green (530 nm) and blue (440 nm) filters [Smith
165 Sol 10 11:52:12 262.3 7.93 126 et al., 1997a]. During sol 10, the IMP imaged an area
167 Sol 10 11:58:12 250.2 1.67 15 between azimuths 248 and 360 with the top of the frame
11b
STP Sol 11 12:16:08 230.1 4.52 76 at 13 in elevation, between 11 am and 12 am (local time);
114b on sol 11 the azimuth range was from 126 to 262 between
58c 12 am and 1 pm. The only other frame containing a dust
Vague Sol 11 12:22:01 222.8 2.68 – plume was recorded on sol 2 at 89.8 azimuth at 3 pm.
177 Sol 11 12:33:47 196.5 1.02 –
Small Sol 11 12:39:40 187.6 10.82 103
Fourteen contrast features in the IMP blue filter images have
135b been recognized as dust devils (see Table 1). Nine of them
MMfar Sol 11 12:45:40 177.3 15.42 455 have also been observed in the green filter and three also in
221b the red filter. Since the time interval for changing filters and
MMnear Sol 11 12:45:40 182.1 6.55 242 acquiring new images is 20 s, the change in the azimuth
196b
183 Sol 11 12:51:32 166.8 24.03 573 position of the dust plumes in images with different filters
387 Sol 11 12:34:55 203.3 5.95 84 indicates their angular velocity. Figures 1, 2, 3 and 6 show
132b some of the dust plumes detected by this survey. Figure 2
a
IMP, Imager for Mars Pathfinder. shows the same dust devil (‘STP’) as observed at the three
b
Estimated in images taken with green filter. different filters near local noon on sol 11 near South Twin
c
Estimated in images taken with red filter. Peak (233 in azimuth). The dust devil moves from 1,
from 231 to 230, in a time span of 36 s.
acquired at midday [Metzger et al., 1999]. Our survey, [12] The IMP images containing dust devils and the
based on contrast manipulation of frames with different frames used as flat field are listed in Table 2 as reference.
filters, resulted in the detection of new dust devils and in Another potential detection of a dust devil passage by IMP
the determination of the position and size of the dust is suggested by the sudden increase of the atmospheric
plumes. We also monitored the motion of these dust opacity on sol 14. The atmospheric extinction caused by
plumes as multifilter images of the same scene were dust has been monitored throughout the mission by imaging
acquired. All IMP images containing the horizon were the sun at different filters [Smith et al., 1997b]. On sol 14
searched for dust features. The analysis consists of the opacity was mostly stable, except for a single event at
varying the contrast range of the images divided by a 11:00 am when the opacity value was up to 0.1 in all
flat field in order to distinguish localized dust plumes filters (see Figure 4); this transient event may be a dust devil
from the general haze. The sky flat field was selected [Smith and Lemmon, 1999]. There are no simultaneous
Figure 2. Image taken on sol 11 at 12:45 pm local time. The true color image on the left was derived
from a combination of the three filters. At the horizon, it is possible to distinguish a misty mountain: Far
knob (at 30.6 km from the lander). Two dust plumes are hidden in the haze. Their presence is revealed
by contrast enhancing of images taken with blue and green filters. The two dust plumes (‘‘MM near’’ and
‘‘MM far’’) move from west to east. In the red filter (not shown) the central dust devil is visible, while
only the upper part of the dust plume is seen on the image on the right, because the dust devil was still out
of the field of view of the camera.7-4 FERRI ET AL.: DUST DEVILS AS OBSERVED BY MARS PATHFINDER
Figure 3. A dust plume as observed in images with the three different filters near the South Twin Peak
at local noon on sol 11. The dust devil position has been determined in images with different filters.
Images with the red filter (670 nm) (the one at the right side) shows a faint dust devil (‘‘STP’’) that can be
seen in subsequent images, with green filter (530 nm) at the center, and with blue filter (440 nm) on the
left, the dust devil is moves from north to south while being imaged.
meteorological measurements to confirm whether or not a with the ambient wind. The ambient wind is assumed to
vortex passed over the lander at this same time. maintain a constant velocity and direction each day between
9 am and 3 pm.
4. Location and Size of the Dust Plumes 4.1. Azimuth Position and Angular Width of the
[13] The location and size of observed dust plumes have Dust Plumes
been estimated from their azimuth position and angular [14] The azimuth position of dust plumes and their angular
width on the IMP frames, on the basis of geometrical size have been empirically determined by measuring the
considerations, and the assumption that dust devils move obscuration feature that a dust devil generates against the
Table 2. IMP Images Containing Dust Devils
Dust Devil Local Standard
Name Sol Time, h Image File Name Filter
002 2 15.101 i1246853726l.img_0030020002 blue
149 10 11.283 i1247556039r.img_0164020149 blue
Couch 10 11.576 i1247557124r.img_0164020157 blue
11.571 i1247557104r.img_0164020087 green
161 10 11.675 i1247557488r.img_0164020161 blue
11.669 i1247557468r.img_0164020091 green
165 10 11.870 i1247558212r.img_0164020165 blue
11.865 i1247558193r.img_0164020095 green
167 10 11.970 i1247558577r.img_0164020167 blue
11.964 i1247558557r.img_0164020097 green
STP 11 12.269 i1247648441r.img_0165020171 blue
12.264 i1247648422r.img_0165020101 green
12.259 i1247648405r.img_0165020031 red
Vague 11 12.367 i1247648803r.img_0165020173 blue
177 11 12.563 i1247649531r.img_0165020177 blue
Small 11 12.661 i1247649893r.img_0165020179 blue
12.657 i1247649878r.img_0165020109 green
12.654 i1247649861r.img_0165020039 red
MM 11 12.761 i1247650261r.img_0165020181 blue
12.755 i1247650241r.img_0165020111 green
12.751 i1247650224r.img_0165020041 red
183 11 12.859 i1247650625r.img_0165020183 blue
12.855 i1247650606r.img_0165020113 green
387 11 12.582 i1247649609r.img_0165020387 blue
Frames used as flat fields
FF 2 13.512 i1246854235l.img_0030020014 blue
FF 10 11.772 i1247557849r.img_0164020163 blue
FF 10 11.768 i1247557830r.img_0164020093 green
FF 11 12.465 i1247649166r.img_0165020175 blue
FF 11 12.483 i1247649240r.img_0165020385 blue
FF 11 12.657 i1247649878r.img_0165020109 green
FF 11 12.259 i1247648405r.img_0165020031 redFERRI ET AL.: DUST DEVILS AS OBSERVED BY MARS PATHFINDER 7-5
dusty haze limits visibility and reduces contrast. The furthest
geological feature detected on IMP images is Far Knob,
which is located at 30.6 km from the lander; it looks like a
misty mountain.
[16] Simple geometrical considerations (see Figure 6)
determine the location of the observed dust plumes with
respect to the lander. Since the dust devils are pushed by the
wind, the time interval between consecutive frames in
different filters multiplied by the wind speed gives the
distance D = t*vwind that the dust devil has traveled.
The distances from the Pathfinder lander to dust devils, at
the different instants (as the same dust plume is imaged in
different filters) are given by
sinðJ2 aÞ
d1 ¼ D ð1Þ
sinðJ2 J1 Þ
Figure 4. Atmospheric opacity versus local time derived
from images with filters of 450 nm (circle), 670 nm
sinðJ1 aÞ
(squares), 883 nm (diamonds), and 989 nm (triangles) on d2 ¼ D ð2Þ
sol 14 [Smith and Lemmon, 1999]. The high opacity sinðJ2 J1 Þ
recorded in all filters at 11:00 must have been a transient
event like a dust devil or dust plume. where a is the assumed wind direction, q1 and q2 are
respectively the azimuth positions of the dust devil in
consecutive images with different filters, and D is the true
sky. In order to reduce noise, the pixel values from the distance traveled by the plume.
columns in one JPEG compression block (8 8 pixels) have [17] There are three independent ways of estimating the
been averaged (see Figure 5). The azimuth position has been true distance of dust devils from the lander:
assumed to correspond to the minimum intensity, while the [18] 1. First, the ambient wind velocity transporting the
angular width has been measured at the half intensity values. dust devil is assumed to be 10 m/s and 240 which leads to
Estimating the azimuth motion of the same dust plume in solution for (1) and (2). Among all dust devils found in IMP
frames taken with different filters, the angular velocity of the images, the closest one was at 1.5 km from the lander while
dust devil has been calculated. All dust devils observed on the furthest was at 24 km.
sol 10 move clockwise, while the ones on sol 11 move [19] 2. The second method can be used with even a single
counterclockwise. Some of the dust plumes are tilted, prob- sighting by assuming a typical diameter for dust devils and
ably forced by wind shear; the ones from sol 10 are tilted calculating their distance with the measured angular width.
toward the right, while those from sol 11 toward the left. The The two methods should be consistent. The derived sizes of
dust devil observed on sol 2 (91 azimuth) is tilted toward observed dust plumes range from 15 to more than 550 m,
the right (see Figure 6). If we assume that the dust devils move but the peak of the distribution is between 100 and 200 m as
at the speed of the ambient wind, this suggests that the shown in Figure 9. These results are consistent with the
ambient wind is blowing from southwest and that wind shear values estimated from images of shadows of dust plumes,
tilts the tops forward (Figures 7 and 8). taken by the Viking 1 orbiter [Thomas and Gierasch, 1985].
[15] A simple geometrical model was developed to deter- [20] 3. The third estimate of the size of Martian dust
mine the actual distance and size of the dust devils, under the devils is based on the duration of their pressure drop while
assumption that they move with the ambient wind. The ASI/ moving over the Pathfinder MET station (see next section).
MET data [Schofield et al., 1997] suggests that during the The size of the vortices detected by the ASI/MET package
time in which dust devils were observed (from 9 am to 3 pm) were determined by assuming that they were moving with
the wind was blowing from southwest. Considering the ASI/ an ambient wind of 10 m/s. The sizes obtained by this
MET measurements of the wind direction [Schofield et al., method are consistent with the values derived geometrically
1997] and the wind velocity observed by the Viking 1 [Seiff from images of the plumes.
and Kirk, 1977], we assumed a uniform ambient wind of
10 m/s from 240 (azimuth). What we observe in the images is 4.2. Dust Devils as Detected by the Meteorological
the apparent position of these dust plumes as projected on the Experiment
horizon. A priori, we do not know their distance or true height [21] Several events in the meteorological data collected by
above the ground (their bottoms could be hidden below the the Viking 1 and 2 [Ryan and Lucich, 1980] and Pathfinder
horizon). Moreover, we detect just the part of dust plume [Schofield et al., 1997] landers have been interpreted as the
which is shadowed, and that depends on the relative orienta- passage of convective vortices. These events are character-
tion of the Sun and the axis of the dust column. Considering ized by short term variations in the measured surface pressure,
that the camera is mounted on a deployable boom at 1.5 m wind direction and air temperature over periods of tens of
above the surface [Smith et al., 1997a], the maximum detect- seconds. The distinctive property of these events is a drop in
able distance for a 1-km high plume, filling up at least a JPEG the atmospheric pressure associated with a rotating wind
compression block (8x8 pixels) above the horizon, has been vector. Specifically the Pathfinder Atmospheric Structure
geometrically computed to be more than 50 km. However, the Instrument/Meteorological Package (ASI/MET) recorded7-6 FERRI ET AL.: DUST DEVILS AS OBSERVED BY MARS PATHFINDER
Figure 5. Determination of the azimuth position and angular width of dust devils from their obscuration
features. In images taken on sol 10 a dust devil is visible on the right of the rock ‘‘Couch.’’ Each point at
the plot at the bottom shows the value of the intensity of one JPEG compression block (8 pixels wide).
The presence of a dust devil is clearly detectable through the drop in light intensity. The azimuth position
and width of the dust devil are determined by the location of the minimum value of the intensity and the
width at half maximum.
the passage of 79 vortices during the 83 sol mission [Murphy Assuming that the vortices move with an ambient wind of
and Nelli, 2002] when the atmospheric physical conditions 10 m/s, that corresponds to a core size of 200 m. This value is
were monitored continuously with a sampling rate adequate consistent with the geometrical calculation of dust devil sizes
to detect dust devils, at the time period that they are expected from dust plumes detected in IMP images. This method of
to occur. In Table 3 are reported 19 of these events for which measuring a vortex size gives a minimum, because it is not
we have derive the duration of the pressure drop. possible to know if their centers passed over the ASI/MET
[22] Figure 9 shows the signature of the passage of a dust sensors.
devil recorded by the ASI/MET sensors on sol 25. The data
shows a rapid pressure drop accompanied by shifts in wind
direction. The duration of the pressure minimum gives an 5. Statistics
indication of the dimension of the vortex core. The measured [23] The size and number of dust devils detected by the
amplitude of the pressure drop during the nineteen events Pathfinder ASI/MET and imager (IMP), are used to statis-
recognized to be vortices, or dust devils, is on average of 20 s. tically estimate the fractional area of the planet covered byFERRI ET AL.: DUST DEVILS AS OBSERVED BY MARS PATHFINDER 7-7
first approximation, the wind speed around a dust devil is
determined uniquely by the thermodynamics of its convec-
tive heat engine. The tangential wind speed around a dust
devil is given by
sffiffiffiffiffiffiffiffiffiffiffiffiffiffiffi
RTS p
va ð3Þ
pS
where R is the atmospheric specific gas constant, Ts and ps
are the ambient surface air temperature and pressure, and
p is the radial pressure drop across the vortex [Rennó et
al., 1998].
[25] The pressure drop across a dust devil [Rennó et al.,
1998, see equation (16)] is given by
gh cp T0 T1
p p1 p0 p1 1 exp
gh 1 R T1
Figure 6. Our geometrical scheme to determine dust ð4Þ
devils distance from the camera as they move with ambient
wind blowing from 240. The circle centered at the where p0 and T0 are the temperature and pressure at the
Pathfinder lander represents the distance to the dust plumes vortex center, p1 = ps and T1 = Ts are the temperature and
first seen in the Imager for Mars Pathfinder (IMP) frames. In pressure at large radial distance from the vortex center, g is
reality, a dust devil could be located closer or farther away the fraction of the mechanical energy consumed by friction
from the lander and therefore inside or outside the horizon near the surface, h is the thermodynamic efficiency, and cp is
circle. Assuming that dust devils move with the ambient the atmospheric heat capacity at constant pressure per unit
wind (10 m/s, direction 240), a dust devil, positioned in A, mass. The fraction of the total dissipation of mechanical
when imaged in subsequent frames, will be in B, having energy has been estimated to be g 1 and the
moved D meters in the wind direction. B’ is the apparent thermodynamic efficiency h 0.15 both on Earth and on
position on the horizon. The dashed lines mark the sector Mars [Rennó et al., 1998, 2000].
areas observed during sols 10 and 11. The arrows outside [26] The magnitude of the vertical wind speed within a
the horizon circle represent the angular movement of dust dust devil can be computed by equation (42) of Rennó and
devils observed on sols 10 and 11, while the box illustrates Ingersol [1996], that is
the vertical trend of the dust plumes sloping with the wind
shear. sffiffiffiffiffiffiffiffiffiffiffiffiffiffiffiffiffiffiffiffiffiffiffiffiffi
cp hFin
w ð5Þ
dust devils. Referring to the meteorological data, the aver- 8esR Tc3 m
age dust devil has a diameter of 200 m, while the IMP
data showed 6 dust devils in panoramic images of an active where e 0.5 is the thermal emissivity of the convective
day. The images cover an area of 9 108 m2 (a region of layer air, sR 5.67*108 Wm2K4 is the Stefan-
30 km of radius over a sector of 120). Considering that Boltzmann constant, Tc is the mean temperature of the
the panoramic images were taken during the 6 hours period convective layer, Fin is the input heat flux into the
of time in which dust devils are expected to occur (from convective heat engine (the surface sensible heat flux),
9 am to 3 pm), this results in 2 104 fraction of the and m is a dimensionless coefficient of turbulent dissipation
surface is covered by dust devils during their active period of mechanical energy [Rennó and Ingersol, 1996]. To
(9 am to 3 pm). Thus statistically 0.5 104 of the estimate m, both the length of the convective path (that is of
Martian surface is covered by dust devils. the convective circulation) and the length and velocity scale
of the most energetic eddies must be known [see Rennó and
Ingersol, 1996]. Since in homogeneous and isotropic
6. A Thermodynamic Model of a Dust Devil turbulence the most energetic eddies are the largest, we
[24] A thermodynamic theory for dust devils [Rennó et arbitrarily assume that the most energetic eddies have the
al., 1998, 2000] is used to compute their intensities and the length and velocity scale of the convective drafts. Assuming
values of their physical parameters relevant to the transport that the length of the convective path is 8 times the
of dust. The theory suggests that the presence of both thickness of the convective layer we estimate that m 50
convection and mechanisms for the generation of vorticity [Rennó and Ingersol, 1996; Rennó et al., 2000]. Using the
is essential for the genesis of dust devils. Since the flow above equations and the typical values of the meteorological
around a dust devil is, to a first approximation, in cyclo- parameters observed by the Pathfinder ASI/MET (surface
strophic balance, the bulk pressure drop between the ambi- average temperature Ts = 250 K, pressure ps = 7 hPa, Tc =
ent and its center determines its tangential wind speed. The 200K), we calculate the temperature perturbation pressure
bulk pressure drop, in turn, depends solely on the thermo- drop, tangential, and vertical velocities in Martian dust
dynamics of the dust devil convective heat engine. Thus to a devils.7-8 FERRI ET AL.: DUST DEVILS AS OBSERVED BY MARS PATHFINDER
Figure 7. The Mars Pathfinder landing site and the spatial distribution of the observed dust devils on
the Martian surface. Some surface features and their relative distance from the lander are shown, while
the dust devil positions have been marked with asterisks. The positions at which the dust devils were
located were estimated through geometrical considerations, assuming a uniform ambient wind of 10 m/s
from 240; the distance of those dust devils observed only in the blue filter were estimated assuming that
they were 200 m wide.
[27] The work performed by a dust devil convective heat component of the wind velocity within these dust devils,
engine is proportional to the radial pressure drop across its computed by equation (5), is w = 20 m/s.
center. Therefore the pressure drop provides a good estima-
tion for their intensity. Since ASI/MET measured this
pressure drop across some weak vortices ( 0.03 hPa), it
7. Role of Dust Devils in Mars’ Atmosphere
is possible to derive the value of the temperature at their [28] The role of dust devils is investigated on the basis of
center, or equivalently the value of the difference of the Pathfinder data to determine their importance in entrain-
temperature between the air inside and outside the vortex ing dust in the atmosphere. Dust devils have been hypoth-
as T 1.2 K. This value is consistent with Pathfinder’s esized to be important in the initiation of large dust storms
observations of the temperature perturbations in these weak, and as a source for the general atmospheric dust content
dust free vortices. It follows from equation (3) and (4) that [Neubauer, 1967; Gierasch and Goody, 1973; Ryan and
the tangential velocity around a thermodynamically efficient Lucich, 1980; Smith and Lemmon, 1999]. Because of their
dust devil (with convection extending though at least one large vertical velocities and turbulent flow near the ground,
temperature scale height) is 20 m/s. These are the typical dust devils are thought to be much more efficient in
dusty dust devils. In addition, the magnitude of the vertical pumping dust into the atmosphere than horizontal winds.FERRI ET AL.: DUST DEVILS AS OBSERVED BY MARS PATHFINDER 7-9
Table 3. Mars Pathfinder ASI/MET Observationsa
Pressure Drop, Duration,
Sol Local Time 101 Pa Sample Interval, s s
25 13:10 12 4 15
25 13:53 28 4 27
34 09:52 17 1 22
34 11:32 46 1 18
34 11:38 22 1 39
38 12:32 23 4 51
39 11:31 12 4 51
39 13:47 45 4 33
49 11:02 15 4 –
52 12:03 12 4 42
55 14:19 18 4 31
60 10:09 17 4 17
62 12:34 14 4 25
62 13:31 13 4 16
62 14:06 30 4 40
68 11:42 24 4 14
68 13:29 22 4 23
69 12:54 11 2 17
70 14:25 11 2 25
a
‘‘Dust devil’’ passages as indicated by measured pressure drops.
Figure 8. Histogram of dust devil diameters as observed
in the Pathfinder imager frames. The diameters of dust
devils observed in two consecutive IMP frames were devils are strong enough to initiate the process of saltation
estimated geometrically, knowing their angular size and of loose surface material [Pollack et al., 1976; Greeley et
distance from the lander. al., 1980] and consequently to propel sand particles via a
skipping motion and loft dust into the atmosphere.
[29] In the case of the Pathfinder, an increase in the [30] The atmospheric dust loading due to dust devils is
atmospheric opacity throughout the mission [Smith and calculated on the basis of the results of our analysis, and
Lemmon, 1999] occurred even as dust settling was observed IMP atmospheric opacity data. The dust devils observed in
onto the solar panels [Rover Team, 1997; Landis and the images of the Mars Pathfinder panoramic camera have
Jenkins, 2000] and the magnetic arrays [Hviid et al., 1997; 700 times the dust content of the local background
Madsen et al., 1999]. The variation in the atmospheric atmosphere [Metzger et al., 1999]. The dust content across
dust content from morning to night appears related to the a typical Martian dust devil is estimated to be Ld = 7
occurrence of dust devils at midday, therefore dust devils 104 kg/m3, where L is the path length through the dust devil
have been suggested to be the primary suppliers of dust to and d is its dust load [Metzger et al., 1999]. It follows from
the atmosphere of the Ares Vallis region [Smith and this that a 200 m dust devil has a load of 3.5 106 kg/m3.
Lemmon, 1999]. The computed wind velocities (see previ- Assuming a typical vertical velocity of 20 m/s, we
ous section) of thermodynamically efficient Martian dust find that dust flux in these dust devils is 7 105 kg/m2s.
Figure 9. Dust devil signature in the meteorological data of Pathfinder Atmospheric Structure
Investigation/Meteorology experiment [Schofield et al., 1997]. The plot shows the pressure, wind
direction and temperature variations associated with a small dust devil, passing over the lander on sol 25
at 11:30 am, LST. The measurements were taken at 4-s intervals. The pressure drop is accompanied by a
shift in wind direction.7 - 10 FERRI ET AL.: DUST DEVILS AS OBSERVED BY MARS PATHFINDER
Since the fractional area covered by dust devils in an active derived from the dust obscuration of the rover solar panels
day is 2 104 (see section 4), the dust flux due to dust [Rover Team, 1997; Landis and Jenkins, 2000].
devils is 3.6 109 kg/m2s at this particular day. This flux
is an order of magnitude larger than the observed deposition [35] Acknowledgments. The authors are very thankful to M. Tomasko
rate of 3 1010 kg/m2sl [Rover Team, 1997; Landis and for suggestions and assistance with the calculations. N. Renno thanks NSF
for partially supporting this research under grant SGER 0225555. F. Ferri
Jenkins, 2000]. Given the uncertainties of our calculations was supported by an ESA research fellowship.
and data analysis, this result confirms that dust devils
contribute significantly to the maintenance of dust in Mars’ References
atmosphere, perhaps even being the primary suppliers of dust Edgett, K. S., and M. C. Malin, Martian dust raising and surface albedo
into the atmosphere of the Ares Vallis. controls: Thin, dark (and sometimes bright) streaks and dust devils in
MGS MOC high resolution images, Lunar Planet. Sci. Conf., XXXI,
1073, 2000.
Gierasch, P. J., and R. M. Goody, A model of a martian great dust storm,
8. Conclusions J. Atmos. Sci., 30, 169 – 179, 1973.
Greeley, R., R. Leach, B. White, J. Inversen, and J. Pollack, Threshold wind
[31] Mars Pathfinder has detected dust devils as dust speeds for sand on Mars: Wind tunnel simulations, Geophys. Res. Lett., 7,
plumes in IMP frames and as convective vortices in ASI/ 121 – 124, 1980.
MET measurements. A reanalysis of the Pathfinder data Hviid, S. F., et al., Magnetic properties experiment on the Mars Pathfinder,
resulted in the detection of new features interpreted as dust Science, 278, 1768 – 1770, 1997.
Landis, G. A., and P. P. Jenkins, Measurement of the settling rate of
devils. More than fourteen dust plumes (including five atmospgheric dust on Mars by the MAE instrument on Mars Pathfinder,
previously detected by Metzger et al. [1999]) have been J. Geophys. Res., 105, 1855 – 1857, 2000.
detected in the IMP frames containing the horizon. Seventy- Madsen, M. B., S. F. Hviid, H. P. Gunnalaugsson, J. M. Knudsen, W. Goetz,
C. T. Pedersen, A. R. Dinesen, C. T. Mogensen, M. Olsen, and R. B.
nine events in the meteorological records of the ASI/MET Hargraves, The magnetic properties experiments on Mars Pathfinder,
sensors have been interpreted as the passage of vortices that J. Geophys. Res., 104, 8761 – 8780, 1999.
likely could contain dust. Metzger, S. M., J. R. Johnson, J. R. Carr, T. J. Parker, and M. Lemmon,
Dust devils vortices seen by the Mars Pathfinder Camera, Geophys. Res.
[32] Their angular position and sizes within the frames Lett., 26, 2781 – 2785, 1999.
have been measured. The angular velocity of the dust Murphy, J. R., and S. Nelli, Mars Pathfinder convective vortices: Frequency
plumes imaged in different filters has been estimated. of occurrence, Geophy. Res. Lett., 29, 1 – 4, 2002.
Starting with the assumption that dust devils move with a Neubauer, F. M., Thermal convection in the Martian atmosphere, J. Geo-
phys. Res., 71, 2419 – 2426, 1967.
uniform ambient wind of 10 m/s, the location and actual Pollack, J. B., R. Haberle, R. Greeley, and J. Inversen, Estimates of the wind
size of the observed dust devils have been geometrically speeds required for particle motion on Mars, Icarus, 29, 395 – 417, 1976.
determined. The distance of the dust devils observed from Pollack, J. B., D. S. Colburn, R. Kahn, J. Hunter, W. Van Camp, C. E.
Carlston, and M. R. Wolf, Properties of aerosols in the Martian atmo-
the Pathfinder lander range from 1.5 km up to 24 km, while sphere, as inferred from Viking Lander imaging data, J. Geophys. Res.,
their size distribution is peaked at 100– 200 m. 82, 4479 – 4496, 1977.
[33] The role of the dust devils in supplying dust to the Pollack, J. B., D. S. Colburn, F. M. Flasar, R. Kahn, C. E. Carlston, and
D. Pidek, Properties and effects of dust particles suspended in the Martian
Martian atmosphere has been investigated on the basis of atmosphere, J. Geophys. Res., 84, 2929 – 2945, 1979.
the Pathfinder ASI/MET and IMP data. A simple physical Rennó, N. O., and A. P. Ingersol, Natural convection as a heat engine: A
model of the general characteristics of the Martian dust theory for CAPE, J. Atmos. Sci., 53, 572 – 585, 1996.
devils has been derived from a scaling theory developed to Rennó, N. O., M. L. Burkett, and M. P. Larkin, A simple thermodynamical
theory for dust devils, J. Atmos. Sci., 55, 3244 – 3252, 1998.
explain dust devils [Rennó et al., 1998, 2000]. Through the Rennó, N. O., A. A. Nash, J. Lunine, and J. Murphy, Martian and Terrestrial
use of this simple thermodynamic model of dust devils and dust devils: Test of a scaling theory using Pathfinder data, J. Geophys.
the physical conditions monitored by ASI/MET, the inten- Res., 105, 1859 – 1865, 2000.
Rover Team, Characterization of the Martian surface deposits by the Mars
sity and physical parameters of Martian dust devils were Pathfinder rover, Sojourner, Science, 278, 1765, 1997.
estimated. The computed tangential velocities are strong Ryan, J. A., and R. D. Lucich, Possible dust devils, vortices on Mars,
enough to initiate saltation [Pollack et al., 1977; Greeley et J. Geophys. Res., 88, 11,005 – 11,011, 1980.
Schofield, J. T., J. R. Barnes, D. Crisp, R. M. Haberle, S. Larsen, J. A.
al., 1980] and consequently to entrain dust into the Martian Magalhães, J. R. Murphy, A. Seiff, and G. Wilson, The Mars Pathfinder
atmosphere. These results, while slightly different from the Atmospheric Structure Investigation/Meteorology (ASI/MET) experi-
ones inferred by Metzger et al. [1999], are in very good ment, Science, 278, 1752 – 1758, 1997.
agreement with the results of previous observations by the Seiff, A., and D. B. Kirk, Structure of the atmosphere of Mars in summer at
mid-latitudes, J. Geophys. Res., 82, 4364 – 4377, 1977.
Viking orbiter [Thomas and Gierasch, 1985] and more Smith, P. H., and M. Lemmon, Opacity of the Martian atmosphere mea-
recent observations by the Mars Global surveyor [Edgett sured by the imager for Mars Pathfinder, J. Geophys., 104, 1999.
and Malin, 2000]. Smith, P. H., et al., The imager for Mars Pathfinder experiment, J. Geophys.
Res., 102, 4003 – 4026, 1997a.
[34] Metzger et al. [1999] calculated the dust loading Smith, P. H., et al., Results from the Mars Pathfinder Camera, Science, 278,
within a Martian dust devil using a Montecarlo scattering 1758 – 1764, 1997b.
model and the atmospheric opacity observations of the Thomas, P., and P. Gierasch, Dust devils on Mars, Science, 230, 175 – 177,
1985.
Pathfinder camera. Combining this value with statistical
analysis of dust devil detections by the Pathfinder, the dust
transport into the atmosphere has been estimated. The esti- F. Ferri, Center of Studies and Activities for Space (CISAS)
‘‘G. Colombo,’’ University of Padova, I-35131 Padova, Italy. (francesca.
mated value is comparable to the observed dust deposition ferri@unipd.it)
rate on the rover solar panels [Rover Team, 1997; Landis and M. Lemmon, Texas A and M University, College Station, TX 77843,
Jenkins, 2000] and the magnetic arrays [Hviid et al., 1997; USA.
Madsen et al., 1999]. This confirms that dust devils are a N. O. Rennó, Department of Atmospheric, Oceanic and Space Sciences,
University of Michigan, Ann Arbor, MI 48109, USA.
major source for entraining dust into the Martian atmosphere P. H. Smith, Lunar and Planetary Laboratory, University of Arizona,
with pumping rate comparable to the dust settling rate as Tucson, AZ 85721, USA.You can also read