3D Printing of Gelled and Cross-Linked Cellulose Solutions; an Exploration of Printing Parameters and Gel Behaviour - MDPI
←
→
Page content transcription
If your browser does not render page correctly, please read the page content below
bioengineering

Article
3D Printing of Gelled and Cross-Linked Cellulose
Solutions; an Exploration of Printing Parameters and
Gel Behaviour
Tim Huber 1,2, * , Hossein Najaf Zadeh 2,3 , Sean Feast 2,4 , Thea Roughan 1 and Conan Fee 1,2
 1    School of Product Design, University of Canterbury, Private Bag 4800, Christchurch 8020, New Zealand;
      tlr50@uclive.ac.nz (T.R.); conan.fee@canterbury.ac.nz (C.F.)
 2    Biomolecular Interaction Centre, University of Canterbury, Private Bag 4800, Christchurch 8020,
      New Zealand; hossein.najafzadeh@pg.canterbury.ac.nz (H.N.Z.); sean.feast@pg.canterbury.ac.nz (S.F.)
 3    Department of Mechanical Engineering, University of Canterbury, Private Bag 4800, Christchurch 8020,
      New Zealand
 4    Department of Chemical and Process Engineering, University of Canterbury, Private Bag 4800,
      Christchurch 8020, New Zealand
 *    Correspondence: tim.huber@canterbury.ac.nz

 Received: 19 February 2020; Accepted: 25 March 2020; Published: 27 March 2020

 Abstract: In recent years, 3D printing has enabled the fabrication of complex designs, with low-cost
 customization and an ever-increasing range of materials. Yet, these abilities have also created an
 enormous challenge in optimizing a large number of process parameters, especially in the 3D printing
 of swellable, non-toxic, biocompatible and biodegradable materials, so-called bio-ink materials.
 In this work, a cellulose gel, made out of aqueous solutions of cellulose, sodium hydroxide and
 urea, was used to demonstrate the formation of a shear thinning bio-ink material necessary for an
 extrusion-based 3D printing. After analysing the shear thinning behaviour of the cellulose gel by
 rheometry a Design of Experiments (DoE) was applied to optimize the 3D bioprinter settings for
 printing the cellulose gel. The optimum print settings were then used to print a human ear shape,
 without a need for support material. The results clearly indicate that the found settings allow the
 printing of more complex parts with high-fidelity. This confirms the capability of the applied method
 to 3D print a newly developed bio-ink material.

 Keywords: bioprinting; cellulose; hydrogel; physical cross-linking

1. Introduction
     3D printing, often also referred to as additive manufacturing, of biopolymers has attracted growing
attention within the last few years. A large and increasing amount of 3D printing techniques is being
developed, of which a large fraction fall within the categories of inkjet 3D printing, stereolithography
printing and extrusion based 3D printing [1,2]. Currently, the most used polymers in 3D printing
are polylactic acid (PLA), acrylonitrile butadiene styrene (ABS) and nylon, but a growing number of
new materials have become available to be used on 3D printers, and both consumers and producers
are developing printing materials based on natural polymers, driven by a need for more sustainable
practices [3]. A comprehensive overview of 3D printing technology and available materials is beyond
the scope of this work but is available for example in the work of [1] or [3].
     Bioprinting as a subsection of 3D printing has also seen rapid and astonishing developments,
and has been a major contributor towards the development of 3D printable natural materials and
biopolymers, mostly in the form of hydrogels. In this case, the motivation for material development
stems from a need for swellable, non-toxic, biocompatible and possible biodegradable materials also

Bioengineering 2020, 7, 30; doi:10.3390/bioengineering7020030              www.mdpi.com/journal/bioengineering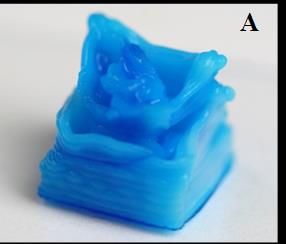
Bioengineering 2020, 7, 30                                                                          2 of 12

known as bio-ink materials, as the main application of bioprinting has been in tissue engineering
and regenerative medicine [4–7]. A key aspect of bio-ink material development is the so-called
biofabrication window, an attempt to describe the compromises that need to be made to achieve the
highest print fidelity without compromising the ability of the printed material to function as a tissue
scaffold [8,9]. This window is not only specific to the used bio-ink material but also depends on the
used hardware including the used print setting, for example extrusion pressure, print speed or line
height and width [10,11].
      Polysaccharides such as alginate, hyaluronic acid or chitosan and proteins in the form of collagen
and gelatine have been of particular interest and have been successfully printed into complex
three-dimensional structures [12]. Most bioprinters rely on extrusion-based 3D printing, meaning the
printing material needs to undergo a phase change from liquid to solid during the printing process. In
bioprinting this often involves either a gelation process of a solution or, more commonly, thixotropic of
a gel [13]. Cellulose is the most abundant biopolymer in the world and has been demonstrated to be
a suitable polymer for applications in, for example, tissue engineering, filtration or separation [14].
However, cellulose in its native form is not water soluble and thus has proven challenging to process
on bioprinters, either requiring the use of nanocellulose to form thixotropic and thus extrudable gels or
suitable solvents to create cellulose solutions within a viscosity range that allows extrusion [15].
      Only a few aqueous and non-aqueous solvents have been proven to be suitable for the
processing of cellulose, but for most, the viscosity of the resulting solutions is not suitable for
bioprinting or the solutions require a solvent exchange process to solidify the cellulose out of the
solvent. Cellulose dissolved in the ionic liquid 1-ethyl-3-methylimidazolium acetate exhibited a shear
thinning behaviour that made it suitable for extrusion printing [15] and a solution of cellulose in
N-methylmorpholine-N-oxide (NMMO) has been successfully extruded on a bioplotter [16]. However,
no other non-derivative cellulose solution has been reported to be printable by similar methods and
thus little is known about the biofabrication window of cellulose.
      Cellulose can be readily dissolved in aqueous solutions of sodium hydroxide (NaOH) and
urea, and while this solvent system is often described as attractive due its relatively low cost and
low-toxicity, solubility is limited to no more than 6–8 wt.% depending on the type of cellulose used [17].
However, both, the solution viscosity and the properties of cellulose hydrogels made from this solvent
can be adjusted by introducing additional amounts of undissolved cellulose particles as a physical
cross-linker [18]. Cellulose solutions based on NaOH and urea also show a unique, irreversible
gelation behaviour when heated [19,20]. This behaviour has been explored previously to 3D print
non-derivatized cellulose using a focused laser beam to locally heat the cellulose solution beyond its
gelation point [21]. While there is a significant amount of work published on the cellulose solution,
little is known about the behaviour of the gelled solution [17]. In this work we will explore if the
cellulose gel can be 3D printed using an extrusion based bioprinter to create three-dimensional objects
and determine print related parameters of the biofabrication window.

2. Materials and Methods

2.1. Chemicals
      NaOH (99% purity) was purchased in pellets from The Sourcery (Christchurch, NZ). Urea (BioUltra,
purity of 99.5%) and cellulose powder (Sigmacell (type 20, 20µm) were purchased from Sigma-Aldrich
(St. Louis, MO, USA). All chemicals were used as received.

2.2. Preparation of Cellulose Formulation
     For each print session, deionized water (81 wt.%), urea (12 wt.%) and NaOH (7 wt.%) were
measured and mixed using a Velp Scientifica (Usmate Velate, Italy) DLS overhead stirrer at
100 rpm [17,19,20,22]. After mixing for approximately 5 min, the mixture was heated to 50 ◦ C
under light stirring on a hot plate (Heidolph Instruments. Schwabach, Germany). After heating,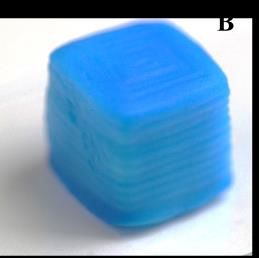
Bioengineering 2020, 7, 30                                                                            3 of 12

20 wt.% of cellulose was added to solvent mixture and stirred using a Velp Scientifica DLS overhead
stirrer on 100–120 rpm for 2 minutes. The formulation was then cooled in a freezer set to −18 ◦ C for
90 minutes to dissolve the cellulose. Subsequently, the solution was stored in a refrigerator at 5 ◦ C until
used for printing or rheometry measurements. This formulation was decided upon from previous
trial and error experimentation, altering the weight percentage of the cellulose added to solution. 15,
20 and 25 wt.% cellulose solutions were prepared and extruded along a line from a 10 mL disposable
syringe with 0.425 mm diameter and 0.5 mm length metal tip. The extruded gels were graded based
on how well they held their shape and how easily they were extruded. From this basic test 20 wt.%
cellulose was decided upon for further investigation.

2.3. Rheometry
     Oscillatory measurements and rotational measurements were carried out using the Anton Paar
Modular Compact Rheometer 302 (Anton Paar, Graz, Austria). For both measurements, the measuring
system used was a parallel plate 50 (PP50) and the cell used was a Peltier plate. The temperature was set
at 20 ◦ C for all measurements. In total, 12 tests were carried out for the oscillatory measurements and
5 tests were carried out for the rotational tests. Each test was conducted with a cellulose formulation
made no older than 5 days before being tested.

2.4. Oscillatory Measurements
      For the oscillatory measurements, 4 different angular frequencies were tested 3 times each, the
frequencies were 0.5 rad/s, 5 rad/s, 50 rad/s and 500 rad/s with a shear ramp of 0.1–1000%. For each
test there were 41 data points plotted. Once the fresh sample was measured, the same sample was
then sheared at constant shear strain of 100%, at 50rad/s for an interval of 120s. After the sample was
sheared, the initial settings were used to measure the sheared sample.

2.5. Rotational Measurements
     1 test was conducted and repeated 5 times with a shear rate of 0.001–1000 1/s which plotted 91 data
points with no set duration. The fresh sample was measured and then sheared using a constant shear
rate of 100 1/s at a constant interval of 120 s. Once the sample was sheared, the settings from the initial
measurements were used to measure the sheared sample.

2.6. Printing Parameters
     A Taguchi L9 orthogonal array [23] was used to reach the optimum 3D printing setting of cellulose
gel with the minimum number of trials at a minimum cost. The optimum level of the process could be
gained by applying a standard analysis. Since the aim of the experiments was to 3D print the nearly
cubic shape of samples, a standard analysis was chosen to be “nominal is the best”. The experiment was
conducted with multi-response results.
     Analysis of variance was done on the mean and Signal to Noise (S/N) ratio (Equation (1)). The
collected measurements from the experiments were analysed using Minitab software (Minitab LLC,
State College, PA, USA). The two important factors studied based on the preliminary tests were print
pressure and print speed. The trialled settings are displayed in Table 1. The printing acceleration was
kept constant to 4 [mm/s2 ] and printing line-width and line-height were set to 0.8 mm. The structure
of Taguchi’s orthogonal robust design and the results of the measurement are shown in Table 2. The
measured parameters were top surface area [mm2 ], side height [mm], side width [mm] and side view
angles [◦ ].
                                          S/N = −10 × log s2                                         (1)

where s is the standard deviation of the responses for all noise factors for the given factor
level combination.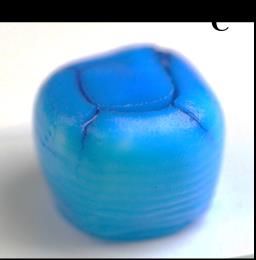
Bioengineering 2020, 7, 30                                                                                                 4 of 12

       Table 1. List of the conducted print trials at varying settings for extrusion pressure and print speed.

           Trial        Pressure [psi]        Speed [mm/s]         Trial           Pressure [psi]        Speed [mm/s]
               1                  8                 3               10                  14                    3
               2                  8                 3               11                  14                    3
               3                  8                 3               12                  14                    3
               4                  8                 5               13                  14                    5
               5                  8                 5               14                  14                    5
               6                  8                 5               15                  14                    5
               7                  8                 6               16                  14                    6
               8                  8                 6               17                  14                    6
               9                  8                 6               18                  14                    6
               19                20                 3               23                  20                    5
               20                20                 3               24                  20                    5
               21                20                 3               25                  20                    6
               22                20                 5               26                  20                    6
                                                                    27                  20                    6

                             Table 2. Results of the L9 orthogonal array tests and measurements.

      Pressure          Speed          Top Area      Side Height      Side Width
                                                                                             Angle 1 [◦ ]    Angle 2 [◦ ]
        [psi]          [mm/s]           [mm2 ]          [mm]             [mm]
           8                 3           80.75           8.63               9.38               121.75             96.34
           8                 5           72.65           7.26               7.86               113.58             107.66
           8                 6           60.12           6.89               7.34               110.01             114.15
          14                 3           86.24           8.92               9.44                92.12             95.79
          14                 5           87.69           9.63               9.34               101.60             102.16
          14                 6           74.45           8.39               9.86               116.77             95.59
          20                 3           156.09          11.40             11.97               135.07             131.64
          20                 5          143.216         11.362             12.384              127.77          123.962
          20                 6           141.6          11.005             12.496              130.728         137.068
                        Max              156.09          11.4              12.49               135.07             137.06
                        Min              60.12           6.89               7.34                92.12             95.59

     Cellulose formulations were prepared and loaded into a 16 mm diameter, 92 mm length barrel
then centrifuged in an Eppendorf Centrifuge 5430 (Eppendorf, Hamburg, Germany) at 3000 rpm for
3 minutes to remove any air bubbles. After centrifugation, the barrel was then fitted with a 0.425 mm
diameter and 0.5 mm length metal tip. The barrel was loaded into the Advanced Solutions Biobot (Life
Sciences–Advanced Solutions, Louisville, KY, USA). For each trial, a cube with a side length of 10 mm
was printed. All printing trials were carried out using Tissue Structure Information Modeling (TSIM® )
software (Life Sciences– Advanced Solutions).
     After a cube was printed, it was removed from the print stage and placed in 60 mL of deionized
water for 24 hours to regenerate the cellulose. The water was changed regularly until full regeneration
and solvent removal had occurred, as checked by measuring the pH of the water. After regeneration,
the cubes were stored in a closed bottle of 60 mL deionized water and a spray of ethanol.
     After the 27 samples were completed, pictures were taken of the top view and side view of each
cube using a Toupcam UCMOS01300KPA camera and ToupView software (Touptek, Zheijang, China)
Bioengineering 2020, 7, 30 5 of 12
attached to a Nikon SMZ-1B confocal microscope (Nikon, Tokyo, Japan) for analysing. ImageJ Fiji
software (National Institutes of Health, Bethesda, MD, USA) was used to analyse the cubes. The top
surface area, width and length of the side view and all 4 angles of both top view and side view were
measured and recorded.
3. Results
3.1. Rheometry
To understand the behaviour of the created gels under shear, the viscosity of the gels was measured
over a large2020,
Bioengineering range
7, xof shear
FOR PEERstresses,
REVIEWto simulate stresses that occur during extrusion printing (Figure 1).
5 of 12
1000000
100000
10000
Viscosity [Pas]
1000
100
10
1
0.1
0.001 0.01 0.1 1 10 100 1000
Shear rate [1/s]
unsheared sample pre-sheared sample
Figure 1. Viscosity
Figure 1. Viscosityofofthethe cellulose
cellulose gel gel measured
measured over over
shear shear rate. Shown
rate. Shown are ofresults
are results a gel inofunsheared
a gel in
unsheared and presheared
and presheared state. state.
The gels
The gels show
show aa continuous
continuous shear
shear thinning
thinning behaviour,
behaviour, demonstrating
demonstrating aa continuous
continuous alignment
alignment
of the
of the polymer
polymer chainchain inin the
the gel.
gel. A
A behaviour
behaviourthat thatisisalso
alsoseen
seenin in ungelled
ungelledsolutions
solutionsof ofcellulose
cellulose[24].
[24].
Cellulose gels made from aqueous solutions of NaOH and urea are typically
Cellulose gels made from aqueous solutions of NaOH and urea are typically formed by the disruption formed by the disruption
of aa so-called
of so-called inclusion
inclusion complex
complex uponupon heating.
heating. In In the
the solution
solution state,
state, the
the inclusion
inclusion complex
complex has has been
been
described as a sleevelike layer of solvent that surrounds the polymer chains
described as a sleevelike layer of solvent that surrounds the polymer chains and prevents interchain and prevents interchain
hydrogen-boding. When
hydrogen-boding. Whenheated,
heated,those
thosecomplexes
complexesappear appearto to break
break down,
down, allowing
allowing new new hydrogen
hydrogen
bonds to
bonds to form
form resulting
resulting inin rapid
rapid and
and irreversible
irreversible gelation
gelation of of the
the solution
solution [25,26].
[25,26]. The
The added
added cellulose
cellulose
powder acts as a physical cross-linker promoting further hydrogen
powder acts as a physical cross-linker promoting further hydrogen bonding and in turn strongerbonding and in turn stronger
gels
gels [18]. The shear thinning behaviour can be explained by the constant
[18]. The shear thinning behaviour can be explained by the constant breakage and reformation of breakage and reformation of
those hydrogen bonds between aligning polymer chains and the suspended
those hydrogen bonds between aligning polymer chains and the suspended cellulose particles. cellulose particles. Similar
behaviour
Similar was for example
behaviour seen and seen
was for example deemedandpreferable for a bio-ink
deemed preferable formaterial
a bio-ink based on carrageenan
material based on
and suspended nanosilicates [27].
carrageenan and suspended nanosilicates [27].
It is
It is assumed
assumed thatthat upon
upon removal
removal of of the
the shear
shear stress,
stress, aa new
new gelgel will
will be
be formed
formed andand no no permanent
permanent
damage to the gel has occurred. This was further investigated by shearing
damage to the gel has occurred. This was further investigated by shearing the sample at a constantthe sample at a constant rate,
followed
rate, followedby a shear sweepsweep
by a shear (Figure 1). While
(Figure the initial
1). While the viscosity of the presheared
initial viscosity gel is lower
of the presheared than
gel is the
lower
original gel, likely due to chain alignment, the shear thinning behaviour is identical
than the original gel, likely due to chain alignment, the shear thinning behaviour is identical in the in the presheared
gel, meaning
presheared nomeaning
gel, permanent nodamage
permanentto the gel hastooccurred.
damage the gel hasIn turn, this means
occurred. the this
In turn, viscosity
means of the
the
gels can be easily modified to allow printing over a large range of shear stresses.
viscosity of the gels can be easily modified to allow printing over a large range of shear stresses.
To further investigate the effect of shear on the gel properties, oscillatory measurement over a
range of shear strain were performed at different angular frequencies on unsheared and presheared
samples (Figure 2). The sample showed a viscoelastic behaviour with the storage modulus G’ being
larger than the loss modulus G” by approximately a factor of 10 at strains below approximately 10%
for both tested gels as exemplarily shown for a frequency of 0.5 rad/s. At higher strains the gels start
to yield leading to a cross over G’ and G” at higher strains. This yielding behaviour is common forBioengineering 2020, 7, 30 6 of 12
To further investigate the effect of shear on the gel properties, oscillatory measurement over a
range of shear strain were performed at different angular frequencies on unsheared and presheared
samples (Figure 2). The sample showed a viscoelastic behaviour with the storage modulus G’ being
larger than the loss modulus G” by approximately a factor of 10 at strains below approximately 10%
for both tested gels as exemplarily shown for a frequency of 0.5 rad/s. At higher strains the gels start
to yield leading to a cross over G’ and G” at higher strains. This yielding behaviour is common for
colloidal gels and indicates initial gel rupture followed by a further break down of gel fragments into
finely dispersed particles that allow the gel to flow [28]. An overall reduction between of G’ and G”
is observable between unsheared and presheared gels, as well as a reduction of the loss factor (the
ratio of G’: G”) by approximately 50% in the viscoelastic range. This supports the assumption that
upon shearing, the gel is broken down into fine fragments, but upon removal of the strain, it is able to
Bioengineering 2020, 7, x FOR PEER REVIEW 6 of 12
form a new, secondary gel through the extensively available hydrogen groups in the dissolved and
suspended
particles and portions of cellulose,
potentially as well [29].
gel fragments as interparticle forces
This in turn meansbetween the dispersed
that although the gelcellulose
is likelyparticles
to yield
and
underpotentially
the sheargel fragments
stresses [29].printing,
during This in turn
the means that of
formation although the gelgel
a secondary is likely to yield
will still under
allow the
a rapid
shear stresses during printing, the formation of a secondary gel will still allow a rapid
solidification of the gel fragments into a secondary gel, and thus, allow for an extrusion of the used solidification of
the gel fragments
cellulose gels. into a secondary gel, and thus, allow for an extrusion of the used cellulose gels.
10000
1000
Modulus [Pa]
100
10
1
0.1 1 10 100 1000
Shear strain [%]
G"(0.5 rad/s) presheared G'(0.5 rad/sec) presheared
G"(0.5 rad/s) unsheared G'(0.5 rad/sec) unsheared
Figure 2.
Figure 2. Storage
Storage (G’)
(G') and
and Loss
Loss (G")
(G") modulus
modulus of
of unsheared
unsheared and
and presheared
presheared cellulose
cellulose gels
gels measured
measured
over shear strain at an angular frequency of 0.5 rad/sec.
over shear strain at an angular frequency of 0.5 rad/sec.
There
There appears
appears to
to be
be aa small
small frequency
frequency dependence
dependence of the secondary
of the secondary gelgel regarding
regarding the
the cross-over
cross-over
point
point of
of G’
G’ and
and G”
G” (Figure
(Figure 3)3) which
which can
can possibly
possibly be
be explained
explained by by aa frequency
frequency dependence
dependence of of the
the
inter-particle interactions [28]. However, given the complexity of interaction in the tested
inter-particle interactions [28]. However, given the complexity of interaction in the tested systems, systems,
further
further studies
studiesthat
thatgogo
beyond
beyond exploration of the
exploration ofprintability of the used
the printability of thecellulose gels will be
used cellulose necessary
gels will be
to understand those interactions with more certainty.
necessary to understand those interactions with more certainty.
10000
1000
Modulus [Pa]
100
10over shear strain at an angular frequency of 0.5 rad/sec.
There appears to be a small frequency dependence of the secondary gel regarding the cross-over
point of G’ and G” (Figure 3) which can possibly be explained by a frequency dependence of the
inter-particle interactions [28]. However, given the complexity of interaction in the tested systems,
further
Bioengineering studies
2020, 7, 30 that go beyond exploration of the printability of the used cellulose gels will be 7 of 12
necessary to understand those interactions with more certainty.
10000
1000
Modulus [Pa]
100
10
1
0.1 1 10 100 1000
Shear strain [%]
G"(0.5 rad/s) G'(0.5 rad/sec) G"(5 rad/s)
G'(0.5 rad/sec) G"(50 rad/sec) G' (50 rad/sec)
Figure
Figure 3. 3. Storage
Storage (G') and
(G’) and Loss Loss
(G")(G") modulusof
modulus of a
a presheared
presheared cellulose gel over
cellulose shearshear
gel over strain measured
strain measured
at angular
at angular frequencies
frequencies of 0.5,
of 0.5, 5 and5 and
50 50 rad/sec.
rad/sec.
Bioengineering 2020, 7, x FOR PEER REVIEW 7 of 12
3.2. Taguchi Analysis of Printing Parameters
3.2. Taguchi Analysis of Printing Parameters
Not all used combination of printing factors yielded printed cubes suitable for an analysis of print
Not all used combination of printing factors yielded printed cubes suitable for an analysis of
fidelity. Overall,print
thefidelity.
variance of printing factors created prints with a large range of desirable and poor
Overall, the variance of printing factors created prints with a large range of desirable
print fidelity (Figure
and poor4).
print fidelity (Figure 4).
5 mm 5 mm
5 mm
Figure 4. Examples of printed gel cubes with an approximate side length of 10 mm. Shown are a cube
Figure 4. Examples
printedof printed
with gelextrusion
insufficient cubes ofwith anoverflowing
gel (A), approximateamountsside lengthgel
of extruded of(C)
10and
mm. closeShown
to are a cube
ideal print settings
printed with insufficient (B). Cubes
extrusion ofhave
gelbeen
(A),dyed blue using food
overflowing colouring for
amounts ofbetter contrast gel
extruded in the(C) and close to
displayed photos.
ideal print settings (B). Cubes have been dyed blue using food colouring for better contrast in the
displayed photos.
The best 3D printed gel cube should have a flat surface with the closest surface area to 10 mm 2,
corners of 90°, side view width of 10 mm, side view height of 10 mm. By changing the print settings,
the printed samples top area varied between 156.09 mm2 to 60.12 mm2 (Table 2).Bioengineering 2020, 7, 30 8 of 12
The best 3D printed gel cube should have a flat surface with the closest surface area to 10 mm2 ,
corners of 90◦ , side view width of 10 mm, side view height of 10 mm. By changing the print settings,
the printed samples top area varied between 156.09 mm2 to 60.12 mm2 (Table 2).
The analysis of variance for S/N ratio (Table 3) and analysis of variance for means (Table 4) show
that the pressure had a significant effect on 3D printing process with a contribution percentage of
99.9%, whereas speed has the minimum effect on the print quality with 25.7% contribution to the print
quality. The R2 was calculated to 96.12%.
Table 3. Analysis of variance for SN ratios.
Source DOF Sum of Square Variance F-ratio P
Pressure 2 16.2566 16.2566 61.89 0.001
Speed 2 0.0839 0.0839 0.32 0.743
Residual Error 4 0.5253 0.5253
Total 8 16.8659
Table 4. Analysis of variance for means.
Source DOF Sum of Square Variance F-ratio P
Pressure 2 1295.73 1295.73 100.88 0.000
Speed 2 2.98 2.98 0.23 0.803
Residual Error 4 25.69 25.69
Total 8 1324.39
The F-ratio displayed in Table 2 represents the confidence in the collected data. Experimentation
of the F-ratio in Tables 3 and 4 show the control factor ‘pressure’ with an F-ratio value of 61.89 and
100.88, for S/N ratio and variance of means respectively, have a very low experimental error.
The results from Taguchi analysis tests (mean and S/N ratio) are shown in Figures 5 and 6. A higher
S/N ratio, measured in decibels (dB), is preferred because a high value of S/N implies that the signal is
much higher2020,
Bioengineering than7, xthe
FORuncontrollable
PEER REVIEW noise parameters, such as inconsistency in the data measurement.
9 of 12
Figure 5.
Figure 5. Main
Main effect of the
effect of plot for
the plot for mean
mean values.
values.Bioengineering 2020, 7, 30 9 of 12
Figure 5. Main effect of the plot for mean values.
Figure
Figure 6.
6. Main
Main effects
effects plot
plot for
for S/N
S/N ratios.
ratios.
The
The main
main effect
effect graph
graph is
is plotted
plotted by
by determining
determining the
the means
means for
for each
each value
value of
of aa categorical
categorical variable.
variable.
The analysis
The analysisofofthe
the mean
mean value
value shows
shows that that pressure
pressure has a significant
has a significant effect oneffect on 3D
3D print printHowever,
quality. quality.
However, themean
the response response mean is
for speed foralmost
speed the
is almost the same
same across all across all parameter
parameter levels
levels (Table 5).(Table 5).
Table 5. Response
Table 5. Response table
table for
for S/N ratio.
S/N ratio.
Level Level Pressure
Pressure Speed Speed
1
1 −34.33
−34.33
−34.82 −34.82
2 −33.57 −34.80
2 −33.57 −34.80
3 −36.72 −35.01
3 −36.72 −35.01
Delta 3.15 0.21
Delta Rank 1
3.15 2 0.21
Rank 1 2
Based on the analysed results shown in Table 4, printing pressure has the highest impact on 3D
printing a high-quality
Based part. results
on the analysed Speed shown
has the in
lowest
Tableparameter
4, printingimpact on print
pressure quality.
has the Thus,
highest unlike
impact on
trial-and-error experiments that implicitly rely on the experimenter’s judgment, Taguchi
3D printing a high-quality part. Speed has the lowest parameter impact on print quality. Thus, design of
experiment has shown
unlike trial-and-error the best that
experiments combination
implicitly of
relycontrollable parameter judgment,
on the experimenter’s levels. The best setting
Taguchi design
of experiment has shown the best combination of controllable parameter levels. The best setting
combination from the analysis of the results for 3D printing an object can be seen from the main effect
of the plot for mean values (Figure 5) and the main effects plot for S/N ratio (Figure 6). These settings
include pressure of 14 psi and speed of 5 mm/s.
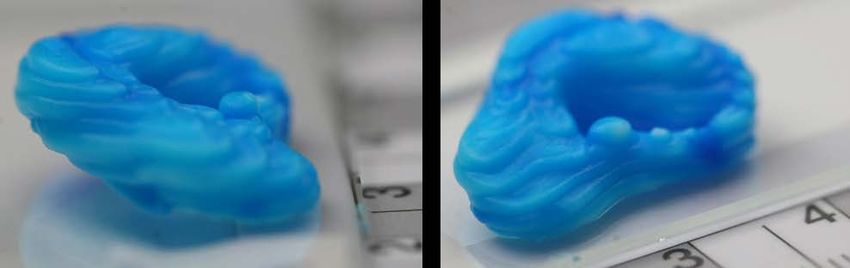
To validate the print settings found as optimal a complex three-dimensional shape in the form of
an ear was printed including overhanging structures, typically difficult to achieve without the use of
support material. The results (Figure 7) clearly indicate the found settings allow the printing of more
complex parts with high-fidelity, and thus, confirm the success of the applied method to find optimal
print settings for a newly developed bio-ink material.of the plot for mean values (Figure 5) and the main effects plot for S/N ratio (Figure 6). These settings
include pressure of 14 psi and speed of 5 mm/s.
To validate the print settings found as optimal a complex three-dimensional shape in the form
of an ear was printed including overhanging structures, typically difficult to achieve without the use
of support material. The results (Figure 7) clearly indicate the found settings allow the printing of
Bioengineering 2020, 7, 30
more complex parts with high-fidelity, and thus, confirm the success of the applied method to find 10 of 12
optimal print settings for a newly developed bio-ink material.
A B
Figure 7. Test prints of a model of a human ear using optimal settings for extrusion pressure and print
Figure 7. Test prints of a model of a human ear using optimal settings for extrusion pressure and print
speed derived from the Taguchi analysis of the print parameters. (A) End view of test print; (B) Side
speed derived from the Taguchi analysis of the print parameters. (A) End view of test print; (B) Side
view of test print.
view of test print.
4. Conclusions
4. Conclusions
An investigation into the printability of a novel cellulose-based bio-gel formed from dissolving
An investigation into the printability of a novel cellulose-based bio-gel formed from dissolving
excess cellulose in a solution of urea and sodium hydroxide has been conducted. Rheological testing
excesshascellulose
demonstratedin a solution
that the gelof urea and sodium
has shown hydroxide
two important has been
properties conducted.
needed Rheological testing
by all extrusion-based
has inks. The gel is shear thinning and additional to this, forms of a secondary gel structure post
demonstrated that the gel has shown two important properties needed by all shearing,
extrusion-based
inks.allowing
The gelthe gel to regain most of its structural integrity. The gel can therefore be easily extruded
is shear thinning and additional to this, forms of a secondary gel structure post shearing,
duringthe
allowing printing,
gel towhile
regainpost extrusion
most of its retaining
structural its integrity.
shape. TheThe secondary
gel can geltherefore
formed may be weaker
be easily extruded
duringdue printing,
to the initial yielding,
while alignment retaining
post extrusion of polymeritschains
shape. and dispersion
The secondary of the
gelgel fragments.
formed may be This
weaker
could impact the overall resolution of the printed gel due to slumping or reduced
due to the initial yielding, alignment of polymer chains and dispersion of the gel fragments. This could structural integrity
of the gel. Further analysis into the gel’s behaviour is required to fully understand this complex
impact the overall resolution of the printed gel due to slumping or reduced structural integrity of the
system. Analyses of some of the many variables involved in bioprinting by the Taguchi DoE method
gel. Further analysis into the gel’s behaviour is required to fully understand this complex system.
allowed for optimization of the gel’s printability. Alteration of pressure was shown to have the
Analyses of some of the many variables involved in bioprinting by the Taguchi DoE method allowed
greatest effect on the outcome of the print. This is not surprising as the extrusion rate is directly
for optimization
related to the of the gel’s
pressure i.e.,printability. Alteration
at higher pressure, more of gel
pressure was shown
is extruded. to have
Therefore, finerthe greatest
tuning effect on
of the
pressure setting will be the most beneficial to improving the print quality. A more detailed study
the outcome of the print. This is not surprising as the extrusion rate is directly related to the pressure
i.e., involving
at higher other variables,
pressure, moresuch gel isasextruded.
nozzle diameter and acceleration,
Therefore, finer tuningmay of the further improve
pressure printing
setting will be the
most accuracy
beneficialandto resolution.
improving Optimal settings
the print for pressure
quality. A more and speedstudy
detailed were involving
found and otherused to print a such
variables,
complex
as nozzle organic and
diameter shapeacceleration,
(human ear).may The printing of this structure
further improve printing shows the cellulose
accuracy gel was able
and resolution. Optimal
to handle slight overhangs without support material, while maintaining
settings for pressure and speed were found and used to print a complex organic shape (human ear). shape fidelity.
Prior to the development of this work cellulose was only able to be printed using solutions of
The printing of this structure shows the cellulose gel was able to handle slight overhangs without
ionic liquids or organic compounds [15,30]. This new bio-ink material offers a cheaper less toxic
support material, while maintaining shape fidelity.
alternative to bioprinting using one of the most abundant materials found on earth. Overall, the
Prior to the development of this work cellulose was only able to be printed using solutions of ionic
printability of this new bio-ink material is incredibly promising as an inexpensive alternative to
liquids or organic
current cellulosecompounds
based bio-ink [15,30].
materials.This
Asnew
withbio-ink
all new material offers a cheaper
bio-ink materials, less of
optimization toxic
not alternative
only
the formulation
to bioprinting usingbutonealsoof
printer settings
the most are required
abundant to ensure
materials the best
found possible
on earth. print. Here,
Overall, only one
the printability of
thisformulation
new bio-ink was tested; however,
material manypromising
is incredibly variations are as possible and will be
an inexpensive tested in future
alternative works.cellulose
to current
based bio-ink materials. As with all new bio-ink materials, optimization of not only the formulation
but also printer settings are required to ensure the best possible print. Here, only one formulation was
tested; however, many variations are possible and will be tested in future works.
Author Contributions: Conceptualization, T.H.; methodology, T.H., H.N.Z., S.F.; validation, T.H., H.N.Z., S.F.
and T.R.; formal analysis, T.H. and H.N.Z.; investigation, T.H., H.N.Z., S.F. and T.R.; data curation, T.H. and
H.N.Z.; writing—original draft preparation, T.H., H.N.Z., S.F. and T.R.; writing—review and editing, T.H. and S.F.;
supervision, T.H. and C.F.; project administration, C.F.; funding acquisition, C.F., T.H. All authors have read and
agreed to the published version of the manuscript.
Funding: This research was partially funded by the Summer Research Scholarship program, grant number 2019-27
and through the New Zealand Ministry of Business, Innovation and Employment Endeavour Fund, project title:
“3-D printed porous media for process engineering”.
Acknowledgments: The authors acknowledge the financial support for T.R. through the University of Canterbury
Summer Scholarship program. The authors are grateful for the technical assistance provided by Khoa Tran andBioengineering 2020, 7, 30 11 of 12
Garrick Thorne, and kindly acknowledge access to the rheometer provided by Associate Professor Ken Morrison
of the Chemical and Process Engineering department at the University of Canterbury.
Conflicts of Interest: The authors declare no conflict of interest.
References
1. Bikas, H.; Stavropoulos, P.; Chryssolouris, G. Additive manufacturing methods and modelling approaches:
A critical review. Int. J. Adv. Manuf. Technol. 2016, 83, 389–405. [CrossRef]
2. Bhushan, B.; Caspers, M. An overview of additive manufacturing (3D printing) for microfabrication.
Microsyst. Technol. 2017, 23, 1117–1124. [CrossRef]
3. Ngo, T.D.; Kashani, A.; Imbalzano, G.; Nguyen, K.T.; Hui, D. Additive manufacturing (3D printing): A review
of materials, methods, applications and challenges. Compos. Part B Eng. 2018, 143, 172–196. [CrossRef]
4. Ozbolat, I.; Gudapati, H. A review on design for bioprinting. Bioprinting 2016, 3, 1–14. [CrossRef]
5. Gudupati, H.; Dey, M.; Ozbolat, I. A Comprehensive Review on Droplet-based Bioprinting: Past, Present
and Future. Biomaterials 2016, 102, 20–42. [CrossRef] [PubMed]
6. Jian, H.; Wang, M.; Wang, S.; Wang, A.; Bai, S. 3D bioprinting for cell culture and tissue fabrication. Bio-Des.
Manuf. 2018, 1, 45–61. [CrossRef]
7. Richards, D.; Jia, J.; Yost, M.; Markwald, R.; Mei, Y. 3D bioprinting for vascularized tissue fabrication. Ann.
Biomed. Eng. 2017, 45, 132–147. [CrossRef]
8. Yin, J.; Zhao, D.; Liu, J. Trends on physical understanding of bioink printability. Bio-Des. Manuf. 2019, 2,
50–54. [CrossRef]
9. Gillispie, G.; Prim, P.; Copus, J.; Fisher, J.; Mikos, A.G.; Yoo, J.J.; Atala, A.; Lee, S.J. Assessment methodologies
for extrusion-based bioink printability. Biofabrication 2020, 12, 022003. [CrossRef]
10. Chimene, D.; Lennox, K.K.; Kaunas, R.R.; Gaharwar, A.K. Advanced bioinks for 3D printing: A materials
science perspective. Ann. Biomed. Eng. 2016, 44, 2090–2102. [CrossRef]
11. Gungor-Ozkerim, P.S.; Inci, I.; Zhang, Y.S.; Khademhosseini, A.; Dokmeci, M.R. Bioinks for 3D bioprinting:
An overview. Biomater. Sci. 2018, 6, 915–946. [CrossRef]
12. Arslan-Yildiz, A.; El Assal, R.; Chen, P.; Guven, S.; Inci, F.; Demirci, U. Towards artificial tissue models: Past,
present, and future of 3D bioprinting. Biofabrication 2016, 8, 014103. [CrossRef] [PubMed]
13. Zhang, B.; Luo, Y.; Ma, L.; Gao, L.; Li, Y.; Xue, Q.; Yang, H.; Cui, Z. 3D bioprinting: An emerging technology
full of opportunities and challenges. Bio-Des. Manuf. 2018, 1, 2–13. [CrossRef]
14. Kang, H.; Liu, R.; Huang, Y. Cellulose-Based Gels. Macromol. Chem. Phys. 2016, 217, 1322–1334. [CrossRef]
15. Wang, Q.; Sun, J.; Yao, Q.; Ji, C.; Liu, J.; Zhu, Q. 3D printing with cellulose materials. Cellulose 2018, 25,
4275–4301.
16. Li, L.; Zhu, Y.; Yang, J. 3D Bioprinting of Cellulose with Controlled Porous Structures from NMMO. Mater.
Lett. 2018, 210, 136–138. [CrossRef]
17. Budtova, T.; Navard, P. Cellulose in NaOH-water based solvents: A review. Cellulose 2016, 23, 5–55.
18. Huber, T.; Feast, S.; Dimartino, S.; Cen, W.; Fee, C. Analysis of the Effect of Processing Conditions on Physical
Properties of Thermally Set Cellulose Hydrogels. Materials 2019, 12, 1066. [CrossRef]
19. Qin, X.; Lu, A.; Zhang, L. Gelation behavior of cellulose in NaOH/urea aqueous system via cross-linking.
Cellulose 2013, 20, 1669–1677. [CrossRef]
20. Cai, J.; Zhang, L. Unique gelation behavior of cellulose in NaOH/urea aqueous solution. Biomacromolecules
2006, 7, 183–189. [CrossRef]
21. Huber, T.; Clucas, D.; Vilmay, M.; Pupkes, B.; Stuart, J.; Dimartino, S.; Fee, C. 3D Printing Cellulose Hydrogels
Using LASER Induced Thermal Gelation. J. Manuf. Mater. Process. 2018, 2, 42. [CrossRef]
22. Cai, J.; Zhang, L. Rapid dissolution of cellulose in LiOH/urea and NaOH/urea aqueous solutions. Macromol.
Biosci. 2005, 5, 539–548. [CrossRef]
23. Montgomery, D.C. Design and Analysis of Experiments; Wiley: Hoboken, NJ, USA, 1984.
24. Huber, T.; Starling, K.; Cen, W.S.; Fee, C.; Dimartino, S. Effect of Urea Concentration on the Viscosity and
Thermal Stability of Aqueous NaOH/Urea Cellulose Solutions. J. Polym. 2016, 2016, 1–9. [CrossRef]
25. Qin, X.; Lu, A.; Cai, J.; Zhang, L. Stability of inclusion complex formed by cellulose in NaOH/urea aqueous
solution at low temperature. Carbohydr. Polym. 2013, 92, 1315–1320. [CrossRef] [PubMed]Bioengineering 2020, 7, 30 12 of 12
26. Cai, J.; Zhang, L.; Liu, S.; Liu, Y.; Xu, X.; Chen, X.; Chu, B.; Guo, X.; Xu, J.; Cheng, H.; et al. Dynamic
self-assembly induced rapid dissolution of cellulose at low temperatures. Macromolecules 2008, 41, 9345–9351.
[CrossRef]
27. Wilson, S.A.; Cross, L.M.; Peak, C.W.; Gaharwar, A.K. Shear-thinning and thermo-reversible nanoengineered
inks for 3D bioprinting. ACS Appl. Mater. Interfaces 2017, 9, 43449–43458. [CrossRef]
28. Shao, Z.; Negi, A.S.; Osuji, C.O. Role of interparticle attraction in the yielding response of microgel
suspensions. Soft Matter 2013, 9, 5492–5500. [CrossRef]
29. Wyss, H.M.; Deliormanli, A.M.; Tervoort, E.; Gauckler, L.J. Influence of microstructure on the rheological
behavior of dense particle gels. AIChE J. 2005, 51, 134–141. [CrossRef]
30. Dai, L.; Cheng, T.; Duan, C.; Zhao, W.; Zhang, W.; Zou, X.; Aspler, J.; Ni, Y. 3D printing using plant-derived
cellulose and its derivatives: A review. Carbohydr. Polym. 2019, 203, 71–86. [CrossRef]
© 2020 by the authors. Licensee MDPI, Basel, Switzerland. This article is an open access
article distributed under the terms and conditions of the Creative Commons Attribution
(CC BY) license (http://creativecommons.org/licenses/by/4.0/).You can also read