MICROPLASTICS IN DRINKING WATER SOURCES AND DISTRIBUTION SYSTEMS IN ICELAND - RESOURCE INTERNATIONAL
←
→
Page content transcription
If your browser does not render page correctly, please read the page content below
Microplastics in drinking water sources
 and distribution systems in Iceland

                        RESOURCE INTERNATIONAL EHF
                                           Vallakór 4
                                        203 Kópavogi
                                      www.resource.is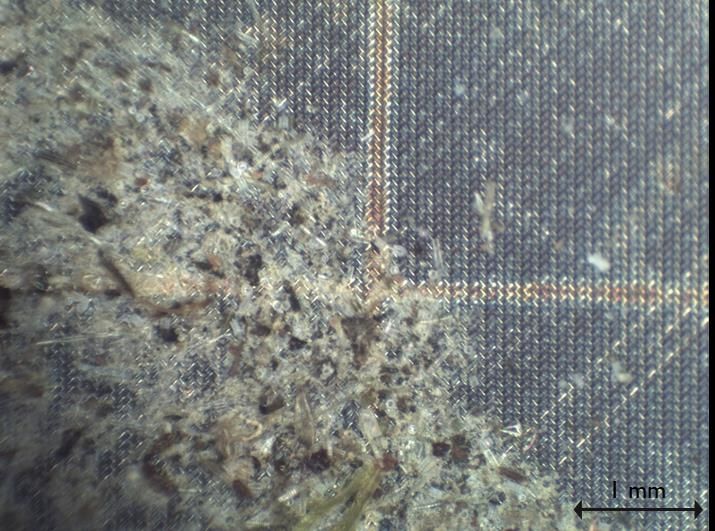
Contents
Abstract ...................................................................................................................................... 2
Authorship .................................................................................................................................. 2
1      Executive Summary ............................................................................................................ 3
       Context ......................................................................................................................................................................................3
       This study..................................................................................................................................................................................3
       Results .......................................................................................................................................................................................3
       Interpretation...........................................................................................................................................................................3
2      Introduction ........................................................................................................................ 4
3      Method ................................................................................................................................ 6
     3.1        Sampling ...................................................................................................................... 6
       Equipment ................................................................................................................................................................................6
       Sampling procedure...............................................................................................................................................................9
       Forensic methods in sampling.............................................................................................................................................9
     3.2        Analysis ...................................................................................................................... 10
       Pre-Counting ......................................................................................................................................................................... 11
       Staining & Digestion ........................................................................................................................................................... 11
       Rinse & Transfer ................................................................................................................................................................. 12
       Fluorescence Counting ....................................................................................................................................................... 12
       Forensic processing in laboratory .................................................................................................................................... 14
4      Results ................................................................................................................................ 15
     4.1        Pre-Counting Results.................................................................................................. 15
       Pre-Counting Results ........................................................................................................................................................... 16
     4.2        Results for particles fluorescing ................................................................................. 17
       Particle Shape....................................................................................................................................................................... 17
       Sample results: particles fluorescing .............................................................................................................................. 18
       Blank results: particles fluorescing.................................................................................................................................. 19
5      Discussion ......................................................................................................................... 20
       International comparison of the results ........................................................................................................................ 20
       Lower limits ........................................................................................................................................................................... 20
       Sampling and analysis method ........................................................................................................................................ 21
6      Conclusion......................................................................................................................... 22
7      References ......................................................................................................................... 23

    ReSource International ehf.                                                                                                                                                                   1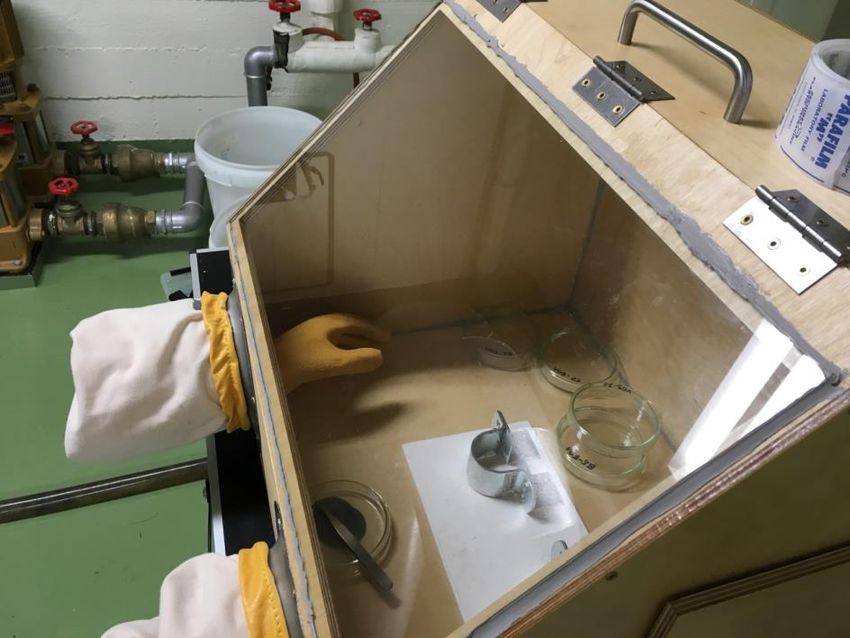
Abstract
This study was commissioned by Veitur, HS Orka and Norðurorka in order to assess
microplastics contamination in drinking water across the majority of consumer sources in
Iceland. A modified fluorescence microscopy method was used to tag microplastics of between
27µm and 5000µm with Nile red indicator dye. A total of 44 200 L triplicate samples were
collected from boreholes and distribution systems using forensic methods and filter blanks to
prevent and quantify processing contamination. Based on blank results, a detection threshold
of 0,09particles per litre (ppl) was set corresponding to a 1% false positive rate above the
threshold. All samples and all blanks contained fluorescent particles; 22 samples exceeded the
detection threshold; the mean particle count was 0,22ppl and the maximum 2,96ppl. In
international context, this appears to be lower than other studies using similar methods but
sufficient data for a thorough comparison is lacking. Lower values may be due to choices for
lower limits of particle size, cleanliness of sampling and analysis procedures, or that Icelandic
drinking water has less microplastic than in other studied sources.

Authorship
J.V. McQuilkin, L. Böhme, B.I. Alinaghizadeh, N.M. Proietti

 ReSource International ehf.                                                                  2
1 Executive Summary
Context
In recent years, scientists and the general public have gained an awareness of the presence of
microplastics (defined as synthetic polymers 100µm).
This study
This study attempted to balance scope and size of the study with precision; it represents one of
the largest national studies of drinking water and microplastics to date. It used the latest Nile
red fluorescent tagging methodology and significantly improved and developed this in the face
of previously unreported methodological issues. 44 samples were taken in Akureyri, Reykjavík,
Reykjanes, Akranes and Hvanneyri using forensic methodology, thereby sampling the vast
majority of consumer drinking water supplies in Iceland. Particles of 27-5000µm were
measured in samples of c.200l; particles under this size range are difficult to assess with the
human eye. Each sample had a paired blank to assess contamination, which was subtracted
from the final total and each point was sampled in triplicate.
Results
A detection limit (after subtraction of individual sample blanks) of 0,09 ppl was set based on
the distribution of all blank results; values over this amount are unlikely to be due to chance
contamination (p
2 Introduction
Research about microplastics in the environment and especially in drinks and food has been
intensified internationally during recent years. The newest research estimates that around
50 000 particles are ingested annually via air, food and drinks by one person (Cox et al., 2019);
this amounts to around 137 particles per day.
The European Chemicals Agency refers to microplastics as “any polymer, or polymer-
containing, solid or semi-solid particle having a size of 5mm or less in at least one external
dimension” (ECHA, 2018). The definition has been expanded to exclude “polymers that occur
in nature that have not been chemically modified“ (ECHA, 2019).
Tap and bottled water has been tested in several studies with different sampling and analytical
methods. Most use Raman or FTIR spectroscopy, precise but expensive techniques which limit
sample size; others use Rose Bengal or Nile red staining, which allows for faster sample
processing at the expense of precision and extent of the lower size range. Table 1 shows a
selection of studies on this topic. The measured range of microplastic contamination lies
between 0 to over 600ppl for tap water. This high range reflects the lack of a standard lower
limit on particle size, variations in the thoroughness contamination prevention procedures,
variations in the method used for analysis, and actual differences in microplastics content of
water. Thus, it is currently not possible to adequately compare the results of most studies
internationally.
The literature comparison reveals a high dependency on the investigated size ranges, with the
newest studies suggesting that the majority of particles are well below 10µm. Smaller particles
are, however, much more laborious to detect and background contamination in these sizes is
also more difficult to prevent. In general, due to the presence of microplastics in air
(particularly fibres) and most surfaces and substances that might be used in labs,
contamination can make up the vast majority of detected particles, and therefore blanks must
be used and strict procedures taken to reduce contamination.
In total 44 sample points, water from boreholes, groundwater, water in the distribution system,
storage tanks and for the end user, were chosen for this project after discussion with water
companies. The samples were taken from February to May 2019.

 ReSource International ehf.                                                                  4
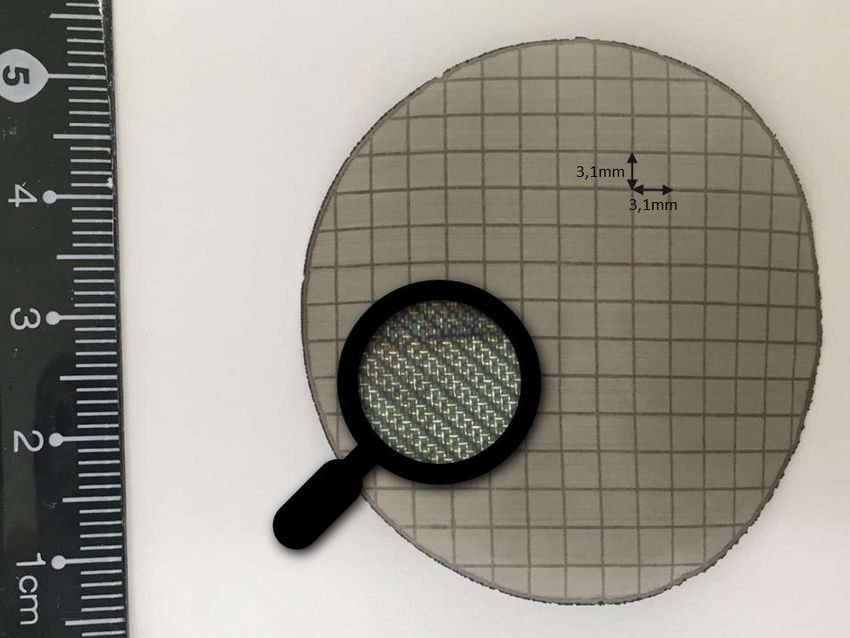
Table 1: Literature comparison of microplastic contamination in tap and bottled water. LOD = Limit of Detection; LOQ = Limit of Quantification.

 Authors                        Mean            Range       Sample        Size Range               Blanks                          Method                     Comments
                                (ppl)           (ppl)        size                                 Mean (ppl)
 Tap Water
 Kosuth, Mason and                5,45           0 - 61     159 bottles      > 100µm                   0,33              Rose Bengal Tagging, dissection         Tap water
 Wattenberg                                                   (457 –                                                             microscope
 (2018)/ORB Media                                            603 mL)

 Pivokonsky et al. (2018)                       338±76 -     1 L (54 L        > 1µm          < 5% of the microplastics   Wet Peroxide Oxidation; SEM;       Treated water from
                                                 628±28        total)     95% of particles    detected in the samples               FTIR;                    treatment plants
                                                                             < 10µm                                                Raman;
                                                                                                                           Elemental micro analysis

 Mintenig et al. (2019)                         0 – 0,007     1200 –          > 20µm              0,67 particles               FTIR spectroscopy           Treated drinking water
                                                              2500 L                                0,3 fibres

 Uhl, Eftekhardadkhah        < LOD (0,9) or                 72 bottles     > 60µm were                  0,5                    FTIR spectroscopy           Water before and after
 and Svendsen                  100µm: 0,312          10-     3 samples;     10 – 100 µm                 0,26                  Dissection Microscope         Tap water from private
 (2018)/DCE                  (LOD=0,58)          100 µm:     17 sites       > 100 µm                                          FTIR spectroscopy            households, workplaces
                                                  0 – 0,8     (50 L)                                                                                          and institutions
                                                (LOD=0,3)

 Bottled Water
 Orb Media                  6,5-100µm: 315                  259 bottles      >6,5 µm         6,5-100µm: 23,5 particles     Nile red Tagging (>6µm),
 /Mason, Welch and          > 100µm: 10,4                   (500 mL –                         > 100µm: 4,15 particles    FTIR spectroscopy (>100µm)
 Neratko (2018)                                                2 L)

 Oßmann et al. (2018)       PET bottles: 2649               32 bottles       > 0,4µm;                  384                Micro-Raman spectroscopy
                                 ± 2857                     (250 mL)      90% of particles
                               glass: 6292                                    < 5µm
                                ± 10521

 ReSource International ehf.                                                                                                                                                        5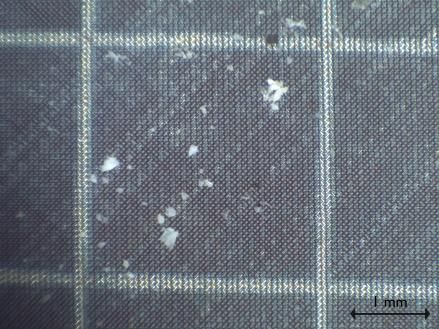
3 Method
Microplastic quantification in the laboratory is a fast-developing area of study, with several
crucial method papers published in the last year alone. The method here was developed to
balance comparability with international studies (particularly one funded by ORB Media,
which led to the commissioning of this report (Kosuth et al., 2017)), with precision, accuracy
and generalisability (i.e. volume and breadth of sampling). Most studies attempt to prioritise
only one of these three factors, giving results that are either very precise but small-scale and
thus unrepresentative, or with such small samples or serious methodological flaws that they
do not adequately represent reality. In addition, blanks were used to measure environmental
contamination. The method developed here detects microplastics larger than 27µm in at least
one dimension and the results are given in numbers of particles and fibres per volume drinking
water.
3.1 Sampling
In all cases, water was sampled using filters on site and the filters themselves were transported
and analysed afterwards in the lab.
Equipment
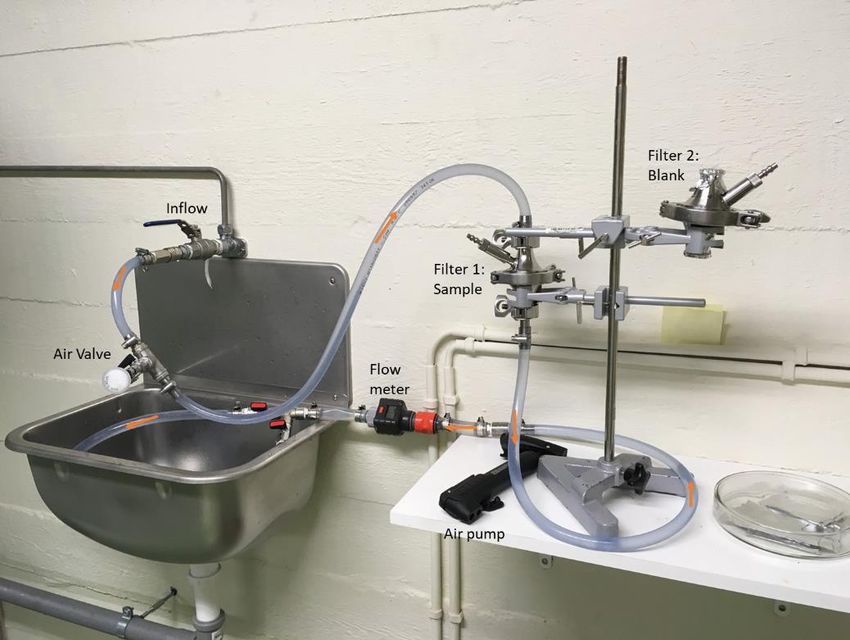
The sampling equipment and set-up can be seen in Figure 1 to Figure 4.
Figure 1: Exploded view of a filter holder unit. Upstream support screen was not required for the study.
(Meissner Filtration Products Inc.)
The total set up (see Figure 3) consists of two filter holders. One was connected with PVC hoses1
(Tricoflex Crystal, France) to the system and the other is set aside in a stand. The inlet was
connected to the drinking water system and has a valve to turn the water on and off, as well as
throttle the flow rate. Before the sample filter was a t-valve with air filter attached. The air valve
was used to purge the hoses of water after sampling using a hand pump filtered by a PTFE
1The food-grade PVC hose could (in theory) shed particles that would not display in the blank. However,
Mintenig et al. (2019) do not report finding particles of PVC hose material in FTIR analysis of their
blanks despite its use in similar sample sizes, so this was not considered a high risk.
ReSource International ehf. 6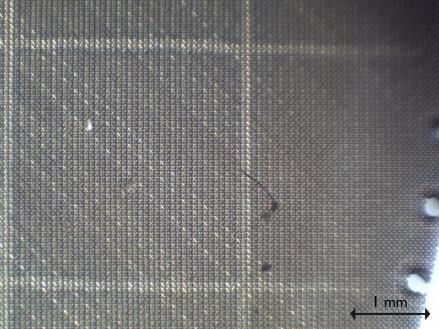
membrane with 0,45µm pore diameter. A flow meter was placed after the sample filter
(Gardena, Germany) and the filtered water was discharged.
The samples were taken on laser-engraved stainless-steel filter meshes (Figure 2; custom-
made by Inoxia Ltd., Great Britain). The wire mesh has a nominal aperture of 27µm and an
open area of 28%. The filters are 47mm in diameter, ca. 17,35cm2 and the grid is
3,1mm * 3,1mm, thus approximately 180 marked squares per filter.

        Figure 2: Picture of a 47mm stainless steel filter with a close-up of the wire mesh (RSI, 2018)

The pore size of 27µm was chosen to meet the practical limits of possible detection with optical
microscopy (Erni-Cassola et al., 2017). Uncertainties are known to rise considerably with the
optical detection of particles below 100µm in size. However, with the aid of staining the
polymeric particles (see analysis method) it was possible to lower the detection limit below
100µm.

 ReSource International ehf.                                                                              7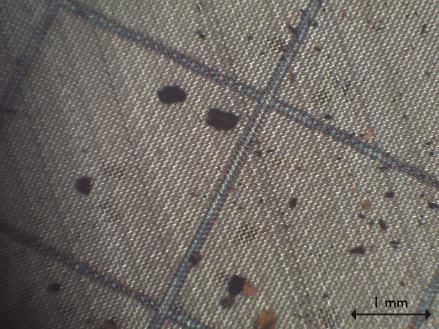
Figure 3: Sampling set-up (RSI, 2019)

A custom-built wood/glass glove box (Figure 4) and glass petri dishes were used to receive the
samples and store sample filters before usage, to prevent environmental contamination from
plastic particles in the atmosphere. Filters and glass dishes were incinerated at 450°C for
4 hours in a muffle furnace in order to remove all contamination prior to sampling; filters were
incinerated in petri dishes wrapped in aluminium foil and these were only opened during
sampling.

                                  Figure 4: Glove box (RSI, 2019)

 ReSource International ehf.                                                                 8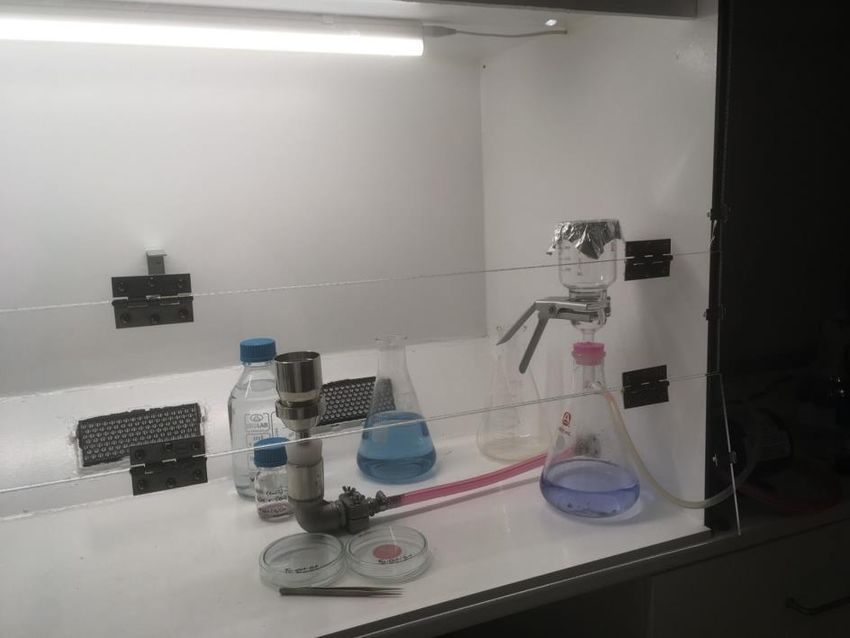
Sampling procedure
The samples were taken as triplicates (with each replicate having its own blank) to allow
calculation of random error. Sampling volume was set at 200 litres in order to maximise the
size of the sample within a reasonable timeframe (10-40 minutes) to allow for replication. No
filter clogged during this study, and sampling volume could therefore be increased with a
corresponding increase in sampling time. For the most part, pumps and boreholes were
activated during sampling periods.
The sampling equipment is shown in Figure 3. The equipment was plugged to a side stream
valve of the drinking water system, except for surface water samples which were sampled using
a stainless steel submersible pump with metal outlet piping. First the hoses were flushed with
200 L of the sampling water without filter holders, in order to remove impurities from the pipe,
such as rust and sediment. Both filter holders were then inserted in the system and flushed
with 200 L to clean them of any residual contamination. After flushing with a total of 400 L,
both filter holders were taken into the glove box to insert the stainless-steel filter meshes. The
open ends of the hoses and of the filter holders were covered with aluminium foil. The sample
filter was then clamped into the system again and the blank filter is set aside in its holder. To
take a sample, 200 L of water was passed through the filter. Both filters were then unclamped,
open ends covered with aluminium foil and the filter meshes placed from the holders into petri
dishes inside the glove box. The dishes were then sealed with Parafilm, labelled and stored at
4 °C prior to processing.
The volume and the approximate flow rate was noted for each sample. The flow rate was
between 6l/min and 20l/min; this was set as a maximum to avoid as much as possible water
pressure forcing material through the filters.
No water was run through the blank filter meshes, as initial testing revealed that they collected
high numbers of particles (sediment and plastics). This was likely from material near 27μm
being inadvertently pushed through the first filter rather than from environmental
contamination. Including this would have meant blanks were no longer just an indication of
actual contamination but could rather cause false negative results for the samples through
overestimation. However, they were still moistened by the water remaining in the blank filter
holder after its initial flushing; this is important as humidity greatly affects plastic adhesion to
surfaces. Additionally, whenever the sample filter holder was unclamped and briefly exposed
to the surrounding air before covered with tinfoil pieces, the process was mimicked for the
blank filter holder where the tinfoil on the open ends was exchanged in a similar manner.
Forensic methods in sampling
To reduce or eliminate contamination of sampling the following actions in Table 2 were
introduced. By following a strict forensic protocol, (Woodall et al., 2015) showed that the fibre
contamination can be reduced by 90%. This applies to the contamination risk during sampling
as well as to the contamination risk while processing the samples (cf. Table 3).
Table 2: Actions to lower the contamination risk during sampling

 Overall                   Procedual blanks alongside the sampling and analysing
 Before Sampling           Incinerating filters and petri dishes before use (450 °C, 4 h)
                           Rinsing the equipment prior to sampling with source water
 Equipment                 Using non-plastic filter holders
                           Sealed Transport of filters to the lab

 ReSource International ehf.                                                                     9
Use of a custom-built non-plastic glovebox for adding and removing filters
to petri dishes
Covering open hoses and filter holders with aluminium foil
Sampling Cotton clothing and non-shedding Tyvek suits
Environment
Separate Tyvek suit for laboratory and sampling
As few people as possible permitted in the sampling area
All doors kept shut where possible
3.2 Analysis
A fluorescence microscopy method developed in 2017 by (Mason, Welch and Neratko, 2018)
and (Maes et al., 2017) using Nile red as a marker dye, was the basis of this method. Nile red
only binds to non-polar compounds (e.g. lipids, plastics) and fluoresces red, pink or orange in
the presence of blue light when viewed through a high-pass filter to exclude blue incident light.
Most polymers are stained at room temperature and pressure, however the staining process is
dependent on the surfaces, porosity, plasticisers, elastomers, pigments and other factors
(Mayes, 2018). This process is fast and much cheaper than infrared or chromatographic
spectrographic processing, allowing a large number of samples, which is critical given the
natural variability in concentrations. It also returns the number of microplastic particles rather
than the mass. This is the most common reporting standard currently.
Analysis was conducted in the RSI lab dedicated to the microplastics project. Lab personnel
wore non-shedding Tyvek-suits when processing the samples, which were not removed from
the RSI premises for e.g. sampling. The samples were processed in a closed, clean environment
– a custom-built overpressure box with filtered (HEPA-filter) air inflow from a high-powered
blower motor (Figure 8). The workspace was regularly wiped down with cellulose cloths and
then swept with a lint roller.
The analysis scheme can be seen in Figure 5. The process in the laboratory consisted of the
initial counting; staining and digestion; rinsing and transfer; and fluorescence counting. It was
applied to all the sample filters and also to all blank filters to record and monitor the
background contamination.
Initial Staining & Rinse & Fluorescence
Counting Digestion Transfer Counting
•Microscope •Nile red •Acetone •Microscope
•White Light •NaOH •Acetic Acid •Blue light
•Water •Orange filter
Figure 5: Analysis process scheme (RSI, 2019)
ReSource International ehf. 10Pre-Counting
All particles on the filters were counted and sub-divided into fibres, light-coloured particles
and dark-coloured particles (Figure 6) prior to staining. This indicated whether there was a
correlation between particle number and plastic frequency. Particles were viewed under a light
microscope (AmScope 20X & 40X Trinocular Stereo Microscope SW-3T24, AmScope) with
20 x magnification.
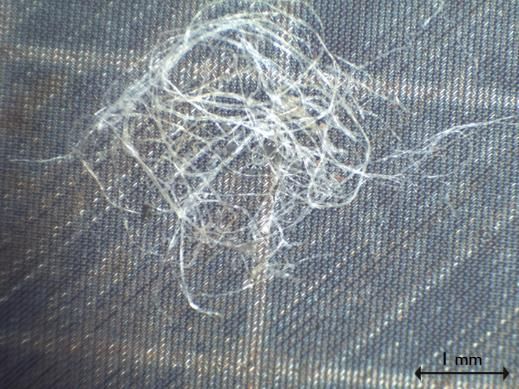
Figure 6: Example microscope pictures; left: fibre; middle: light particles; right: dark particles (RSI, 2019)
Due to the uneven background of the stainless-steel filters, it cannot be guaranteed that all
transparent particles and fibres were detected during white-light counting. The different
colours of the stainless-steel filters themselves result from incinerating the filters and the
steel’s tempering colours. The water from some sample points, for example the point shown in
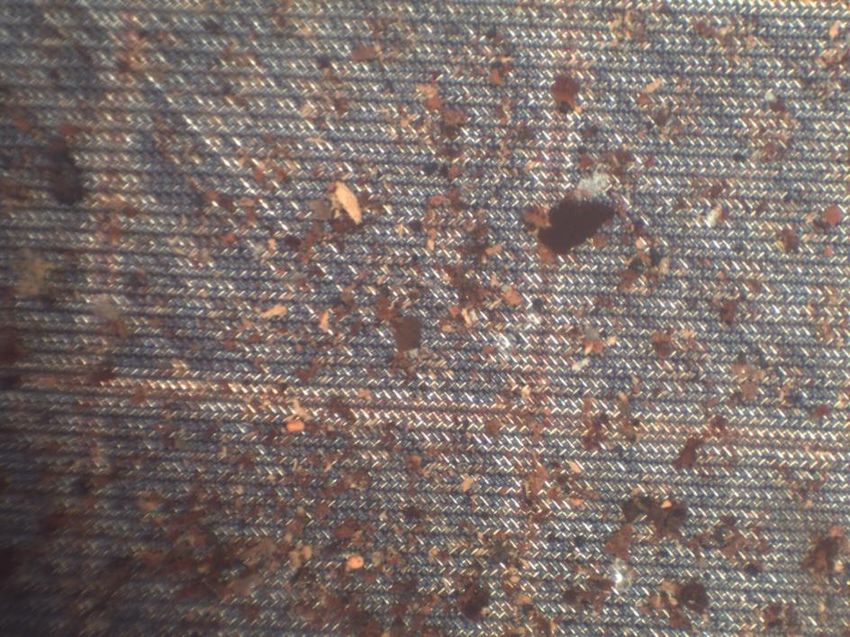
Figure 7, had many mineral particles in it, making it impossible to count.
1mm
Figure 7: Microscope picture of a filter with too many particles to count (RSI, 2019)
Staining & Digestion
100 µl of Nile red solution (1 mg/ml in acetone) was used to stain potential polymers as per
previous studies. However, it was found that this did not satisfactorily stain polyester, a major
source of fibres in the environment. To stain polyester, samples were processed at pressure
(1 bar) and temperature (120°C) for 20 minutes in an autoclave after staining. This
ReSource International ehf. 11unfortunately had the effect of also permanently staining wool fibres (a natural polymer); in
order to digest these, sodium hydroxide (NaOH) was added (10ml; 1mol/L) to petri dishes
containing sample filters and Nile red prior to autoclaving. It was observed in pilot work that
this had no effect on all the most common plastic polymers. Nile red also has no effect on black
or extremely dark pigmented particles, as the dye content of these absorbs the fluorescent light
wavelengths. However, prior laboratory work determined that the method should be sufficient
to exclude wool, cotton and hemp. Nile red may also stain mineralised chitin found in insect
shells (Maes et al., 2017) but this is known in the literature to be digested in NaOH (Einbu et
al., 2004) of a similar molarity.
All laboratory glass ware was incinerated, and all chemicals were filtered before use (Table 3).
Rinse & Transfer
Samples were poured out of the petri dishes after heat treatment and rinsed onto new filters.
The original filter was rinsed with filtered acetone onto the new filter. The new filter was then
set to be soaked in filtered 14% acetic acid for one minute. The acetone and acetic acid de-
stained organic particles (e.g. cotton and hemp fibres) and also neutralised and dissolved
residual NaOH crystals. New filters were stored in petri dishes until analysis and the equipment
was rinsed and cleaned with filtered water.
Figure 8: Filtering equipment inside the blower box, RSI lab (RSI, 2019)
Fluorescence Counting
The new filters and the original filters were examined under a blue light source (Epistar, beam
angle 15°, 460 – 470 nm) through a microscope masked with a high-pass filter (Filter G350
Dark Amber by Rosco Laboratories Inc). Observations were repeated by an independent lab
tech and a mean was counted unless the deviation on any observation or the total was greater
than 0,1ppl. In this case, a third independent lab tech recounted the sample and a mean of the
two most similar values was taken. To gain consistent results by independent personnel,
extensive training was conducted.
ReSource International ehf. 12Figure 9: Extract of technical data sheet - G350 Dark Amber filter (Rosco Laboratories Inc, USA)
Red, pink or orange glowing particles are counted and divided into fibres, small (< 51µm) and
large (> 51µm) fragments. Wire width plus the gap size is 51µm and could be clearly seen with
the microscope, see Figure 10. Only particles with at least one dimension larger than 27µm are
held back by the filters and thus analysed. It is possible that some particles larger than 27µm
were forced through the filters by mains water pressure but there was no satisfactory way to
measure this within the constraints of this study.
Figure 10: Close-up of wire mesh and its sizes (Inoxia Ltd.)
The same procedure was applied to all the sample filters as well as blank filters. The number
of particles per filter was is then divided by the number of sampled litres. Background
contamination as measured by the paired blank filter, was subtracted from the sample counts
to calculate the results. Throughout the processing microscope pictures are taken, especially
during the step of initial counting.
ReSource International ehf. 13Figure 11: Examples of fluorescent particles on the filter meshes (RSI, 2018)
Forensic processing in laboratory
Table 3 below shows actions that were done to reduce the contamination risk during the
analysis. Some of the actions apply to both the sampling and processing, as for example to wear
cotton clothing and non-shedding Tyvek suits.
Table 3: Actions to lower the contamination risk during processing
Laboratory and Cotton clothing and non-shedding Tyvek suit, and do not wear this out of
Personnel the lab area; Keep in a separate place from normal lab clothes
Clean lab and analysis area: wiping (all surfaces) well before use with wet
paper towels or cotton cloths
Storing unused equipment in boxes
All doors kept shut where possible
As few people as possible permitted in the laboratory
Avoid air currents (from open windows etc.) when doing extended work
without a lid
Lab Equipment Rinsing the non-glass equipment: funnel and filtration equipment
Incinerating the metal filters and glass ware (450 °C, 4 h)
Chemicals Filtering the water, acetone, sodium hydroxide, Nile red solution through
glass fibre filter membranes
Reagents stored in glass bottles
During the The tops of the petri dishes were not lifted more than necessary. When
Analyses tops were lifted, it was done slowly to avoid any air stream and particles to
be blown away
Work was done inside the blower box in a slightly over pressured
environment
ReSource International ehf. 144 Results 4.1 Pre-Counting Results The pre-counting results are presented in Figure 12. Counts range from 0,1 to 14,7ppl with a mean of 2,68ppl. Nine samples were not counted due to overloading, so the true sample mean is higher. The particles counted in the pre-counting are seemingly mostly mineral inorganic particles. Fragments in the colours white, black or rusty brown were commonly found and the mean value of the counted samples is 2,63 fragments per litre. The mean share of fibres is low with 0,04 fibres per litre. ReSource International ehf. 15
particles per litre

                                                                                                                   10
                                                                                                                        12
                                                                                                                             14
                                                                                                                                  16

                                                                      0
                                                                          2
                                                                              4
                                                                                              6
                                                                                                         8
                                                                B02
                                                                B16
                                                                                                                                       Pre-Counting Results

                                                                D05

ReSource International ehf.
                                                                B17
                                                                D06
                                                                B05
                                                                B26
                                                                B12
                                                                D01
                                                                B22
                                                                B04
                                                                B11
                                                                B20
                                                                D04
                                                                D08
                                                                T03
                                                                B09
                                                                B18
                                                                B15
                                                                B13
                                                                T04
                                                                D09
                                                                B19
                                                                D10
                                                                B21
                              Figure 12: Pre-Counting Results

                                                                B03
                                                                S02
                                                                D02

16
                                                                B01
                                                                D07
                                                                D03
                                                                U01
                                                                B23
                                                                T01
                                                                B06
                                                                T02
                                                                B07
                                                                B08
                                                                B10
                                                                B14
                                                                S01
                                                                                  uncounted

                                                                S03
                                                                B24
                                                                B25
4.2 Results for particles fluorescing
Table 4: Summary of the presented study (cf. Table 1)
Mean Range Sample Size Blanks Method
(ppl) (ppl) size Range Mean
(ppl)
0,22 -0.03 – 2,96 132 (200 L) > 27 µm 0,07 Nile red Tagging
Fluorescence Microscopy
The results as well as the comparison between the categories water supply, storage and
distribution system are shown below in Table 5. The results show a mean of 0,22ppl for all 44
samples within a range of -0,03 to 2,96ppl. Negative results can occur when blanks contained
more fluorescing particles than the samples.
Table 5: Sample results and statistics for each type of location.
Boreholes / Distribution Storage
Overall Other
Groundwater System Tanks
Number of
Samples
44 26 10 4 4
Mean 0,22 0,12 0,14 0,06 1,25
Median 0,09 0,08 0,10 0,03 0,81
Minimum -0,03 -0,03 0,02 0,02 0,43
Maximum 2,96 0,71 0,42 0,16 2,96
An overview of counts for all sampling points (mean of triplicates) is given in Figure 13, with
corresponding blank values subtracted. The red line at 0,09ppl (once paired blanks are
subtracted) shows the limit of detection (LOD). This level is determined by the mean
background contamination rate observed in all blanks and the distribution of outliers; here it
is set at 2,33 times the standard deviation of these, after the distribution was normalised by
using a square root transformation. The probability of false positive sample results above this
line is small (Sample results: particles fluorescing
1,00
2,96
0,90 1,11
0,80
LOQ
particles per litre (blank subtracted)
0,70
0,60
0,50
0,40
0,30
0,20
LOD
0,10
0,00
B15
B12
B02
B19
B16
B26
B25
B08
B11
B20
B10
B22
B24
B23
B14
B05
B17
B04
B01
B09
B21
B03
B06
B18
B13
B07
D06
D04
D01
D05
D08
D02
D03
D10
D09
D07
S02
S01
S03
U01
T02
T01
T04
T03
-0,10
Surface End
Boreholes/Groundwater Distribution System Tanks
Water User
Figure 13: Overview of the combined results for particles fluorescing under Nile red and blue light and therefore assumed to be plastics. The red line shows the limit of
detection and the grey line shows the limit of quantification. All values shown are difference between triplicate sample and triplicate blanks, hence some negative values are
present. (RSI, 2019)
ReSource International ehf. 18Blank results: particles fluorescing
1,00
0,90
0,80
0,70
particles per litre
0,60
0,50
0,40
0,30
0,20
0,10
0,00
B13
B11
B29
B15
B6
B5
B3
B8
B7
B1
B2
B4
B9
B38
B39
B22
B21
B14
B26
B43
B25
B42
B36
B16
B10
B33
B34
B35
B44
B18
B30
B20
B12
B17
B19
B24
B37
B28
B23
B27
B31
B41
B40
B32
Figure 14: Results for the contamination control: blank filter meshes; the red line shows the limit of detection (RSI, 2019)
ReSource International ehf. 19Fibres and fragments The samples show low numbers of fluorescing fibres (mean=0,05/l) compared to fragments (mean=0,15/l). There is no linear correlation (R2=0,20) between the fibres and fragments. Blanks Figure 14 shows the results of all 44 blank triplicate sets which have been processed parallel to the samples. The mean is 0,07ppl, the range lies between 0,01 and 0,18ppl. There is no evidence for a systematic contamination of the blanks. The fluorescent particles on the samples and their corresponding blanks do not correlate (R2=0,12). Pre- vs. Fluorescence-Counting There is no linear correlation (R2=0,09) between the pre-counting and fluorescent particle counts, indicating that filter loading (due to minerals, organics, rust etc.) is not an indicator for presence of microplastics. 5 Discussion International comparison of the results The methods and commissioning of this study were significantly informed by work funded by ORB Media which gained international attention in 2018 (Kosuth, Mason and Wattenberg, 2018; Mason, Welch and Neratko, 2018). The findings in this study are one to two orders of magnitude lower than those found in the one of these focusing on tap water, where the mean particle count was 5,45ppl (with a range of 0 – 61ppl; see Table 1). This must be considered in the context that the study used a higher size range (100µm vs 27µm) so the true difference is likely to be much higher. In addition, 98,3% of particles found in that study were fibres, compared to 12% here; fibres are disproportionately likely to be found in contamination (Woodall et al., 2015). This study has a limit of detection of 0,09ppl compared to 0,90ppl in a recent study of Norwegian drinking water (Uhl, Eftekhardadkhah and Svendsen, 2018) and 0,58ppl in a Danish study (Strand et al., 2018). This is due to cleaner sampling and analysis and greater attention paid to blank samples, meaning that “noise” (contamination) was reduced and measurement of “signal” (i.e. what is in the water) can be more precise. The Norwegian study was unable to distinguish microplastics from background noise even with a false positive rate of 33% (vs. 1% in this study); it should also be noted that only particles >60µm were analysed. The Danish study reported 0,312ppl as the average particle count for 17 tap water samples (vs. 0,22ppl here), below their LOD of 0,58ppl (at a 5% false positive rate, for particles >100µm). This meant again that for the average values, it was impossible to distinguish signal from noise. Both studies applied a combined method of stereomicroscopy and FTIR spectroscopy to count and identify the microplastic particles. Lower limits Optical counting of particles smaller than 100µm is fraught with difficulties, but Nile red can be usefully used to stain particles down to c.20µm (Erni-Cassola et al., 2017). In their study on bottled water, Mason, Welch and Neratko (2018) used automated counting with a 6µm pixel size to count particles down to 6,5µm but the uncertainties at this level are high. However, one recent study indicates that 95% of microplastics particles in tap water may be below 10µm (Pivokonsky et al., 2018); although current methods are insufficient to survey this size range at environmentally relevant scales, is important context. Close attention should be paid to method advances in the following years. ReSource International ehf. 20
Sampling and analysis method
The sampling method developed here allows for large sample volumes and triplicates in an
easy and replicable way. The sample volume of 200 litres was large enough for precise and
accurate results but could be increased in future as desired.
It is important to choose the side streams and connection points for the sampling equipment
carefully. In this study there were two samples (D07 and D09) with a high load of hemp fibres
on the filter meshes. The fibres were de-stained (see Figure 15) and thus not counted as plastic.
However, both of these filters have the highest amount of fluorescing particles present in the
distribution systems, and it may be that the high organic loading in these cases inhibited the
de-staining process in some way, giving false positives.

    Figure 15: Hemp fibres on the filter meshes: left: pre-counting; right: fluorescence counting (RSI, 2019)

The same phenomenon as for hemp fibres was observed for the samples of surface water and
their high organic loads (Figure 16); while it may be expected that plastic numbers are highest
in surface waters, inhibition of de-staining may also have played a role in the high count of
fluorescent particles in these samples. Future work should avoid cases of high organic loading
if possible and test the effects of high organic loading on the amount of reagents required for
de-staining processes. In addition, the literature is still developing regarding the exclusivity of
the Nile red dye – it may be that future work must also exclude the possibility of mineralised
chitin (Maes et al., 2017), although it is likely that this is digested using the protocol in this
study (Einbu et al., 2004). Last, it should again be noted that black-dyed particles were not
included in this study as the dye absorbs all fluorescent light.

 ReSource International ehf.                                                                                    21
Figure 16: Sample of surface water with high organic load (RSI, 2019) Type of Polymer While this method does not allow an identification of different types of synthetic polymers, it is non-destructive, thus further analyses could be done by other labs. Internationally this is done with Fourier-transform infrared spectroscopy (FT-IR) as well as Raman spectroscopy; however these are laborious and costly and deal best with small samples, making them unsuitable for wide-scale monitoring. In the case that a sampling location returns high results, they may be productively used to confirm Nile red staining and to determine to origin of the polymers. 6 Conclusion Drinking water throughout Iceland was sampled and analysed in Spring 2019. The results show a mean contamination of 0,22ppl particles fluorescing under Nile red and blue light and therefore assumed to be plastics for all 44 samples. These were detected in processing of all samples. However, the limit of detection based on background contamination was set at 0,09ppl and only 22 individual samples exceeded this limit. The here-developed method for sampling and analysing is an improvement of the state-of-the- art of peer-reviewed literature. It is suitable for a high number of samples and large sample volumes and effectively removes background noise from contamination during sampling and analysis. It is also relatively low-cost and thus efficient for large-scale monitoring programs. Future work should focus on investigating the cause of detected microplastics and determining variability over the course of months and years, such as before and after maintenance of systems. ReSource International ehf. 22
7 References
Cox, K. D. et al. (2019) ‘Human Consumption of Microplastics’, Environmental Science and
Technology. American Chemical Society, 53(12), pp. 7068–7074. doi: 10.1021/acs.est.9b01517.
ECHA (2018) Note on substance identification and the potential scope of a restriction on uses
of ‘microplastics’. Available at: https://echa.europa.eu/-/stakeholder-workshop-on-
microplastic-particles (Accessed: 20 August 2019).
ECHA (2019) Annex XV Restriction Report - Proposal for a Restriction for Intentionally
Added             Microplastics.          Helsinki.           Available            at:
https://echa.europa.eu/documents/10162/12414bc7-6bb2-17e7-c9ec-652a20fa43fc
(Accessed: 4 September 2019).
Einbu, A. et al. (2004) ‘Solution properties of chitin in alkali’, Biomacromolecules, 5(5), pp.
2048–2054. doi: 10.1021/bm049710d.
Erni-Cassola, G. et al. (2017) ‘Lost, but Found with Nile red: A Novel Method for Detecting and
Quantifying Small Microplastics (1 mm to 20 μm) in Environmental Samples’, Environmental
Science and Technology, 51(23), pp. 13641–13648. doi: 10.1021/acs.est.7b04512.
Kosuth, M. et al. (2017) Synthetic Polymer Contamination in Global Drinking Water.
Orbmedia                       Inc.                      Available                  at:
https://orbmedia.org/stories/Invisibles_final_report/multimedia (Accessed: 11 December
2018).
Kosuth, M., Mason, S. A. and Wattenberg, E. V (2018) ‘Anthropogenic contamination of tap
water, beer, and sea salt’, PLoS ONE, 13(4). doi: 10.1371/journal.pone.0194970.
Maes, T. et al. (2017) ‘A rapid-screening approach to detect and quantify microplastics based
on fluorescent tagging with Nile red’, Sci Rep. Nature Publishing Group, 7, p. 44501. doi:
10.1038/srep44501.
Mason, S. A., Welch, V. and Neratko, J. (2018) Synthetic polymer contamination in bottled
water.     Fredonia      State    University      of   New      York.   Available      at:
https://orbmedia.org/sites/default/files/FinalBottledWaterReport.pdf.
Mayes, A. G. (2018) ‘Rapid Detection of Microplastics using Fluorescent Tagging’, in WWT
Drinking      Water      Quality      Conference.      Birmingham.       Available    at:
https://event.wwtonline.co.uk/drinking/wp-content/uploads/sites/41/2018/11/Andrew-
Mayes.pdf (Accessed: 3 January 2019).
Mintenig, S. M. et al. (2019) ‘Low numbers of microplastics detected in drinking water from
ground water sources’, Science of The Total Environment, 648, pp. 631–635. doi:
10.1016/j.scitotenv.2018.08.178.
Oßmann, B. E. et al. (2018) ‘Small-sized microplastics and pigmented particles in bottled
mineral water’, Water Research, 141, pp. 307–316. doi: 10.1016/j.watres.2018.05.027.
Pivokonsky, M. et al. (2018) ‘Occurrence of microplastics in raw and treated drinking water’,
Science of The Total Environment, 643, pp. 1644–1651. doi: 10.1016/j.scitotenv.2018.08.102.
Strand, J. et al. (2018) Analysis of Microplastic Particles in Danish Drinking Water, Scientific
Report No 291. Danish Center for Environment and Energy, Aarhus University. Available at:
https://dce2.au.dk/pub/SR291.pdf (Accessed: 4 September 2019).
Uhl, W., Eftekhardadkhah, M. and Svendsen, C. (2018) Mapping microplastic in Norwegian
drinking water, Norsk Vann Report 241/2018. Hamar, Norway. Available at:
https://www.researchgate.net/publication/328412920 (Accessed: 28 August 2019).
Woodall, L. C. et al. (2015) ‘Using a forensic science approach to minimize environmental
contamination and to identify microfibres in marine sediments’, Marine Pollution Bulletin.
Elsevier Ltd, 95(1), pp. 40–46. doi: 10.1016/j.marpolbul.2015.04.044.

 ReSource International ehf.                                                                23
You can also read