Land use/land cover assessment as related to soil and irrigation water salinity over an oasis in arid environment
←
→
Page content transcription
If your browser does not render page correctly, please read the page content below
Open Geosciences 2020; 12: 220–231
Research Article
Khalid G. Biro Turk*, and Abdullah S. Aljughaiman
Land use/land cover assessment as related to
soil and irrigation water salinity over an oasis
in arid environment
https://doi.org/10.1515/geo-2020-0103 Keywords: land use and land cover (LULC) changes, soil
received July 4, 2019; accepted March 17, 2020 salinity (ECe), irrigation water salinity (ECiw), Al-Ahsa
Abstract: The land use and land cover (LULC) changes and oasis
the implications of soil and irrigation water salinity have
adverse effects on crop production and the ecosystems of
arid and semiarid regions. In this study, an attempt has
been made to analyze and monitor the LULC changes using 1 Introduction
multitemporal Landsat data for years 1986, 1998, 2007, and
2016 in Al-Ahsa Oasis, Saudi Arabia. In addition, efforts The study of land use and land cover (LULC) changes is
were made to measure the spatial distribution of soil and essential for land management, environment, and strategy
irrigation water salinity along the oasis. The supervised formulation regarding planning activities. Ecosystems are
maximum likelihood classification method was applied to facing change results of human socioeconomic activities
classify the individual images independently. Moreover, soil that occurred at local, regional, and global scales [1,2].
samples were collected at surface soil depth from the The LULC changes were assessed using remote sensing
selected LULC types, namely, date palm, croplands, and in many studies in Saudi Arabia [3–6]. Mallick et al. [2]
bare land. Also, groundwater samples were collected from analyzed the LULC transformation in the Abha region
bore wells located in agricultural farms. The spatial during 2000–2010. They found that the sparse vegetation
distribution of the soil salinity (Ece) and irrigation water and water bodies decreased from 48.5 to 39.3 km2 and 0.3 to
salinity (ECiw) was classified based on the Food and 0.1 km2, respectively, whereas the built-up area increased
Agriculture Organization guidelines. The results showed from 17.0 to 36.4 km2. Also, in the Al-Baha region, the LULC
that significant changes in LULC patterns have occurred dynamics were mapped by Mahmoud and Alazba [7] in the
during 1986–2016 in the study area. The ECe was found period 1975–2010. Their classified maps showed four main
higher in date palm compared with cropland and bare land. classes: bare soil, sparsely vegetated, forest and shrubland,
However, the spatial distribution of the ECiw over the oasis and irrigated cropland. They reported that bare soil
indicated that 94% of irrigation water ranged between increased during 1975–1995 and decline during 1995–2010
moderate and severe salinity risk. The study concludes that due to the construction of rainwater harvesting dams in the
salinity management practices need to be developed in the region. Also, significant changes were observed in irrigated
study area aiming to sustain crop yields, improve soil cropland during the entire study period.
properties, and minimize the environmental impacts of Salty soils and sand dunes dominated in most land
LULC changes on the ecosystem of Al-Ahsa Oasis. covers of Saudi Arabia. Higher soil salinity is one of the
main threats of crop production and represents a challenge
for sustainable agriculture in Saudi Arabia [8]. Soil
salinity was measured based on actual field samples in
* Corresponding author: Khalid G. Biro Turk, Water Studies Center, Al-AhsaOasis, Saudi Arabia, to investigate its extent and
King Faisal University, Al-Ahsa 31982, Saudi Arabia, relationship with vegetation growth in the oasis [9]. He
e-mail: khalidturk76@yahoo.co.uk, kturk@kfu.edu.sa, indicated that soil salinity is the driving force for vegetation
tel: +966-531536448
health decline in the oasis. Also, in Al-AhsaOasis, high soil
Abdullah S. Aljughaiman: Department of Environmental and Natural
Resources, College of Agricultural & Food Sciences, King Faisal
salinity was observed to be dominated in most parts of the
University, Al-Ahsa 31982, Saudi Arabia, oasis [10]. Moreover, soil salinity changes during 1985–2013
e-mail: aaljughaiman@kfu.edu.sa were studied by Allbed et al. [11] using remote sensing data.
Open Access. © 2020 Khalid G. Biro Turk and Abdullah S. Aljughaiman, published by De Gruyter. This work is licensed under the Creative
Commons Attribution 4.0 Public License.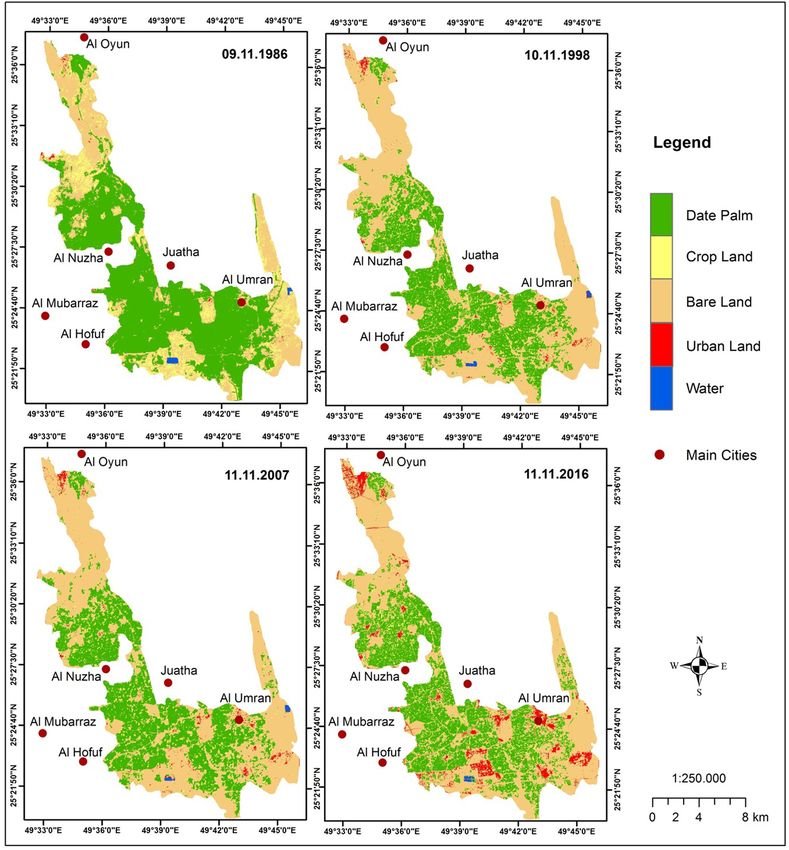
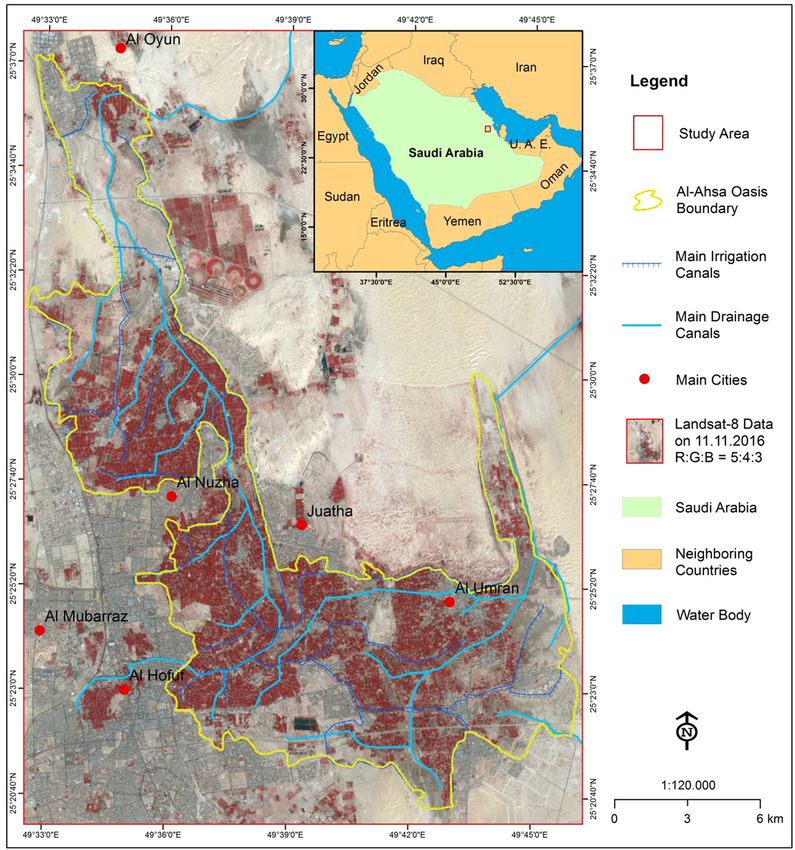
Land use/land cover assessment for soil and irrigation water salinity 221
They found that higher soil salinity increased in the period and longitude 49.52° E to 49.77° E. It covers an area of
2000–2013 compared with 1985–2000, while the vegetation 22,000 hectares (ha) approximately (Figure 1), with an
cover declined to 6.3% for the same period. average altitude of 149 m above the sea level [18]. The
Groundwater is a vital source of water in arid regions study area consists of Al-AhsaOasis, which is one of the
for domestic and irrigation purposes [12,13]. In Saudi main agricultural centers in Saudi Arabia and dominated
Arabia, the vast increase of agricultural lands during by date palm plantation [19]. The study area lies about
1990–2009 has put pressure on groundwater use [14]. 300 km from the capital Riyadh and 70 km west of the
Hence, groundwater wells rapidly depleted due to the Arabian Gulf. The climate of the area is characterized by
heavy abstraction of the reserved water [15]. Groundwater six hot, dry months in the summer and relatively six
salinity was evaluated in several studies in Saudi Arabia months cold and wet in winter. The air temperature may
using different methods and techniques. Along the Red Sea exceed 45°C during the summer, while it might reach 5°C
and Arabian Gulf coasts of Saudi Arabia, the salinity of the in winter. The rainfall occurs mainly during the winter,
groundwater was determined at different depths in the with an annual average of 50 mm [20]. The pedogenesis
pumping well and was found to be low in the top 4 m. It and characteristics of soils in the Al-Ahsa region
sharply increased to reach a ten times salinity value of the determined by the extremely hot, dry climate, which
top layer indicating groundwater intermixing with the fresh causes soil water evaporation, result in accumulation of
water and saltwater intrusion. However, the change in the the dissolved salts in upper soil layers and create a crust
salinity during pumping was erratic, but within a range of on the soil surface. Therefore, most of the cultivated
2% [16]. The salinity of irrigation water in Al-Ahsa Oasis lands in Al-Ahsa Oasis are covered with saline soils [9].
was investigated by Aldakheel [9]. He pointed out that the The dominated soils of the study area are sandy to sandy
high values of the water salinity were found in the loam soil that covers some taxonomic classes such as
southeastern and part of the southern tip of the oasis. In Gypsiorthids, Haplaquepts, Calciorthids, Torripsam-
Al-Kharj groundwater, salinity ranged between 1.1 and ments, Salorthids, and Torriorthents [11]. The primary
10.2 dS/m, and accordingly, most of the groundwater is water source of the oasis is the Neogene groundwater
unsuitable for drinking uses [17]. aquifer, and this groundwater is used mainly for
Like many regions in Saudi Arabia, Al-Ahsa Oasis has irrigation and domestic purposes [21].
experienced rapid urban developments and LULC changes.
These shifts in LULC will significantly affect the socio-
economic activities of the oasis as a primary agricultural
center in Saudi Arabia. The vast irrigated lands of Al-Ahsa 2.2 Satellite data
Oasis are affected by salinization [9]. Therefore, to mitigate
and control this problem, assessing and measuring of soil Earth observation satellite data are acquired from the
salinity are required to ensure sustainable agricultural Landsat series covering the study area during the last
production. Also, the quality of the pumped groundwater three decades. The data are retrieved from the United
used for irrigation is decreasing as a result of depleting States Geological Survey website (https://earthexplorer.
aquifers. Consequently, the salinity of the groundwater usgs.gov/). The used imagery was for the years 1986,
becomes hazardous even for a salt-tolerant crop like date 1998, 2007, and 2016 (Table 1). The data files down-
palms. Accordingly, the objectives of this study are to loaded in Tagged Image File (TIF) format and all
quantify LULC change over the 30 years, 1986–2016, and obtained images had less than 10% cloud cover. The
analyze temporal and spatial trends in Al-Ahsa Oasis. Also, satellite images were acquired in the same season to
an attempt was made to measure the spatial distribution of minimize the influence of seasonal variations on the
soil and irrigation water salinity along the oasis. results.
The Landsat files were imported from TIF into
Raster format using import tool of the ERDAS
2 Materials and methods IMAGINE 9.2 software. The same software was used to
perform a simple haze correction to give the images more
contrast. All images had the same projection system;
2.1 Study area therefore, an image-to-image registration was made
using the most recent image of the year 2016. The
The study area is located in the eastern province of Saudi recertified images resampled to a 30 × 30 m ground
Arabia and lies between the latitude 25.30° N to 25.63° N resolution.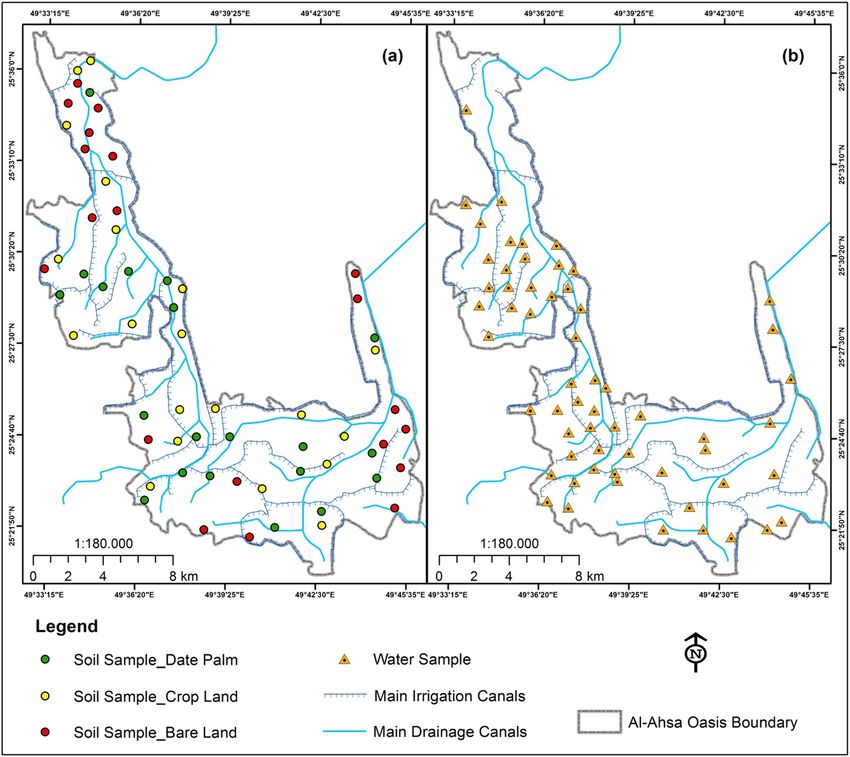
222 Khalid G. Biro Turk and Abdullah S. Aljughaiman Figure 1: Location of the study area. Due to an instrument malfunction onboard for Landsat-7 May 2003 needed further processing for gap filling. Gap in May 2003, there were some gaps in images down- filling processing was done for the image of 2007 using loaded after this date. Thus, all images acquired after the IDL 7.0 software (https://glovis.usgs.gov/). For that Table 1: Characteristics of Landsat data used in the study Satellite Acquisition date Spectral bands Ground resolution (m) Landsat-5 TM 09.11.1986 1–6 30 Landsat-5 TM 10.11.1998 1–6 30 Landsat-7 ETM+ 11.11.2007 1–6 30 Landsat-8 11.11.2016 1–9 30
Land use/land cover assessment for soil and irrigation water salinity 223
three additional images were needed: (1) the image to be accuracies, and the Kappa coefficient were used to
filled in (anchor), (2) one image acquired before May validate the LULC classification [25,26].
2003, and (3) one image acquired after the anchor. For
the gap filling of the 2007 image, the following images
were used: (1) Landsat-7 SLC-off acquired on 11
November 2007 (Table 1) as the anchor, (2) Landsat-7 2.4 Soil and water sampling
SLC acquired on 31 December 2002 as the filling scenes 1,
and (3) L7-SLC-off acquired on 13 December 2007 as the A total of 60 and 63 random samples of soil and irrigation
filling scene 2. water were collected, respectively, from Al-Ahsa Oasis
during December 2016.
Soil samples were collected from three different
LULC types, namely, date palm, cropland, and bare land
2.3 Image classification and accuracy (Table 2). A composite soil sample was collected from 20
assessment sites for each of the LULC types at a depth of 0–30 cm
(Figure 2a). Soil salinity (ECe) was determined in the
A classification scheme was developed during a field laboratory by measuring the EC from the soil saturation
survey conducted between October and November 2016 extracts based on the study by Klute [27].
to define the LULC classes in the study area (Table 2). A The groundwater samples were collected from bore wells
total of 220 training areas were selected based on image located in agricultural farms within the oasis (Figure 2b). The
interpretation keys during field investigations. A super- irrigation water salinity (Eciw) was measured in situ using a
vised maximum likelihood classification (MLC) method portable EC-meter (470 Jenway Manufacturer) [28].
was employed to classify the individual images inde- The coordinates of the soil and water samples were
pendently. Based on the study objectives, the supervised recorded using a high accuracy differential GPS instrument
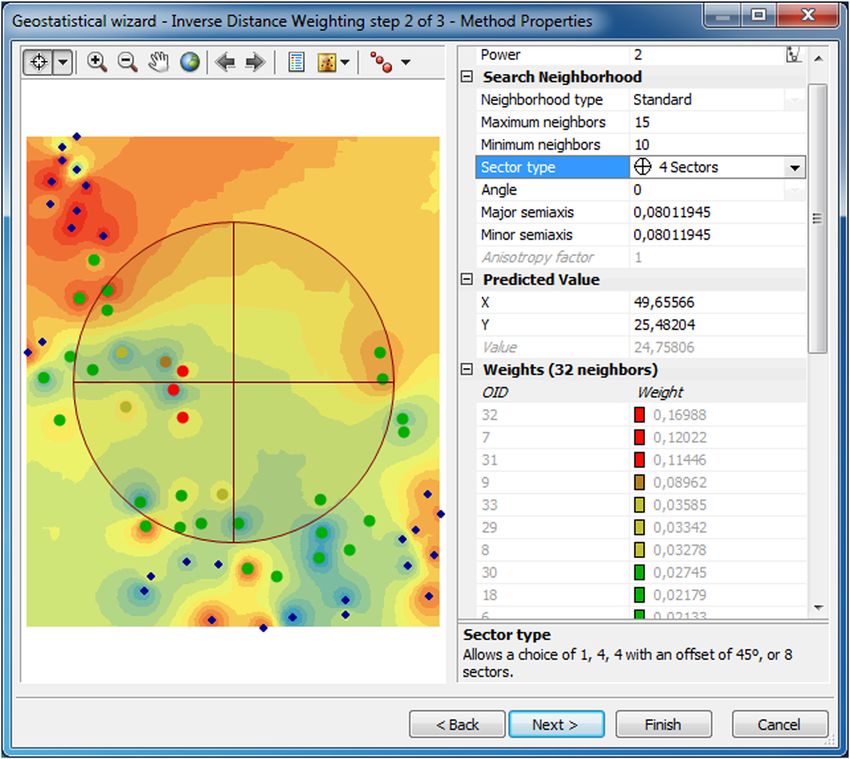
classification applied in this study does not imply a (Trimble ProXR GPS). The Inverse Distance Weighted (IDW)
comparison between different classifiers. Therefore, the tool of Geostatistical Analyst in the ArcGIS 10.2 software
MLC was adopted to be the only classification method was used to perform data interpolation for ECe and ECiw.
for this study. MLC has been widely used for image The IDW interpolation explicitly implements the assump-
classification [6,22,23]. tion that things that are close to one another are more alike
The accuracy assessment for the image of the year than those that are farther apart. To predict a value for any
2016 was made by using 82 points out of the total unmeasured location, IDW uses the measured values
training points collected during the ground truth (i.e., surrounding the prediction location. The measured values
field reference data). On-screen visual evaluation sup- closest to the prediction location have more influence on
ported by historical information obtained from the local the predicted value than those farther away. IDW assumes
inhabitant was used to measure the accuracy assessment that each measured point has a local influence that
of the years 1986, 1998, and 2007. Google Earth images diminishes with distance [29]. The method properties and
were also used as an additional validation method for weights assigned to ECe data points are shown in Figure 3.
historical images. Consequently, error matrices based on The interpolation output of the ECe was classified based on
the stratified random sampling of reference field data Food and Agriculture Organization (FAO) [30]. However,
were used to assess the classification accuracy [24]. the spatial distribution of the ECiw is classified according to
Hence, the overall accuracy, user’s and producer’s the FAO guidelines for irrigation water quality [30].
Table 2: Description of LULU classes identified in the study area
Classes Description
Date palm All date palm areas with (60–100 trees/ha)
Cropland Areas currently under crop or land being prepared for raising crops
Bare land Nonvegetated areas such as bare rocks, desert, and special desert features
Urban land Area with permanent concentration of man-made structures, people, and activities such as towns and industrial areas
Water Ponds and water surfaces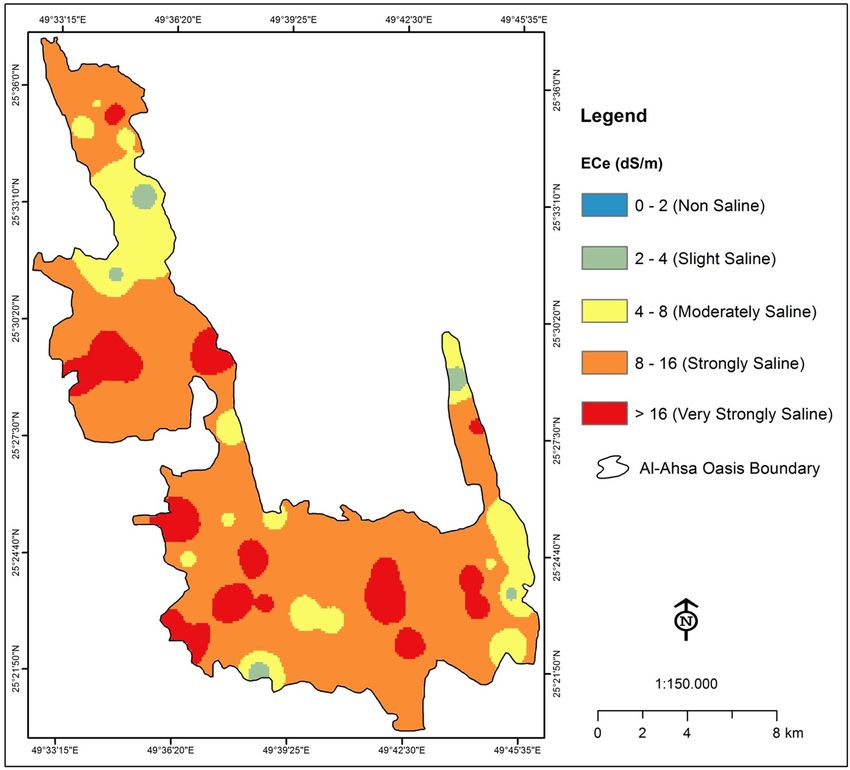
224 Khalid G. Biro Turk and Abdullah S. Aljughaiman
Figure 2: Location of sampling sites: (a) soil samples and (b) irrigation water samples.
2.5 Statistical analysis LULC types during 1986–2016. Computed percentages of
LULC classes showed that in the year 1986, date palm,
The change in LULC throughout the study period was cropland, and bare land had occupied 56%, 10.5%, and
quantified using the descriptive statistics of the Microsoft 32.5% of the study area, respectively, whereas urban land
Excel 2010 software [31]. The second-order polynomial occupied only 0.7% of the study area (Figure 5). However,
regression was used to describe the trends of LULC the significant spatial expansion in bare land and the
changes over time. Using the Statistica (StatSoft) software large decrease in date palm were observed in the LULC
package [32], the Whisker Plot Box of the factor analysis map of the year 1998. Consequently, the area of bare land
was used to measure the ECe for different LULC types. increased to 53%, whereas the date palm and cropland
area was reduced to 39.5% and 6.1%, respectively. A
slight increase of 1.2% in the spatial extent of urban land
was also observed. Spatial analysis of the year 2007 LULC
3 Results and discussion map revealed that there is a slight increment of urban
land, which occupied 1.5% of the study area, whereas
cultivated area decreased to 5% and no change was
3.1 LULC mapping and accuracy assessment
observed for date palm and bare land. Nevertheless, a
considerable amount of spatial expansion of the urban
Based on the produced LULC maps (Figure 4), it was land and a slight decrease in the date palm were observed
found that date palm and bare land were the dominant in the year 2016 LULC map. The area of urban land and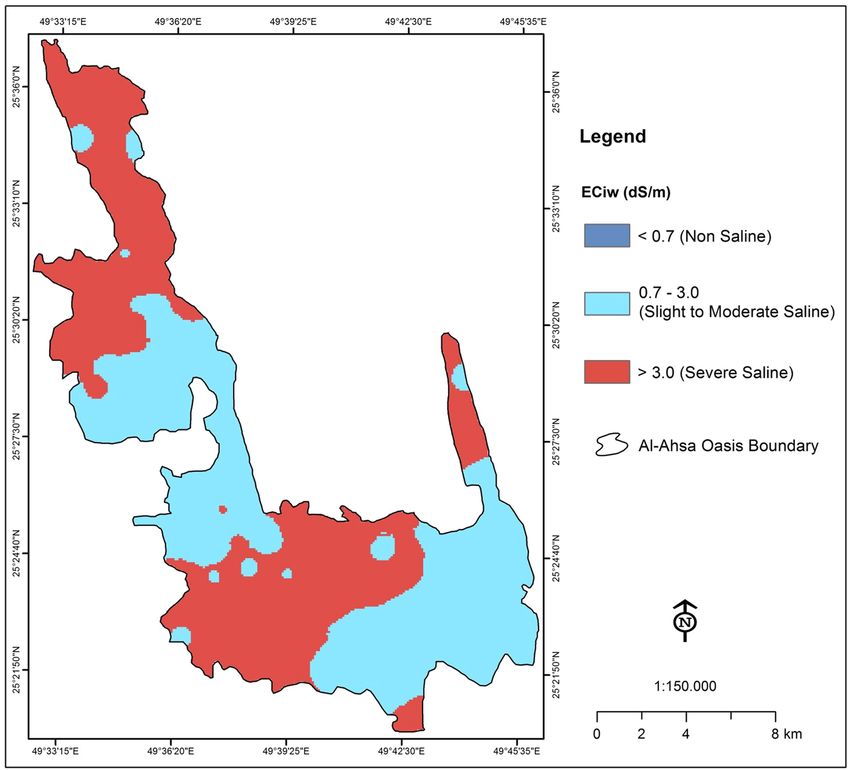
Land use/land cover assessment for soil and irrigation water salinity 225
Figure 3: The weight window contains the list of weights assigned to each data point of the soil samples that are used to generate a
predicted value at the location marked by the crosshair.
cropland increased to 4.1% and 6.4%, respectively, whereas due to urbanization and development in the study area. As
the date palm decreased to 36.8%. a result, quite a number of date palm farms shifted to
The general patterns of the LULC maps identified for residential areas. Also, the cost of constructing and
the study area showed a variable rate of change among operating new wells at the date palm farms increased
different LULC classes. The significant decrease in date due to the high price of electricity and labor wigs.
palm areas indicated the expansion of the bare land due to The decline of the cropland shown during the first
desertification. Aldakheel and Al-Hussaini [33] reported and second parts of the study period was mainly
that desertification widely documented as one of the major attributed to the aridity conditions and the high cost of
drivers of LULC changes in Al-Ahsa Oasis over the period agricultural inputs due to the increase of salinity in the
1987–1998. Also, in the eastern province of Saudi Arabia, soil [9]. However, the increase of cropland during the end
the size of the dune fields was observed to be doubled in 15 of the study period is most likely due to the expansion of
months [34]. Although date palm trees are the most rice and vegetable farms in the southern part of the study
dominated vegetation cover in the study area, the rate of its area. These farms occurred as a result of urban
change indicated more capability of declining during the agricultural activities, which are used for providing the
coming years. Based on the FAOSTAT data [35], the date local markets in the city centers with some products.
palm areas in Saudi Arabia were reduced from 1,56,901 ha The expansion trend of the urban land was at the
in 2013 to 1,08,133 ha in 2017, with an annual decline rate expense of date palm. Urban lands were increased
of 14%. The profits of date palm production become low significantly during the study period as a result of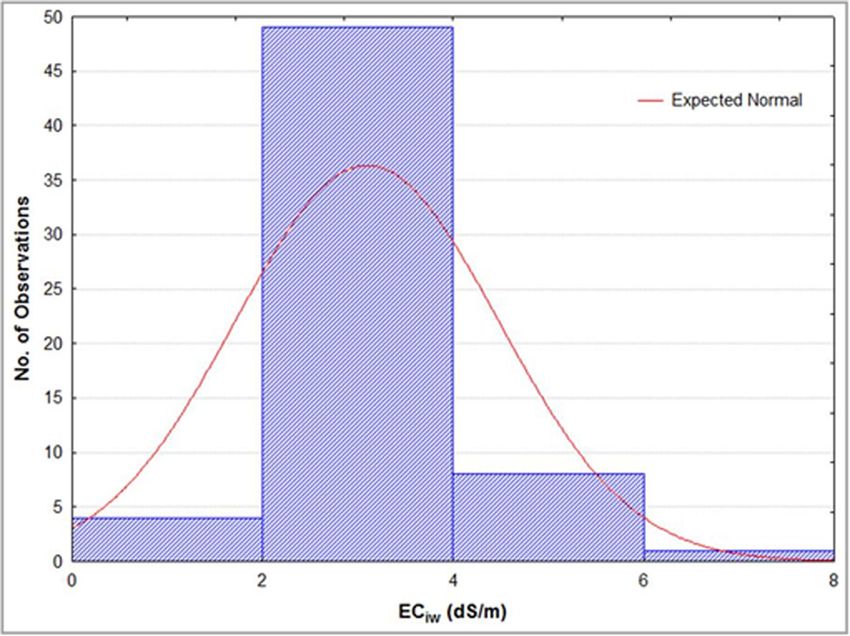
226 Khalid G. Biro Turk and Abdullah S. Aljughaiman Figure 4: LULC maps of the study area during 1986–2016. population increase and the extensive development of the distribution of foodstuffs from crop and animal production study area. In Dammam city located in the same region of within and around urban areas [37]. the study area, built-up lands found to be increased by 29% During the first stage of the study period, bare lands between 1990 and 2014 [36]. The rapid expansion of the showed a significant increase in taking parts of the date urban lands was mainly due to the socioeconomic palm and cropland areas. However, during the second processes, which were closely associated with the agricul- and last stages of the study period, bare lands keep no tural activities in the study area. Urban agriculture can be change due to the difficulty associated with the utiliza- broadly defined as the production, processing, and tion of lands resulted from desertification.
Land use/land cover assessment for soil and irrigation water salinity 227
Date Palm Crop Land Bare Land Urban Land
2016 36.8 6.4 52.5 4.1
2007 39.5 5.0 53.0 1.5
1998 39.5 6.1 53.0 1.2
1986 56.0 10.5 32.5 0.7
0% 20% 40% 60% 80% 100%
Figure 5: Changes in LULC areas (%) for the period 1986–2016.
The overall LULC classification accuracy levels for four classification, it can be seen that the ECe values ranged from
dates of Landsat satellite images ranged from 84% to 91%, nonsaline (0–2 dS/m) to very strong saline (>16 dS/m).
with Kappa indices of agreement ranging from 78% to 87% However, the strong saline (8–16 dS/m) is the most
(Table 3), which is satisfactory for the study area based on dominated class along the oasis. ECe was higher in date
the validation measures applied to the classified LULC maps. palm with an average value of 18.97 dS/m compared to
The achieved classification accuracy is satisfactory for cropland and bare land that show mean values of 10.25 and
the study area considering the multitemporal analysis of 5.20 dS/m, respectively (Figure 7).
Landsat data and the visual interpretation adapted to image Soil salinity is likely to be higher in cultivated lands
classification. (i.e., date palm and croplands); this might be due to the
Also, the data in Table 3 showed that the producer’s accumulation of salts as a result of saline water flow
and user’s accuracies for crop and urban lands were from the water table and also due to using saline
lower compared with the other LULC types. This is irrigation water. Over-irrigation in the cultivated areas
mainly due to the misclassification of some cropland can result in the rising of the water table and hence
pixels that have been classified as date palm, while the accumulation of salinization at the root zone. Therefore,
urban land ones were classified as bare lands. salinization problems can be more severe when the
salinity of groundwater is high, as is usually the case in
arid regions [30]. High level of salinity might restrict the
3.2 Soil salinity measurements growth of some crops in the area. However, data palm
considered as a salt tolerance crop [38], and this
The spatial distribution of soil salinity along Al-Ahsa indicates its domination within the study area compared
Oasis is shown in Figure 6. Based on the FAO soil salinity with the other field crops.
Table 3: Accuracy assessment (%) of LULC maps
LULC classes 1986 1998 2007 2016
Producer’s User’s Producer’s User’s Producer’s User’s Producer’s User’s
Date Palm 81 82 88 86 85 87 92 88
Cropland 70 72 72 78 77 78 82 84
Bare Land 93 94 95 92 98 97 94 97
Urban Land 74 71 71 76 83 76 84 79
Water 86 75 83 88 88 100 100 100
Overall accuracy 84 86 89 91
Kappa statistic 78 81 85 87228 Khalid G. Biro Turk and Abdullah S. Aljughaiman Figure 6: Spatial distribution of soil salinity (ECe) over Al-Ahsa Oasis. Moderate soil salinity level is found to be associated with the bare land since most of the bare lands are covered by sandy soils and sand dunes, which are in dynamics due to desertification. Nevertheless, some parts of the bare lands showed extreme salinity level and these types of lands covered by inland saline flat areas are known locally as “Sabkha”. Rain and the rising groundwater can flood the Sabkha lands during the winter season and then turns dry during the summertime, these lands are converted to salt soils that are covered with thin crust surfaces of salts [10]. 3.3 Irrigation water salinity measurements The classified range of water salinity across Al-Ahsa Oasis is displayed in Figure 8. The ECiw have values of nonsaline Figure 7: Soil salinity (ECe) for the different LULC types in (
Land use/land cover assessment for soil and irrigation water salinity 229
Figure 8: Spatial distribution of irrigation water salinity (ECiw) over Al-Ahsa Oasis.
severe saline (>3.0 dS/m) according to the FAO guidelines
for irrigation water. The spatial distribution of the ECiw over
the oasis indicated that 94% of irrigation water ranged
between moderate and severe saline, while only 6% was
under none to moderate saline conditions (Figure 9).
Ayers and Westcot [39] reported that the critical ECiw
level that causes severe salinity problems for most
vegetable and field crops is 3 dS/m. Therefore, most of the
date palm and cropland areas are facing a water salinity
problem, which might lead to a decrease in the quality and
quantity of agricultural productions [40]. However, some
farmers use desalination plants to overcome the irrigation
water salinity [41]; nevertheless, this process is of high cost
and not sustainable for long-run crop production.
Moreover, Minhas [42] indicated that crop type, soil
characteristics, irrigation methods, cultural practices, and
climatic conditions should be studied when the saline Figure 9: Irrigation water salinity (ECiw) frequency across Al-Ahsa
groundwater is considered for irrigation purposes. The Oasis.230 Khalid G. Biro Turk and Abdullah S. Aljughaiman
spatial variability in irrigation water salinity levels was improving the water use efficiency at the farm scale along
observed in Al-Ahsa Oasis, which subjected the irrigation with applying the suitable rate of salinity leaching will
groundwater in the oasis to a process of quality degrada- maintain crop production and minimize the salinity
tion [43]. Along with different aquifers, in Saudi Arabia, hazard within the crop root zone. However, leaching
the water salinity was found in range 1.56 and 8.24 dS/m, requirement for date palm and crops cultivated in Al-Ahsa
and accordingly, a leaching requirement of 15% to 20% Oasis needs to be evaluated. Consequentially, guidelines
above crop water requirements is suggested for safe use of of salinity management practices need to be developed in
this water [44]. However, Zaidi et al. [45] argued that the the oasis aiming to sustain crop yields, improve soil
large variation in groundwater salinity (i.e., 1.2–3.4 dS/m) physical properties, and minimize adverse environmental
in the northwestern part of Saudi Arabia is probably due to impacts on the different land-use systems.
the geochemical evolution of water in an evaporation-
dominant environment. Acknowledgments: The authors acknowledge the
Deanship of Scientific Research at King Faisal University
for the financial support under the annual research
project (Grant No. 186002).
4 Conclusions
The LULC change was investigated in this study based on
Landsat data for the years 1986, 1998, 2007, and 2016. References
LULC change trends varied significantly during the above
mentioned periods. The results indicated that a contin- [1] Giri CP. Remote sensing of land use and land Cover: Principles
uous decrease in date palm area with a significant and applications. CRC Press; 2012.
increase of the cropland was observed in the period [2] Mallick J, Al-Wadi H, Rahman A, Ahmed M. Landscape dynamic
1986–2016. Soil and irrigation water salinity are major characteristics using satellite data for a mountainous
issues of concern when related to LULC change under the watershed of Abha, Kingdom of Saudi Arabia. Environ Earth
Sci. 2014;72:4973–84.
arid ecosystem of the study area. The most dominated
[3] Weiss E, Marsh SE, Pfirman ES. Application of NOAA-AVHRR
soil saline class Al-Ahsa Oasis was the strong saline NDVI time-series data to assess changes in Saudi Arabia’s
(8–16 dS/m). However, soil salinity was found to be rangelands. Int J Remote Sens. 2001;22(6):1005–27. doi:
higher in date palm areas compared to crop and bare 10.1080/014311601300074540.
lands. Also, 94% of the groundwater in the oasis ranged [4] Alahmadi M, Atkinson P, Martin D. Fine spatial resolution
residential land-use data for small-area population mapping:
between moderate and severe saline hazards.
a case study in Riyadh, Saudi Arabia. Int J Remote Sens.
Mapping and analysis of LULC dynamics in Al-Ahsa 2015;36(17):4315–31. doi: 10.1080/01431161.2015.1079666.
Oasis provide a basis for strategic planning, management, [5] Alqurashi AF, Kumar L. Spatiotemporal patterns of urban
and conservation decision-making because changes in change and associated environmental impacts in five Saudi
the LULC will have substantial social and environmental Arabian cities: a case study using remote sensing data. Habit
implications within the ecosystem of the study area. Int. 2016;58:75–88.
[6] Abdallah S, Abd elmohemen M, Hemdan S, Ibrahem K.
However, urbanization and rapid development of infra-
Assessment of land use/land cover changes induced by Jizan
structure might continue growth, which might induce Dam, Saudi Arabia, and their effect on soil organic carbon.
human pressure on energy and water resources. Arabian J Geosci. 2019;12:350.
Therefore, this study recommends that the local authority [7] Mahmoud SH, Alazba AA. Land cover change dynamics
in the study area should develop a master plan that mapping and predictions using EO data and a GIS-cellular
automata model: the case of Al-Baha region, Kingdom of
considers population growth and future development
Saudi Arabia. Arabian J Geosci. 2016;9:419.
based on the current land-use system of Al-Ahsa Oasis. [8] Elhag M. Evaluation of different soil salinity mapping using
Also, strategies for conserving the date palm lands should remote sensing techniques in arid ecosystems, Saudi Arabia.
be adopted and implemented by the local authority in the J Sens. 2016;7596175. doi: 10.1155/2016/7596175.
study area to ensure sustainable production of date palm [9] Al-Dakheel YY. Assessing NDVI spatial pattern as related to
irrigation and soil salinity management in Al-Ahsa Oasis,
as cultural heritage and a cash crop for the area.
Saudi Arabia. J Indian Soc Remote Sens. 2011;39(2):171–80.
The risk of soil and irrigation water salinity is
[10] Allbed A, Kumar AL, Aldakheel YY. Assessing soil salinity using
increasing among the date palm and cropland areas, soil salinity and vegetation indices derived from IKONOS high-
and hence, salinity management and amendment are spatial resolution imageries: Applications in a date palm
essential to be adopted in the study area. Moreover, dominated region. Geoderma. 2014;230–231:1–8.Land use/land cover assessment for soil and irrigation water salinity 231
[11] Allbed A, Kumar AL, Sinha P. Soil salinity and vegetation cover [29] ArcGIS Help Library, 2013, http://desktop.arcgis.com/en/
change detection from multi-temporal remotely sensed arcmap/latest/get-started/main/get-started-with-
imagery in Al Hassa Oasis in Saudi Arabia. Geocarto Int. arcmap.htm.
2018;33(8):830–46. doi: 10.1080/10106049.2017.1303090. [30] FAO. Salt-Affected Soils and their Management. Rome, Italy:
[12] Sener E, Davra A. Assessment of groundwater vulnerability based FAO Soils Bulletin 39, Food and Agriculture Organization of
on a modified DRASTIC model, GIS and an analytic hierarchy the United Nations; 1988.
process (AHP) method: the case of Egirdir Lake basin (Isparta, [31] Baskauf SJ. Introduction to Biological Sciences Lab (BSCI
Turkey). Hydrogeol J. 2013;21:701–14. doi: 10.1007/s10040-012- 1510L) Excel Reference and Statistics Manual. Nashville, TN:
0947-y. Vanderbilt University; 2016, http://researchguides.library.
[13] Uyan M, Cay T. Spatial analyses of groundwater level vanderbilt.edu/bsci1510L.
differences using geostatistical modeling. Environ Ecol Stat. [32] Hill T, Lewicki P. STATISTICS: Methods and Applications.
2013;20:633–46. doi: 10.1007/s10651-013-0238-3. Tulsa, OK: StatSoft; 2007.
[14] Chowdhury S, Al-Zahrani M. Characterizing water resources and [33] Aldakheel Y, Al-Hussaini A, The use of multi-temporal remote
trends of sector wise water consumptions in Saudi Arabia. J King sensing imagery to detect land cover/use changes in Al-
Saud Univ Eng Sci. 2015;27:68–82. doi: 10.1016/ Hassa, Saudi Arabia. 2nd Conference on Lidar Remote Sensing
j.jksues.2013.02.002. for Industry and Environment Monitoring Location: San Diego,
[15] Elhag M, Bahrawi JA. Soil salinity mapping and hydrological CA, Date: JUL 30-31, 2001. Proceeding of the Society of Photo-
drought indices assessment in arid environments based on Optical Instrumentation Engineers (SPIE), 2002, Volume,
remote sensing techniques. Geosci Instrum Method Data Syst. 4484: 244-252, Article Number: UNSP 4484-49.
2017;6:149–58. doi: 10.5194/gi-6-149-2017. [34] Barth H. Desertification in the Eastern Province of Saudi
[16] Sabtana AA, Shehata WM. Hydrogeology of Al-Lith Sabkha, Arabia. J Arid Environ. 1999;43:399–410.
Saudi Arabia. J Asian Earth Sci. 2003;21:423–9. [35] FAOSTAT data, 2019. http://www.fao.org/faostat/en/#data.
[17] Al-Omran AM, Aly AA, Al-Wabel MI, Al-Shayaa MS, Sallam AS, [36] Rahman MT, Aldosary AS, Mortoja MdG. Modeling future land
Nadeem ME. Geostatistical methods in evaluating spatial cover changes and their effects on the land surface
variability of groundwater quality in Al-Kharj Region, Saudi temperatures in the Saudi Arabian Eastern Coastal City of
Arabia. Appl Water Sci. 2017;7:4013–23. Dammam. Land. 2017;6:36. doi: 10.3390/land6020036.
[18] Al-Zarah AI. Elemental composition of groundwater and spring [37] Drechsel P, Olufunke C, Niang S. Conserving land, protecting
waters in Al-Ahsa Oasis, Eastern Region Saudi Arabia. Trends water. In: Bossio D, Geheb K. editor. Sustainability and
Appl Sci Res. 2011;6(1):1–18. Resilience of the Urban Agricultural Phenomenon in Africa.
[19] Al-Zarah AI. Chemistry of groundwater of AI-Alisa Oasis Part II, 8. CAB International; 2008, ISBN: 13-978-1-84593-
Eastern Region Saudi Arabia and its predictive effects on soil 387-6.
properties. Pak J Biol Sci. 2008;11(3):332–41. [38] Yaish MW, Kumar PP. Salt tolerance research in date palm tree
[20] Al-Taher AA. Estimation of potential evapotranspiration in Al- (Phoenix dactylifera L.), past, present, and future perspec-
Ahsa Oasis, Saudi Arabia. Geo J. 1992;26(3):371–9. tives. Front Plant Sci. 2015;6:348. doi: 10.3389/
[21] Almadini AM, Al-Safarjalani AM, Al-Naeem AA. Spatial variations fpls.2015.00348.
in chemical properties of irrigation groundwater at Al-Ahsa Oasis, [39] Ayers RS, Westcot DW. Water quality for agriculture. Paper
Kingdom of Saudi Arabia. Arab Gulf J Sci Res. 2007;25(4):207–18. 29FAO Irrigation and Drainage. Rome: FAO; 1976.
[22] Richards JA, Jia X. Remote sensing digital image analysis, an [40] Sappa G, Ergul S, Ferranti F, Sweya LN, Luciani G. Effects of
introduction. 4th ed. Berlin: Springer-Verlag; 2006. seasonal change and seawater intrusion on water quality for
[23] Ellis EA, Baerenklau KA, Marcos-Martínez R, Chávez E. Land drinking and irrigation purposes, in coastal aquifers of Dar es
use/land cover change dynamics and drivers in a low-grade Salaam, Tanzania. J Afr Earth Sci. 2015;105:64–84.
marginal coffee growing region of Veracruz, Mexico. [41] Al-Omran AM, Aly AA, Al-Wabel IM, Sallam AS, Al-Shayaa MS.
Agroforest Syst. 2010;80:61–84. Hydrochemical characterization of groundwater under agri-
[24] Congalton RG, Green K. Assessing the accuracy of remotely cultural land in arid environment: a case study of Al-Kharj,
sensed data, principles and practices. 2nd ed. Boca Raton, FL: Saudi Arabia. Arab J Geosci. 2015;9:9–15.
CRC Press; 2009. [42] Minhas PS. Saline water management for irrigation in India.
[25] Jensen JR. Introductory digital image processing. 3rd ed. Agr Water Manage. 1996;30:1–24.
Upper Saddle River, NJ: Prentice Hall; 2005, ISBN: [43] Mohamed AA, Mohaldeen AA, Abdulatif AA. Spatial variations
0-13-145361-0. in chemical properties of irrigation groundwater at Al-Ahsa
[26] Lillesand TM, Kiefer RW, Chipman JW. Remote sensing and Oasis, Kingdom of Saudi Arabia. Arab Gulf J Sci Res.
Image Interpretation. New York, NY: John Wiley & Sons, Inc.; 2007;254:207–18.
2008. p. 213. ISBN: 978-0-470-05245-7. [44] Al-Jaloud AA, Hussain G. Water quality of different aquifers in
[27] Klute A. Water retention: laboratory methods. In: Klute A, editor. Saudi Arabia and its predictive effects on soil properties. Arid
Methods of Soil Analysis, Part 1, Physical and Mineralogical Soil Res Rehabil. 1993;7(2):85–101. doi: 10.1080/
Methods. Madison: ASA and SSSA; 1986. pp. 635–62. 15324989309381339.
[28] Aly AA, Al-Omran AM, Sallam AS, Al-Wabel MI, Al-Shayaa MS. [45] Zaidi FK, Nazzal Y, Jafri MK, Naeem M, Ahmed I. Reverse ion
Vegetation cover change detection and assessment in arid exchange as a major process controlling the groundwater
environment using multi-temporal remote sensing images and chemistry in an arid environment: a case study from north-
ecosystem management approach. Solid Earth. western Saudi Arabia. Environ Monit Assess. 2015;187:607.
2016;7:713–25. doi: 10.5194/se-7-713-2016. doi: 10.1007/s10661-015-4828-4.You can also read