Investor Presentation - June 2021 - cloudfront.net
←
→
Page content transcription
If your browser does not render page correctly, please read the page content below
Investor Presentation
June 2021
Disclaimer
This presentation has been designed to provide general information about Texas Pacific Land Corporation and its subsidiaries (“TPL” or the “Company”). Any information contained or referenced herein is suitable only as an introduction to the
Company. The recipient is strongly encouraged to refer to and supplement this presentation with information the Company has filed with the Securities and Exchange Commission (“SEC”).

The Company makes no representation or warranty, express or implied, as to the accuracy or completeness of the information contained in this presentation, and nothing contained herein is, or shall be, relied upon as a promise or representation,
whether as to the past or to the future. This presentation does not purport to include all of the information that may be required to evaluate the subject matter herein and any recipient hereof should conduct its own independent analysis of the
Company and the data contained or referred to herein.

Unless otherwise stated, statements in this presentation are made as of the date of this presentation, and nothing shall create an implication that the information contained herein is correct as of any time after such date. TPL reserves the right to
change any of its opinions expressed herein at any time as it deems appropriate. The Company disclaims any obligations to update the data, information or opinions contained herein or to notify the market or any other party of any such changes,
other than required by law.

Industry and Market Data

The Company has neither sought nor obtained consent from any third party for the use of previously published information. Any such statements or information should not be viewed as indicating the support of such third party for the views
expressed herein. The Company shall not be responsible or have any liability for any misinformation contained in any third party report, SEC or other regulatory filing. The industry in which the Company operates is subject to a high degree of
uncertainty and risk due to a variety of factors, which could cause our results to differ materially from those expressed in these third-party publications. Some of the data included in this presentation is based on TPL’s good faith estimates, which are
derived from TPL’s review of internal sources as well as the third party sources described above. All registered or unregistered service marks, trademarks and trade names referred to in this presentation are the property of their respective owners,
and TPL’s use herein does not imply an affiliation with, or endorsement by, the owners of these service marks, trademarks and trade names.

Forward-looking Statements

This presentation contains certain forward-looking statements within the meaning of the U.S. federal securities laws that are based on TPL’s beliefs, as well as assumptions made by, and information currently available to, TPL, and therefore involve
risks and uncertainties that are difficult to predict. These statements include, but are not limited to, statements about strategies, plans, objectives, expectations, intentions, expenditures and assumptions and other statements that are not historical
facts. When used in this document, words such as “anticipate,” “believe,” “estimate,” “expect,” “intend,” “plan” and “project” and similar expressions are intended to identify forward-looking statements. You should not place undue reliance on these
forward-looking statements. Although we believe our plans, intentions and expectations reflected in or suggested by the forward-looking statements we make in this presentation are reasonable, we may be unable to achieve these plans, intentions
or expectations and actual results, performance or achievements may vary materially and adversely from those envisaged in this document. For more information concerning factors that could cause actual results to differ from those expressed or
forecasted, see TPL’s annual report on Form 10-K and quarterly reports on Form 10-Q filed with the SEC. The tables, graphs, charts and other analyses provided throughout this document are provided for illustrative purposes only and there is no
guarantee that the trends, outcomes or market conditions depicted on them will continue in the future. There is no assurance or guarantee with respect to the prices at which the Company’s common stock will trade, and such securities may not
trade at prices that may be implied herein.

TPL’s forecasts and expectations for future periods are dependent upon many assumptions, including the drilling and development plans of our customers, estimates of production and potential drilling locations, which may be affected by
commodity price declines, the severity and duration of the COVID-19 pandemic and related economic repercussions or other factors that are beyond TPL’s control.

These materials are provided merely for general informational purposes and are not intended to be, nor should they be construed as 1) investment, financial, tax or legal advice, 2) a recommendation to buy or sell any security, or 3) an offer or
solicitation to subscribe for or purchase any security. These materials do not consider the investment objective, financial situation, suitability or the particular need or circumstances of any specific individual who may receive or review this
presentation, and may not be taken as advice on the merits of any investment decision. Although TPL believes the information herein to be reliable, the Company and persons acting on its behalf make no representation or warranty, express or
implied, as to the accuracy or completeness of those statements or any other written or oral communication it makes, safe as provided for by law, and the Company expressly disclaims any liability relating to those statements or communications (or
any inaccuracies or omissions therein). These cautionary statements qualify all forward-looking statements attributable to us or persons acting on our behalf.

Non-GAAP Financial Measures

In this presentation, TPL utilizes earnings before interest, taxes, depreciation and amortization (“EBITDA”), which is not defined in the U.S. generally accepted accounting principles (“GAAP”). TPL believes that EBITDA is a useful supplement to net
income as an indicator of operating performance. EBITDA is not presented as an alternative to net income and it should not be considered in isolation or as a substitute for net income. Please see Appendix for a reconciliation of EBITDA to net
income, the most directly comparable financial measure calculated in accordance with GAAP.

                                                                                                                                                                                                                     NYSE: TPL                 |2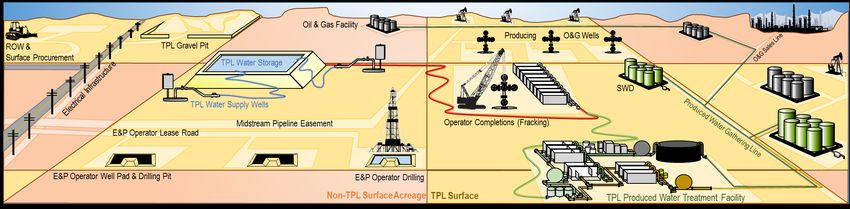
The Permian Basin “ETF”
     NYSE: TPL

                                                                                                                                                                    Balance Sheet
          “2nd Best Year in TPL History”
                                                                                                                                           $200mm+                  Strength(1)
                                              Performance                                                                                  Dividends Paid in 2020
                        $
                                              Through the Cycle                                                                                                     No Debt
                                                                                                                                   $
                                                                                                                                           17 Year                  Cash Balance of
                                              $303 Million                                                                                 History of Increasing
                                              2020 Revenue                                                                                 Dividends                $311 Million

                                              100% Texas                                                                                   Diversified              ~23,700
                                              Permian                                                                                      Revenue                  Core Permian Net
                                                                                                                                                                    Royalty Acres(2)
                                              Exposure                                                                                     Streams:                 ~880,000
                                                                                                                                           Royalties, Water, and
                                                                                                                                           Surface                  Surface Acres

                                                                                                                                                                    Robust Inventory(5) of
                             $                 ~150%                                                                                   $   ~21 Years                541 DUCs
                                               Production Growth                                                                           Inventory Below          and
                                               since 2018(3)                                                                               $40/bbl Breakeven(4)
                                                                                                                                                                    488 Permits
Source:   Company data and Enverus.
(1)       Balance sheet as of 3/31/21.

                                                                                                                                                                                       |3
(2)       Net royalty acres defined as gross royalty acres (533,260) in-basin multiplied by the average royalty per acre (4.4%).
(3)
(4)
          Increase in daily average net well production from 1Q’18 to 1Q’21.
          Based on total inventory with a breakeven oil price less than $40/bbl divided by 2020 average net spud count.
                                                                                                                                                                          NYSE: TPL
(5)       As of 3/31/21 per Enverus and internal TPL estimates.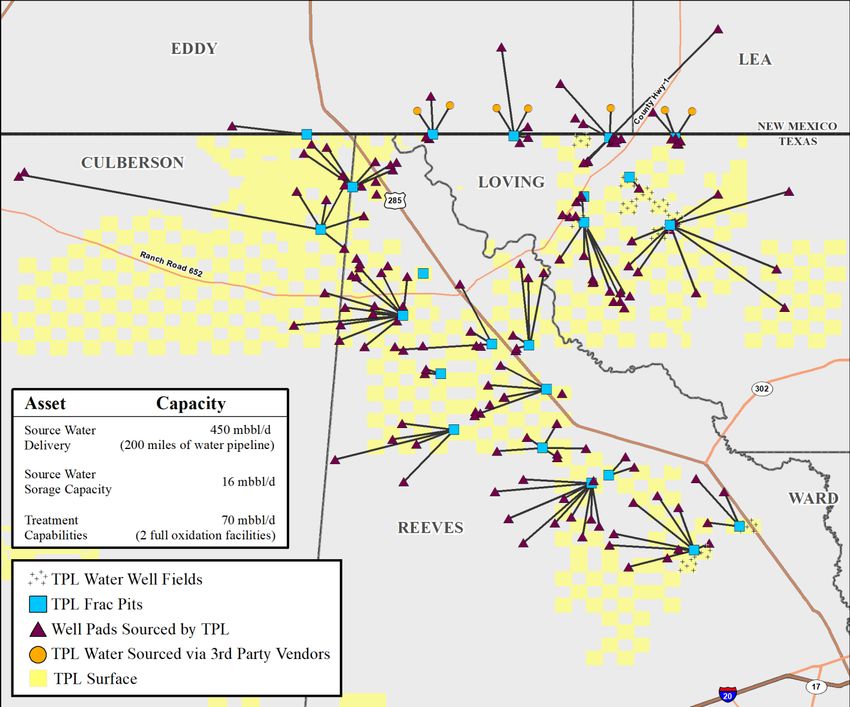
An Unmatched Oil and Gas Investment

                          10-year Average Annual Total Return(1)

                                                                                                                   44%

                                                                                                            18%
                                                 (Composite)

                                                                                                      14%

                                        WTI Oil                                                 -6%

                                        S&P Oil & Gas                                   -10%
                                        E&P Index

Source:   FactSet .
(1)       Based on FactSet compounded total shareholder return from April 2011 to March 2021.

                                                                                                                  NYSE: TPL   |4
Unique Exposure to Full Permian Development Chain
    TPL Business Overview                                                         Business Flow Overview
                          ■ TPL surface generates multiple income streams                                                 Surface
          SLEM              from Oil & Gas activities, Renewables, Grazing and
                            Hunting leases                                            ✓ Ownership of right of way
                                                                                      ✓ Ownership of groundwater and subsurface injection rights
                          ■ TPL owns an average 4.4% revenue interest across
     Royalties              ~533,260 gross royalty acres in the Permian Basin         ✓ High margins with no capital

                          ■ TPWR provides sourced and treated water for well                                Provides ease of access
          TPWR              completions and facilitates produced water disposal

                                     1Q21 TPL Revenue
    ($ in millions)                                                                              Royalties                                        Water

                                        10%
                                                                                  ✓   Assets located in the core of the          ✓    Provides operational solutions
                                                                                      Permian                                         across sourcing and disposal
                             31%                                                  ✓   No capex or opex burden for organic        ✓    Disposal comprises significant
                                                                                      production and cash flow growth                 portion of operator LOE

                                 $84.2mm                                          ✓   Real ownership of assets underlying        ✓    Royalty stream with limited capex
                                                                                      cash flow generation                            requirements to capture additional
                                                                                                                                      value
                                                                                  ✓   Demand for water disposal services
                                                                                      and locations on TPL surface has
                                           59%                                        significantly out-paced the rest of                    Allows continued
                                                                                      the Permian
                                                                                                                                               development

             Maximize Surface Ownership to Operate Profitable Water Business that Facilitates Development of Royalty Acreage
Source:   Company data.
                                                                                                          = Land and Resource Management
                                                                                  Reporting
                                                                                  Segments:
                                                                                                          = Water Services and Operations
                                                                                                                                               NYSE: TPL        |5
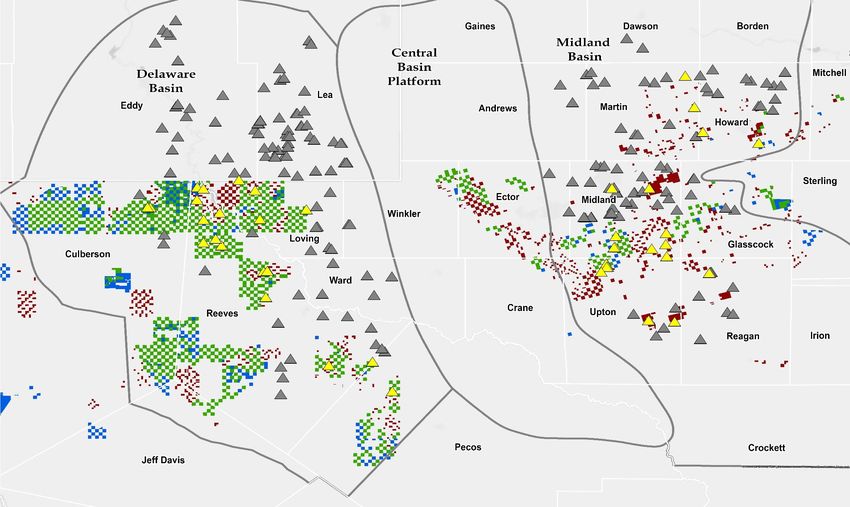
Royalty Interest Overview
Land and Resource Management
Net Royalty Position and Rigs Running on Core TPL Acreage Net Royalty Acres Distribution
Northern
Delaware
9.0%
Southeast
11.1% Delaware
38.8%
NRA(2): Southwest
~23,700 Delaware
19.5%
Midland
Other
21.6%
Key Operators with a Permian Focus
21.6%
11.9%
9.1%
2.7% Net
Royalty Acreage
2.4%
Wells(3):
4.2%
(~533,260 Gross Royalty Acres / ~23,700 Net Royalty Acres)
3.7%
59.8 12.5%
Surface Acreage (~880,000 acres)
Combined Royalty & Surface Acreage (63% of NRA(1)) 8.6%
9.7%
Active Rigs on TPL Royalty & Surface Acreage (42 Rigs – 21 6.7% 6.8%
Delaware, 21 Midland)
Active Permian Rigs (221 Rigs – 118 Delaware, 103 Midland)
Other
Source: Company data and Enverus data as of 6/1/21.
Note: Rigs on TPL based on 0.25 mile buffer around TPL Royalty Acreage DSUs and TPL Surface. Rig counts include active Horizontal, Directional and Unclassified rigs per Enverus Rig Analytics.
(1)
(2)
Based on 754,080 combined surface and gross royalty acres and 441,013 gross royalty only acres.
Net royalty acres defined as gross royalty acres (~533,260) multiplied by the average royalty per acre (4.4%) as of 1Q’21. NYSE: TPL |6
(3) Includes net 42.5 PDP, 7.9 DUCs, 2.3 Completed and 7.1 Permitted wells (represents only horizontal locations) as of 3/31/21.
Exposed to Diverse Client Base Required to Utilize TPL Surface /
Water
E&P Companies on TPL Midstream Companies on TPL
Market Cap (in $ billions) as of 3/31/2021
✓High Margin, Fixed-fee Revenue Streams
$236.4
✓Strong Performance Through Commodity Price Fluctuations
$202.0 Existing Relationship with TPL(1)
Other Permian Operators
Drill on TPL NRA
$148.3
$82.7
Permian Private Operators
$71.8
$42.3
$34.4
$24.8
$14.7$13.3
$8.4 $6.8 $6.2 $6.1
$3.4 $2.7 $1.9 $1.8 $1.5 $1.2 $0.4
Endeavor
Exxon
Hunt
Apache
Ovintiv
Sabinal
Sheridan
BP
Discovery
Conoco
Pioneer
Cimarex
Chevron
Occidental
PDC
Callon
Shell
Devon
Laredo
BTA
DE3
Sable
Marathon
Centennial
EOG
Diamondback
Matador
Surge
Fasken
SM Energy
Crownquest
Four Corners
Legacy
Mewbourne
Sequitur
TPL has Existing Relationships with Over 91% of the Top E&P and also Blue-Chip Midstream Companies(2)
Source: Company data and FactSet as of 3/31/21.
(1) Relationships established through surface operations and/or water sourcing / produced water.
(2) Based on publicly traded operators and midstream companies. NYSE: TPL |7
Business Segments Overview
Production and Free Cash Flow(1) Growth 2020
($ in millions, unless specified)
Land and Resource
Water
Adjusted EBITDA (6)
$400 18.0 Management
Services and
16.2 69%
Operations
31%
$350 16.0
13.7
14.0 ~$239mm(5)
$300
12.0
$250 $230
8.8 $205 10.0
$200
8.0
$150 $125
5.1 6.0 Land and Resource Water Services
Free Cash Flow(1)
Management and Operations
$100 3.3 $75
65% 35%
4.0
$50 $40
2.0 ~$205mm(3)(5)
$0 –
(2)(3)
2016 2017 2018 2019 (3)(4)
2020 (3)(5)
Free Cash Flow(1) Net Production (mboe/d)
Source: Company data.
Note: Land and Resource Management values inclusive of land-related surface and easement income. Water Services and Operations values inclusive of water-related surface and easement income. Please see Appendix for reconciliations of non-GAAP financial measures to their most directly comparable GAAP measures.
(1) Free cash flow calculated as cash flow from operations less capital expenditures. Capital expenditures do not include acquisitions.
(2)
(3)
(4)
Normalized for one-time ~$19 million sale of nonparticipating perpetual oil and gas royalty interest in approximately 812 net royalty acres (1/8th interest).
Assumes corporate tax rate of 21%.
Normalized for one-time ~$100 million WPX land sale, one-time ~$22 million land swap and one-time ~$13 million costs related to a proxy contest to elect a new Trustee.
NYSE: TPL |8
(5) Normalized for one-time ~$5 million costs related to corporate reorganization.
(6) Please see Appendix for reconciliations of non-GAAP financial measures to their most directly comparable GAAP measures.
History of TPL

                                                                                                                                                                         $

                                   1888                                     1927                                      1954                                       2001                 2015                          2019
                                                                                                       The mineral estate under
                     Texas & Pacific Railway  TPL listed on NYSE. TPL is                                                                              Chevron acquired
                                                                                                       TPL’s land was spun-off to                                              Rapid development
                    bankruptcy leads to the         among the few                                                                                   Texaco for $36 billion,                               Conversion Committee
                                                                                                        its shareholders under a                                               across much of TPL’s
                       formation of Texas           Depression Era                                                                                and now performs as an                                 formed to evaluate if the
                                                                                                          new company named                                                       acreage leads to
                    Pacific Land Trust, where companies that continue                                                                              operator across a large                               Trust should convert into
                                                                                                        TXL Oil. TPL reserved an                                                 increased royalty
                      all land assets were     trading today, almost a                                                                            portion of TPL’s Permian                                   a C-corporation.
                                                                                                       NPRI under certain tracts                                              revenues for the Trust.
                              placed.                century later.                                                                                       position.
                                                                                                                of land(1).

                 1871 - 1888                                                                               1889 - 2010                                                                     2011 - Present
                           1871                                           1920’s                                      1962                                      2010’s                 2017                         2021
                                                                  Texas and Pacific                                                                   The Permian Basin
                                                             Abrams #1 becomes the                        Texaco purchased TXL                          begins to grow
           Texas & Pacific Railway is                                                                                                                                             TPL announces
                                                              first well to produce oil                    Oil which at the time                        production as
           created and was granted                                                                                                                                              formation of Texas       TPL’s reorganization to a
                                                             from the Permian Basin,                        held over 2 million                        unconventional
           ~3.5 million acres of land                                                                                                                                         Pacific Water Resources      C-Corp is completed
                                                             and a few years later, the                   undeveloped acres in                       development unlocks
            from the State of Texas.                                                                                                                                              LLC (“TPWR”)(2).
                                                              first oil pipeline is built                       west Texas.                         tremendous additional
                                                                     in the basin.                                                                         reserves.

Source: Company data.
(1)     A fixed 1/16 NPRI was reserved under all lands held by the primary term of an oil and gas lease and a fixed 1/128 NPRI under all lands held by production.
(2)     TPWR is a 100% wholly owned subsidiary of TPL.                                                                                                                                                  NYSE: TPL          |9
Key Investment Highlights

                                                                                   ■      ~$303 million in total revenue for YE2020 - second highest in company history
           Performance Through                                                     ■      ~$51 million in 2020 revenue from disposal royalties and water related easements – highest in company history
                 the Cycle                                                         ■      ~16.4 mboe/d 1Q21 average daily royalty production

                                                                                   ■      Largest royalty company with 100% of acreage located in Texas Permian Basin
               ETF of the Permian                                                  ■      Three high-margin revenue streams linked to the development intensity of the Permian – multiple “ways to win”
                      Basin                                                        ■      Unparalleled position consisting of ~23,700 net royalty acres (“NRAs")(1) and ~880,000 surface acres
                                                                                   ■      TPL interest is focused in the Delaware where rig count represents ~28% of total horizontal rigs across the U.S.

                                                                                   ■      Ownership of surface provides right-of-way for continued development across TPL’s footprint
             Synergistic Business                                                  ■      Rights to water and ability to promote operational solutions promotes further growth of the royalty business
                 Segments                                                          ■      Upside exposure to water disposal revenues as Delaware Basin production growth persists

                                                                                   ■      Despite challenged oil and gas markets, TPL returned over $200mm to shareholders during 2020
          Focus on Return On and                                                   ■      $2.75/share quarterly dividend
                 Of Capital                                                        ■      Announced stock repurchase program up to an aggregate $20 million through YE2021

           Sustained Profitability                                                 ■      Robust 2020 Adjusted EBITDA(2) margin of 79% despite oil prices remaining below $50/bbl throughout the
                                                                                          majority of 2020
            and Pristine Balance                                                   ■      No capex for organic royalty or land business growth; minimal for water
                   Sheet                                                           ■      No debt and cash balance of ~$311 million as of 1Q21

                                                                                   ■      Significant undeveloped potential: only 10% of royalty acreage is developed with ~21,650 gross undeveloped locations(3)
                                                                                   ■      High concentration in what TPL believes is best part of Permian, with ~21 years of inventory under $40/bbl breakeven (4)
                 Significant Upside
                                                                                   ■      Water business continues to capitalize on opportunities to expand market share leading to future long-term growth
                                                                                   ■      Surface in frontier areas provides upside as development core expands with enhanced D&C and technology

Source:   Company data, FactSet and Enverus as of 3/31/21.
(1)       Net royalty acres defined as gross royalty acres (~533,260) multiplied by the average royalty per acre (4.4%).
(2)
(3)
          Please see Appendix for reconciliations of non-GAAP financial measures to their most directly comparable GAAP measures.
          As of 3/31/21 per Enverus and TPL internal estimates. Gross drilling locations based on an average lateral length of 6,975 as per the expected DSU.
                                                                                                                                                                                        NYSE: TPL        | 10
(4)       Based on total inventory with a breakeven oil price less than $40/bbl divided by average 2020 net spud count.
Comparison of Key Statistics
Land and Resource Management
(Permian only)
Net Royalty Acres
~23,700 24,350 10,991 4,339
(NRA)(1)
Permian NRA % 100% ~97% ~39%
Delaware NRA % ~80% ~47% ~33%
Net Permian Resource
(mboe) / NRA(2) 26.1 23.6 NM
Midland Delaware
Dev
10%
Dev
Dev Dev 27%
15%
Dev 34%
Percent 30%
Undeveloped(3)
Undev
Undev 66% Undev
70% 73%
Undev Undev
90% 85%
Key E&P Operators
Significant Surface
Ownership
✓
Highest Permian Resource Per Acre of All Permian Peers Due to High Concentration in Stateline Area
Source: Company data, public filings and Enverus as of 6/1/21.
(1) TPL NRA is based on 4.4% average royalty interest per acre. VNOM NRA reported in May 2021 Investor Presentation. MNRL NRA reported in Q1 2021 Investor Presentation.
(2) Midland and Delaware only. TPL based on net resource (498 Mmboe) divided by NRA (19,084) where net resource is the product of subregion gross resource and implied NRI. VNOM based on net resource (559 Mmboe) divided
by NRA (23,669), as per May 2021 Investor Presentation. NYSE: TPL | 11
(3) Based on only horizontal wells. TPL Dev figure represents PDP only.Surface Leases, Easements and Material Sales (“SLEM”)
Land and Resource Management
~880,000 Surface Acres With a Concentration in Core Permian Areas Generates Multiple Long-Term Income Streams with No Opex
✓ Extensive position allows our surface to benefit from development occurring
on and adjacent to TPL land
▪ Since 2018, SLEM revenue has annually represented ~19% of total TPL E&P Oil & Gas Facility
revenues(1)
on non-TPL Surface
TPL Caliche Pad
▪ Generates majority of its surface revenue from easements related to
pipeline infrastructure Surface
E&P Lease Road to Operations on non-TPL Surface
TPL Caliche
procurement Pad
▪ Generates lease and material (caliche) sale revenues in addition
✓ Majority of easements have 30+ year term but subsequently renew every ten SWD on non-TPL
years with an additional payment (initial fee plus ~15%) Surface
TPL SLEM Revenue Tracks the Region’s Well Count TPL Caliche
Pad
$280 4,500
TPL Has Averaged
Cumulative SLEM Revenue
TPL Caliche Pit Non-TPL Surface Acreage
Cumulative Horizontal Well
$240 ~$60,000 in SLEM Revenue 4,000 E&P Oil & Gas Facility
for Every Well Drilled On 3,500 on TPL Surface
Count Since 2016(3)
$200
and Surrounding its Core
since 2016(2)
3,000 TPL Surface
$160 Permian Surface Position 2,500 SWD on TPL Surface
$120 2,000
1,500
$80
1,000
$40
500
– –
Solar Farm
on TPL Surface
SLEM Revenue Well Count
The TPL Surface Position Can’t be Replicated Amongst Royalty and Water Companies
Source: Company data and Enverus.
(1) Total revenue adjusted for one-time land swap of $22mm in 2019 and one-time land / royalty sales of $100mm and $19mm in 2019 and 2018, respectively.
(2)
(3)
SLEM revenue represents TPL’s cumulative easements and other surface related income from 1/1/16 through 3/31/21 for Land and Resource management segment.
Cumulative horizontal well count per Enverus in TPL’s Northern Delaware Region (~950,000 acres) and TPL’s Midland Region (~250,000 acre region around TPL’s surface in East Ector,
NYSE: TPL | 12
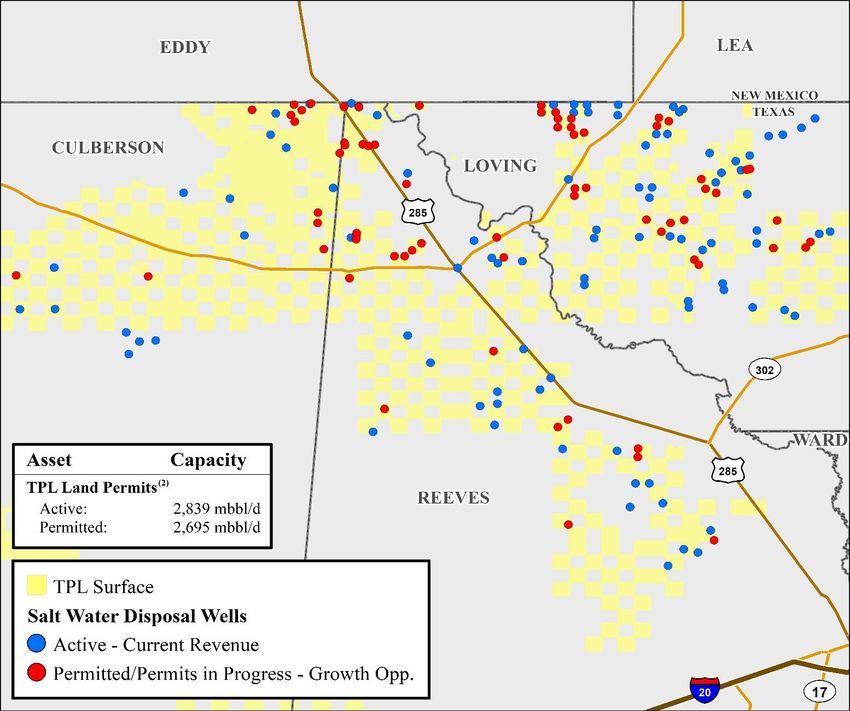
Midland, Upton and Glasscock Counties).Water Resources Asset Overview
Water Services and Operations
Salt Water Disposal Wells Update TPL Water Sourcing Infrastructure
Water Oil Ratio(1) 4:1
Updated
BB
Disposed Water Volume Growth Sustained by Highest WOR Areas Sourced Water Business Driven by High Fluid Intensity Areas
Source: Company data and B3 Insight data as of 6/1/2021.
Note: TPL does not operate any water disposal wells.
(1)
(2)
Water oil ratio (“WOR”) defined as the ratio of 12-month cumulative water production to 12-month cumulative oil production.
Revenue received both on and off TPL surface based on existing contracts.
NYSE: TPL | 13Growth Strategy and Competitive Advantage
Water Services and Operations
Produced Water Royalties Stability Through the Cycle Significant Acreage Dedicated to TPL Disposal Royalties
($ in millions)
Despite 2020’s challenging back drop of Strong 1Q21 ■ Current and future wells drilled within TPL’s ~450,000-acre dedication
COVID-19 and oil price weakness, TPL’s performance provide a significant base for disposal royalty growth in the future
produced water royalty business despite
generated its highest ever annual February ■ In addition, TPL collects royalties on significant disposal volumes that are
revenue storm produced outside the contracted acreage but brought into TPL’s associated
downtime systems for disposal providing additional growth opportunities in the future
$14.0 $80 EDDY LEA
$70
$12.0
$60
$10.0
$50
$8.0
$40
$6.0
$30
$4.0
$20
$2.0
$10 Over 70% or ~450,000 acres in TPL’s core
northern Delaware region is dedicated to
systems where TPL has disposal royalties
– –
1Q18 2Q18 3Q18 4Q18 1Q19 2Q19 3Q19 4Q19 1Q20 2Q20 3Q20 4Q20 1Q21 Core N. Delaware Region ~610,000 acres
Produced water royalties ($mm) Average WTI Price ($/bbl) TPL Surface Acreage ~245,000 acres
Royalty Based Business Model Captures Increased Disposal Volumes in Northern Delaware Focus Area
Source: Company data and FactSet data as of 3/31/21.
NYSE: TPL | 14TPL is a Market Leader for Water in the Northern Delaware
Water Services and Operations
Northern Delaware Produced Water Volumes of ~1,160 mbbls/d at ~$0.11/bbl(1) Northern Delaware Sourced Water Volumes of ~335 mbbls/d at ~$0.45/bbl(2)
Total Produced Water Volumes of ~1,270 mbbls/d at ~$0.11/bbl(1) Total Sourced Water Volumes of ~340 mbbls/d at ~$0.45 / bbl(2)
TPL’s Established Footprint Allows Optionality with Winter Provides Irreplaceable Additional Upside as Aquifer
3,500 SWD Operators to Negotiate Increased Economics Storm 60% 1,800 Runs Underneath TPL Land 40%
Impact
1,600 ~30% capture rate for 2020 and 1Q21 35%
3,000
50%
Over 40% capture rate for 2020 and 1Q21
1,400 2019 Average Capture Rate
2020 Average Capture Rate 30%
Produced Volumes (mbbls / day)
Completions Volumes (mbbls / day)
2,500
2020 Average Capture Rate
40% 1,200
TPWR Capture Rate
25%
TPWR Capture Rate
2,000 2018 Average Capture Rate
1,000
2019 Average Capture Rate
30% 20%
800
1,500
2018 Average Capture Rate
15%
20% 600
1,000
10%
400
10%
500
200 5%
– 0% – 0%
Jan-18 Jul-18 Jan-19 Aug-19 Feb-20 Sep-20 Mar-21 Jan-18 Jul-18 Jan-19 Aug-19 Feb-20 Sep-20 Mar-21
(2)
Northern Delaware Region Volumes (Estimated)
(1)
TPL Northern Delaware Volumes (Actuals)
Northern Delaware Region Volumes (Estimated) TPL Northern Delaware Volumes (Actuals)
Royalty Based Business Model Captures Increased Sourcing and Disposal Volumes in Northern Delaware Focus Area
Source: Company data and Enverus as of 3/31/21.
Note: Northern Delaware Region is defined as approximately 1,400,000 acres surrounding TPL’s Northern Delaware Surface position including ~900,000 acres in Texas and ~500,000 acres in Southern New Mexico.
| 15
Capture rate defined as TPL volumes as a percentage of total volumes in the Northern Delaware Region. Regional water volumes based on Enverus estimated WOR, historic oil production and Enverus oil type curves. Historic volumes represent horizontal wells drilled since TPWR formation in June 2017.
(1) TPL data is the average for 1Q21; Regional produced water volumes based on Enverus estimated water production from wells drilled since TPWR formation (June 2017) shown through 1Q21 based on available data.
NYSE: TPL
In our Northern Delaware Region since our last presentation released in February 2020, approximately 200 completion records occurring in 2018 and 2019 were backfilled via state and Enverus data sources. This update has resulted in a lower reported capture rate for TPL sourced water during historic periods.
(2) TPL data is the average sourced + treated volumes for 1Q21. Regional sourced /treated water demand based on Enverus reported well fluid intensity volumes for wells completed in the Northern Delaware Region shown through 1Q21 based on available data.Summary of Financials
Adjusted EBITDA(1) Capex by Business Segment
($ in millions) ($ in millions)
Margin: 95% 95% 94% 87% 82% 79%
$48
$302
$245 $239
$145
$55 $63 $32
TPL estimates
an additional
2015 2016 2017 2018 2019 2020 $7 - $9 million
$45 for remainder
Net Production per Share(2) of 2021
$19
(mboe/d per mm share)
$30
2.1 $10 - $12
1.8
$18
$5
1.1
$5 $3
0.6 $1 $3 $2
0.4
0.3
2017 2018 2019 2020 2021E
2015 2016 2017 2018 2019 2020 Water Service and Operations Land and Resource Management
Source: Company data.
Note: Revenue was restated retrospectively upon adoption of new revenue recognition guidance on 1/1/18. CAGR defined as the compounded annual growth rate from 2015 to 2020. Please see Appendix for
(1)
reconciliations of non-GAAP financial measures to their most directly comparable GAAP measures.
EBITDA adjusted for land sales deemed significant, sales of oil and gas royalty interests, one-time costs related to a proxy contest to elect a new Trustee in 2019, and corporate reorganization costs in 2020.
NYSE: TPL | 16
(2) Calculated as average daily net production during the year divided by the average number of shares outstanding during the year.Return of Capital to Shareholders
Cumulative Return of Capital
($ in millions, except average WTI prices) $140.00
$201.7
$200.0
$120.00
$97.98
$94.88 $94.12 $100.00
$92.90
$150.0
$79.48
$80.00
$65.08
$100.0 $56.99
$60.00
$50.78
$48.69
$43.35 $70.0
$39.19
$40.00
$50.9
$50.0 $44.9 $38.4 $4.3
$35.6
$31.2
$24.5 $25.2 $25.2 $20.00
$18.0 $34.2
$46.6
$12.7 $33.1
$20.2 $28.8 $31.6
$25.2 $23.0
$16.0
$10.7 $10.7
– $2.0 $2.0 $4.3 $2.2 $2.4 $2.5 –
(1) (1)
2010 2011 2012 2013 2014 2015 2016 2017 2018 2019 2020
Dividends Share Repurchases Average WTI Price
Source: Company data and FactSet
(1) Dividends for 2012 includes $2.2 million of dividends for 2013 which were paid in the fourth quarter of 2012.
NYSE: TPL | 17An Unmatched Oil and Gas Investment
Summary Investment Highlights 10-year Average Annual Total Return(1)
Performance Through the Cycle
44%
ETF of the Permian Basin
18%
(Composite)
Synergistic Business Segments
14%
Focus on Return On and Of
Capital
Sustained Profitability and
WTI Oil -6%
Pristine Balance Sheet
S&P Oil & Gas
-10%
Significant Upside E&P Index
Source: FactSet.
(1) Based on FactSet compounded total shareholder return from April 2011 to March 2021.
NYSE: TPL | 18Appendix
Texas Pacific Land Corporation Team
Track Record of Shareholder Value Creation
Texas Pacific Land Corporation                                                                                                                       Texas Pacific Water Resources

     Tyler Glover                 Chris Steddum            Micheal W. Dobbs                     Stephanie                   Katie Keenan                Robert A. Crain                 Jeremy Smith
   President and CEO                     CFO                SVP, General Counsel                Buffington                VP, Assistant General                 EVP                        VP, Business
                                                                                                    CAO                         Counsel                                                    Development

Mr. Glover serves as TPL’s     Mr. Steddum came to TPL     Mr. Dobbs came to TPL         Ms. Buffington came to          Ms. Keenan came to TPL in   Robert Crain has served as      Mr. Smith came to Texas
President and Chief            from Stifel’s oil and gas   from Kelley Drye & Warren     TPL from Monogram               January 2017 and            Executive Vice President of     Pacific Water Resources
Executive Officer. He          investment banking team     LLP where he was a            Residential Trust, a publicly   transitioned to Vice        Texas Pacific Water             from EOG Resources
                               where he served as a        Partner with the firm.        traded REIT, where she          President, Land and Legal   Resources since its             where he negotiated water
served as Chief Executive
                               Director.                                                 served as Vice President of     at Texas Pacific Water      formation in June 2017.         sourcing and purchasing
Officer, Co-General Agent
                                                           Mr. Dobbs has over two        Financial Reporting.            Resources. She now serves                                   agreements across the
and Secretary of the Trust                                                                                               as Vice President and
                               Mr. Steddum began his       decades of experience                                                                     Prior to TPWR, Mr. Crain        Permian Basin and the
from November 2016 to                                      with property and mineral     Ms. Buffington has over         Assistant Counsel working
                               investment banking career                                                                                             led water resource              Eagle Ford.
January 11, 2021. Mr. Glover   in the O&G coverage group   rights, water rights,         two decades of public           with TPWR.                  development efforts for
also currently serves as       at Credit Suisse.           easements and leasehold       company experience and                                      EOG Resources across            Prior to EOG, Mr. Smith led
President and Chief                                        negotiations.                 began her career at KPMG.       Previously, Ms. Keenan      multiple basins, including      a successful real estate
Executive Officer of TPWR.     He earned his MBA from                                                                    worked as a Landman for     the Permian and Eagle           broker service.
                               Rice University and         He earned his J.D. from the   She earned her Bachelors        BHP Billiton in the         Ford.
                               Bachelors of Science in     University of Houston and     of Business Administration      Permian Basin.
Previously, Mr. Glover
                               Business Administration     his Bachelor of Science in    in Accounting from the                                      Mr. Crain holds Bachelor of
served as Assistant General
                               from the University of      Rangeland Ecology and         University of Texas at          She earned her law degree   Science Degree from Texas
Agent of the Trust and an                                                                Arlington and is a licensed     from the University of
                               South Carolina Honors       Management from Texas                                                                     State University and M.B.A.
independent landman in                                                                   Certified Public                Oklahoma and is a
                               College.                    A&M and is a licensed                                                                     from University of Texas at
the Permian prior thereto.                                                               Accountant in the State of      licensed attorney in the
                                                           attorney in the State of                                                                  Tyler.
                                                           Texas.                        Texas.                          State of Texas.

                                                                                                                                                                                   NYSE: TPL            | 20
TPL Revenue Streams Through the Life Cycle of a Well
1 Initial Development Phase 2 Drilling and Completion Phase 3 Production Phase
■ Infrastructure for oil & gas development ■ Sourced / Treated water volumes(1) ■ Significant produced water volumes
Typical (gathering, treating and reuse, and
Activities ■ Development of gathering, transportation and disposing back into the ground)
processing infrastructure
■ Fixed fee payments for use of TPL’s ■ Fixed price per barrel for providing brackish ■ Royalty interest on the oil & gas produced
TPL surface to build infrastructure groundwater and / or treated produced water
Revenue ■ Royalty per barrel (injection fee) for
Sources ■ Sale of materials (caliche) used in the ■ Fixed fee payments for the use of TPL’s surface for a allowing saltwater disposal (SWD) on TPL
construction of infrastructure variety of midstream infrastructure requirements lands
Majority of Stable Revenue Streams are Royalty or Fixed-Fee Payments, with Limited-to-No Capital Expenditure Burden
Surface and Royalty Ownership Allow Steady Revenue Generation Through the Entire Life Cycle of Oil & Gas Development
(1) Sourced and Treated water is water used for oil and gas development (i.e. drilling and completions).
= Land and Resource
Management
= Water Services and Operations NYSE: TPL | 21Well Positioned Assets Attract Increasing Development Focus
Land and Resource Management
Average Net Production (mboed) Gross DUC Inventory(1)
531 541
16.2 16.4
486
13.7
362
319
8.8
5.1
121
3.3 107
2.7
71
1.7
2014 2015 2016 2017 2018 2019 2020 1Q21 2014 2015 2016 2017 2018 2019 2020 1Q21
Near-term Royalty Production is Supported by Robust DUC Inventory Held by Well Capitalized E&P Operators
Source: Company data and Enverus.
Note: TPL production growth giving effect to our portfolio of ~23,700 net royalty acres in the Permian Basin as of 3/31/21 as if it had been owned since 1/1/14.
(1) DUCs considered to be all wells awaiting completion. DUC values shown as of period end date. Horizontal wells only.
NYSE: TPL | 22Significant Undeveloped Resource in Core Areas
Land and Resource Management
TPL Inventory by Breakeven to Working Interest Operator
$70 ~21 years of inventory life based on 2020 average
Wellhead PV-10 Breakeven ($/bbl)
$60
net spud rate with breakevens under $40/bbl(1)
$50
$40
$30
$20
$10
$0
10 626 1,969
1,251 1,876 3,938
2,501 3,126 3,751 4,376 5,001 5,6265,907
6,251 6,876 7,5017,876
8,126 8,751 9,376 9,845
10,001 10,626 11,251 11,814 13,78314,376 15,001 15,626
11,876 12,501 13,126 13,751 15,75216,251 16,876 17,501
17,720 19,686
18,126 18,751 19,376
Drilling locations
TPL Inventory by IRR to Working Interest Operator(2)
120%
~21 years of inventory life based on 2020 average
100%
net spud rate with IRRs of greater than 38%
Wellhead BTax IRR
80%
60%
40%
20%
0%
10 626 1,969
1,251 1,876 2,501 3,126 3,7513,938
4,376 5,001 5,6265,907
6,251 6,876 7,501 7,876 9,845 10,626 11,251 11,876
8,126 8,751 9,376 10,001 11,81412,501 13,126 13,751
13,783 15,752
14,376 15,001 15,626 17,720
16,251 16,876 17,501 19,686
18,126 18,751 19,376
Drilling locations
Northern Delaware Southeast Delaware Southwest Delaware Midland
Source: Company data and Enverus data as of 3/31/21.
Note: Enverus assumes no differential for oil and NGL, a $0.70 differential for gas, and NGL pricing at 25% of WTI.
(1)
Excluding areas to be considered outside of basin. Excludes DUCs and Permits. Not showing locations with negative IRRs.
Based on total inventory with a breakeven oil price less than $40/bbl divided by 2020 average net spud count.
NYSE: TPL | 23
(2) IRRs calculated at a flat price of $55.00/bbl and $2.75/mcf of oil and gas, respectively.Summary of Highest-Visibility Inventory
Land and Resource Management
100% NRI Permitted Wells 100% NRI DUC Wells 100% NRI Completed Wells
~94% of Permits are drilled within 6 months(1) ~54% of DUCs are completed within 6 months(2) ~90% of Completed Wells are listed as
~99% of Permits are drilled within 12 months(1) ~91% of DUCs are completed within 12 months(2) producing within ~1 month(3)
2.1% 7.2%
NRI by Operator
9.3%
18.7% 21.0% 9.9%
24.0%
29.2%
13.1%
Permitted DUC Completed 10.6%
7.4%
Wells: Wells(4): 12.1%
Wells:
3.4% 7.1 5.0% 11.7% 7.9 2.3
17.7%
1.1%
14.7%
3.7%
33.0% 8.6%
17.9%
6.6% Other
11.9%
Northern
Delaware
0.8% 7.6%
2.7%
11.7% 10.3%
NRI by Region
6.5% Midland
Permitted 22.0% DUC Completed Southeast
Wells: Wells(4): Wells: Delaware
25.0%
7.1 7.9 2.3 60.9% Southwest
66.8%
Delaware
85.4%
Other
Highest-Visibility Inventory with Top Operators Validates TPL’s Near-Term Production Outlook
Source: Company data and Enverus data as of 3/31/21.
Note: Permian Basin horizontal locations only as of 3/31/21.
(1)
(2)
Permitted well conversion rate based on wells permitted from 4/1/19 through 3/31/20 and then drilled through 3/31/21.
DUC well conversion rate based on wells drilled from 4/1/19 through 3/31/20 and then completed through 3/31/21. NYSE: TPL | 24
(3) Completed well conversion rates based on wells completed between 4/1/19 and 3/31/20.
(4) DUCs considered to be all wells awaiting completion.Summary of Full Inventory
Land and Resource Management
Average Additional Total PDP + Total Gross Undeveloped PDP + Total Average Lat.
(1) (2) (3) (4)
Sub-region NRI NRA DSUs PDP Completed DUCs Permits Undeveloped Locations Locations Resource (Mmboe) Locations / DSU Length (ft.)
Northern Delaware 2.3% 9,206 510 1,340 68 247 275 10,061 10,651 11,991 17,276 24 6,312
Southeast Delaware 2.1% 2,126 102 109 7 45 14 852 918 1,027 664 10 6,553
Southwest Delaware 3.0% 5,112 132 8 – – – 1,870 1,870 1,878 1,966 14 5,336
Delaware 2.4% 16,444 744 1,457 75 292 289 12,783 13,439 14,896 19,905 20 6,205
Midland 0.5% 2,640 344 904 85 244 199 6,916 7,444 8,348 5,827 24 8,483
Other 1.8% 4,631 128 64 11 5 – 750 766 830 341 6 6,054
Total 1.7% 23,715 1,216 2,424 172 541 488 20,449 21,650 24,074 26,073 20 6,975
Established High Near-Term Cash Flow Outstanding Organic Resource Grounded in
Production Conservative
Base Assumptions
Undeveloped Gross Locations
Total Gross Locations
Permitted Wells: 488
DUC Wells: 541
Completed Wells: 172 Northern Delaware: 10,061
PDP Wells: 2,424
Southeast Delaware: 852
Southwest Delaware: 1,870
Additional Undeveloped
Locations: 20,449
Midland: 6,916
Other: 750
Source: Company data and Enverus data as of 3/31/21.
Note: Permian Basin horizontal locations only, shown on a gross location basis. 1,943 vertical wells excluded. Other areas include Eastern Shelf, Western Delaware, and Central Basin Platform. Proved developed locations inclusive of PDP locations and completed locations.
(1) Calculated as 100% Net Royalty Acres divided by DSU Acres.
(2)
(3)
(4)
Net royalty acres defined as gross royalty acres (533,260) multiplied by the average royalty per acre (4.4%).
As of 3/31/21 per Enverus. DUCs considered to be all wells awaiting completion.
Gross undeveloped resource is based on average EUR for each sub-region multiplied by the total location count in the sub-region grossed up by weighted average lateral length for region compared to Enverus type curve, which is normalized to 7,500’ ft. well. Additional volumes from vertical wells not captured in gross undeveloped resource.
NYSE: TPL | 25Royalty Key Terms
Land and Resource Management
Implied Average Net Revenue
(1 )
Focus Area Gross Royalty Acres Net Royalty Acres Average Royalty Gross DSU Acres Interest per Well
Northern Delaware 1 55,364 9,206 5.9% 399,860 2.3%
Southeast Delaware 34,285 2,1 26 6.2% 1 01 ,993 2.1 %
Southwest Delaware 81 ,795 5,1 1 2 6.2% 1 68,459 3.0%
Delaware 271 ,444 1 6,444 6.1 % 670,31 2 2.4%
Midland 1 50,888 2,640 1 .7% 499,709 0.5%
Other 1 1 0,928 4,631 4.2% 258,61 7 1 .8%
Total 533,260 23,71 5 4.4% 1 ,428,638 1 .7%
Description How’s It Calculated
■ An undivided ownership of the oil, gas, and minerals underneath one acre ■ Total Texas Pacific Land Corporation acreage
Gross Royalty Acres of land 533,260
Net Royalty Acres ■ Gross Royalty Acres standardized to 12.5% (or 1/8) oil and gas lease royalty
■ Gross Royalty Acres * Avg. royalty / (1/8)
(Normalized to 1/8) 189,720 = 533,260 * 4.4% / (1/8)
■ Gross Royalty Acres standardized on a 100% (or 8/8) oil and gas lease ■ Gross Royalty Acres * Avg. royalty
Net Royalty Acres royalty basis 23,715 = 533,260 * 4.4%
■ Areas designated in a spacing order or unit designation as a unit and
Drilling Space Units within which operators drill wellbores to develop our oil and natural gas
■ Total number of gross DSU acres
(“DSUs”) rights 1,428,638
Implied Average Net ■ Number of 100% oil and gas lease royalty acres per gross DSU acre
■ Net Royalty Acres / Gross DSU Acres
Revenue Interest per Well 1.7% = 23,715 / 1,428,638
Source: Company data and Enverus data as of 3/31/21.
Note: Other areas include Eastern Shelf, Western Delaware, and Central Basin Platform.
(1) Excluding acres which are considered to be outside of Basin. NYSE: TPL | 26Historical Financial Summary
Year ended December 31, Three months ended,
($ in millions) 2019 2020 1Q20 4Q20 1Q21
Total Acres 901,787 880,523 902,513 880,523 880,523
Revenues:
Oil and gas royalties $154.7 $137.9 $42.4 $43.3 $49.5
Water sales and royalties 85.0 54.9 27.0 7.3 13.0
Produced water royalties 39.1 50.6 12.5 12.8 12.5
Easements and other surface-related income 76.3 41.4 13.8 9.3 9.0
Land sales 135.0 17.4 0.9 1.5 --
Other operating revenue 0.4 0.3 0.1 0.1 0.1
Total Revenues $490.5 $302.6 $96.6 $74.3 $84.2
Expenses:
Salaries and related employee expenses $35.0 $32.2 $10.6 $4.9 $10.0
Water service-related expenses 20.8 14.2 6.8 3.0 3.3
General and administrative expenses 9.6 9.8 3.0 2.5 2.8
Legal and professional fees 16.4 10.8 2.4 3.8 2.2
Land sales expenses 0.2 4.0 -- 1.2 --
Depreciation, depletion and amortization 8.9 14.4 3.3 3.6 3.8
Total operating expenses $90.9 $85.3 $26.1 $19.1 $22.1
Operating income (loss) $399.6 $217.3 $70.5 $55.2 $62.0
Margin (%) 81.5% 71.8% 73.0% 74.3% 73.7%
Other income, net 2.7 2.4 0.8 0.1 0.0
Income before income taxes $402.3 $219.7 $71.4 $55.3 $62.0
Income tax expense 83.6 43.6 14.0 10.5 12.0
Net income $318.7 $176.1 $57.4 $44.8 $50.1
Margin (%) 65.0% 58.2% 59.4% 60.3% 59.5%
Key balance sheet items: 2019 2020 1Q20 4Q20 1Q21
Cash and cash equivalents $303.6 $281.0 $223.7 $281.0 $310.7
Total debt -- -- -- -- --
Total equity 512.1 485.2 445.3 485.2 513.9
Total assets 598.2 571.6 544.6 571.6 613.8
Total liabilities 86.0 86.5 99.3 86.5 99.9
Source: Company data.
Note: Numbers may not foot due to immaterial rounding.
NYSE: TPL | 27Non-GAAP Reconciliations
Land and Resource Water Services and
Total
Management Operations
Year ended December 31, Three months ended, Three months ended,
($ in millions) 2015 2016 2017 2018 2019 2020 2Q20 3Q20 4Q20 1Q21 March 31, 2021 March 31, 2021 March 31, 2021
Net income $50.0 $42.3 $97.2 $209.7 $318.7 $176.1 $27.6 $46.3 $44.8 $50.1 $39.5 $10.5 $50.1
Adjustments:
Income taxes 25.2 20.6 47.8 52.0 83.6 43.6 7.3 11.8 10.5 12.0 9.0 2.9 12.0
Depreciation, depletion and amortization 0.0 0.0 0.4 2.6 8.9 14.4 3.7 3.8 3.6 3.8 0.5 3.3 3.8
EBITDA $75.3 $62.9 $145.4 $264.3 $411.2 $234.1 $38.6 $61.8 $59.0 $65.9 $49.0 $16.8 $65.9
Revenue $78.1 $66.1 $154.6 $300.2 $490.5 $302.6 $57.3 $74.4 $74.3 $84.2 $57.8 $26.4 $84.2
EBITDA Margin 96.4% 95.2% 94.0% 88.0% 83.8% 77.4% 67.4% 83.1% 79.3% 78.3% 84.9% 63.8% 78.3%
Adjusted EBITDA:
EBITDA $75.3 $62.9 $145.4 $264.3 $411.2 $234.1 $38.6 $61.8 $59.0 $65.9 $49.0 $16.8 $65.9
Other Adjustments:
Less: land sales deemed significant(1) (19.8) -- -- -- (122.0) -- -- -- -- -- -- -- --
Less: sale of oil and gas royalty interests(2) -- -- -- (18.9) -- -- -- -- -- -- -- -- --
Add: proxy contests, settlement, and corporate
-- -- -- -- 13.0 5.1 2.0 0.5 2.2 2.0 2.0 -- 2.0
reorganization costs(3)
Adjusted EBITDA $55.5 $62.9 $145.4 $245.4 $302.2 $239.1 $40.6 $62.3 $61.2 $67.9 $51.0 $16.8 $67.9
Adjusted Revenue(4) $58.3 $66.1 $154.6 $281.3 $368.5 $302.6 $57.3 $74.4 $74.3 $84.2 $57.8 $26.4 $84.2
Adjusted EBITDA Margin 95.2% 95.2% 94.0% 87.2% 82.0% 79.0% 70.9% 83.8% 82.3% 80.6% 88.3% 63.8% 80.6%
Source: Company data.
Note: Numbers may not foot due to immaterial rounding.
| 28
(1) Land swap of ~$22 million in 4Q19, and sale to WPX in 1Q19 of ~$100 million.
(2)
(3)
Sale of nonparticipating perpetual oil and gas royalty interest in approximately 812 net royalty acres (1/8th interest) of ~$19 million in 4Q19.
Costs related to proxy contest to elect a new Trustee, settlement agreement and corporate reorganization.
NYSE: TPL
(4) Excludes land sales deemed significant and sales of oil and gas royalty interests.Texas Pacific Land Corporation
1700 Pacific Avenue, Suite 2900
Dallas, Texas 75201You can also read