Recent variations in the terminus position, ice velocity and surface elevation of Langhovde Glacier, East Antarctica
←
→
Page content transcription
If your browser does not render page correctly, please read the page content below
Antarctic Science 26(6), 636–645 (2014) © Antarctic Science Ltd 2014. This is an Open
           Access article, distributed under the terms of the Creative Commons Attribution licence
           (http://creativecommons.org/licenses/by/3.0/), which permits unrestricted re-use,
           distribution, and reproduction in any medium, provided the original work is properly cited.                                    doi:10.1017/S0954102014000364

            Recent variations in the terminus position, ice velocity and surface
                     elevation of Langhovde Glacier, East Antarctica
                     TAKEHIRO FUKUDA1,2, SHIN SUGIYAMA1*, TAKANOBU SAWAGAKI3 and KAZUKI NAKAMURA4
                                            1
                                              Institute of Low Temperature Science, Hokkaido University, Sapporo 060-0819, Japan
                                      2
                                          Graduate School of Environmental Science, Hokkaido University, Sapporo 060-0810, Japan
                                          3
                                           Faculty of Environmental Earth Science, Hokkaido University, Sapporo 060-0810, Japan
                                                      4
                                                       College of Engineering, Nihon University, Koriyama 963-1165, Japan
                                                              *corresponding author: sugishin@lowtem.hokudai.ac.jp

                       Abstract: To improve the understanding of the mechanism driving recent changes in outlet glaciers in
                       East Antarctica, we measured changes in the terminus position, ice flow velocity and surface elevation of
                       the Langhovde Glacier located on the Sôya Coast. From satellite images from 2000–12 and field
                       measurements taken in 2012 the glacier terminus position and flow velocity showed little change between
                       2003 and 2007. After this quiescent period, the glacier progressively advanced by 380 m and the flow
                       velocity increased near the calving front by 10 m a-1 from 2007–10. No significant change was observed
                       in surface elevation during the study period. The changes in the terminus position and flow velocity
                       imply a reduction in the calving rate from 93 m a-1 (2003–07) to 16 m a-1 (2007–10). This suggests that
                       calving was inhibited by stable sea ice conditions in the ocean. Theses results indicate that the Langhovde
                       Glacier was in a relatively stable condition during the study period, and its terminus position was
                       controlled by the rate of calving under the influence of sea ice conditions.
                                                                    Received 16 September 2013, accepted 1 May 2014

                       Key words: calving, ice shelf, outlet glacier, satellite image, sea ice

           Introduction                                                                               improving our understanding of the contrasting mass
                                                                                                      balance trends in West and East Antarctica.
           Recent satellite observations have shown rapid changes of                                     Despite the multitude of studies based on large-scale
           the Antarctic ice sheet along coastal margins. Large ice                                   observations from satellites, there is a dearth of direct
           shelves are rapidly retreating (Fox & Vaughan 2005,                                        evidence of glacier change collected in the field. Field data
           MacGregor et al. 2012), fast flowing outlet glaciers and ice                                is needed to calibrate satellite observations, as well as to
           streams are both showing increasing flow velocity (Joughin                                  examine mechanisms driving the observed changes. Most
           et al. 2003, Lee et al. 2012) and ice is thinning on the                                   of the recent detailed research has focused on outlet
           accelerating glaciers (Shepherd et al. 2001, Scott et al. 2009,                            glaciers in West Antarctica (Scambos et al. 2004, Shuman
           Wingham et al. 2009). Acceleration and thinning of outlet                                  et al. 2011, Berthier et al. 2012). There are a number of
           glaciers are often associated with disintegration of ice shelves                           outlet glaciers along the coast of East Antarctica, but only
           in front of the glaciers (Rignot et al. 2004, Scambos et al.                               a few of them have been studied thus far (Stearns et al.
           2004, Joughin & Alley 2011). One possibility is that basal                                 2008, Yu et al. 2010, Callens et al. 2013, Miles et al. 2013).
           melting of ice shelves is increasing because of warming ocean                              Further studies are required to understand ongoing
           water (Pritchard et al. 2012), resulting in ice shelf                                      changes in East Antarctica and shed light on mechanisms
           disintegration and a consequent increase in ice velocity.                                  driving the mass balance trend in the Antarctic ice sheet.
           Such acceleration triggers thinning of outlet glaciers because                                The focus of this study was Langhovde Glacier, an
           an increasing amount of ice is discharged into the ocean.                                  outlet glacier flowing into an ice shelf on the Sôya Coast
              Such dynamically driven ice mass loss in outlet glaciers                                in East Antarctica. Data presented in this paper, mostly
           has been reported particularly in West Antarctica. As a                                    from the floating part of the glacier, combine satellite-
           consequence, mass balance of the West Antarctic Ice                                        based observations and field measurements to quantify
           Sheet was -102 ± 18 Gt a-1 between 2005–10, showing a                                      changes in the terminus position, flow velocity and
           more negative mass balance in recent years (Shepherd et al.                                surface elevation from 2000–12.
           2012 and references therein). On the other hand, the East
                                                                                                      Study site
           Antarctic Ice Sheet showed a positive mass balance of
           +58 ± 31 Gt a-1 during the same period (Shepherd et al. 2012).                             Langhovde Glacier (69°11'S, 39°32'E) (Fig. 1a) is located
           Monitoring fast flowing glaciers is a crucial aspect of                                     at the coast of Lützow-Holm Bay on the Sôya Coast

                                                                                               636

Downloaded from https://www.cambridge.org/core. IP address: 46.4.80.155, on 15 Jan 2021 at 23:14:37, subject to the Cambridge Core terms of use, available at https://www.cambridge.org/core/terms.
https://doi.org/10.1017/S0954102014000364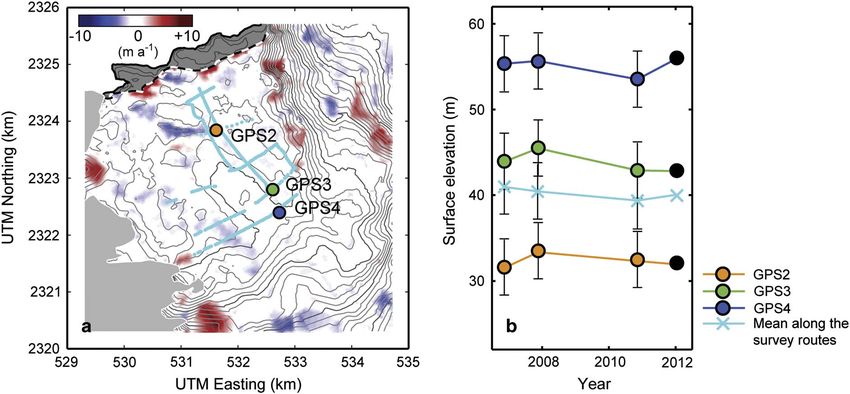
VARIATIONS OF THE LANGHOVDE GLACIER, EAST ANTARCTICA                                                                            637

                                                                                                   are limited (Nakawo et al. 1978, Iizuka et al. 2001,
                                                                                                   Nakamura et al. 2007). This study focused on Langhovde
                                                                                                   as the glacier is within the reach of helicopter operation
                                                                                                   from Syowa Station and the ice surface is relatively
                                                                                                   safe for fieldwork. Although the glacier is relatively
                                                                                                   small, it has the typical structure of an Antarctic outlet
                                                                                                   glacier.
                                                                                                      Langhovde Glacier is 3 km wide at the calving front
                                                                                                   and the fast flowing part is c. 10 km long (Fig. 1a). The ice
                                                                                                   surface is flat in the lower few kilometres, suggesting the
                                                                                                   formation of a floating tongue. The glacier is bound by
                                                                                                   relatively slowly moving ice to the east and bedrock to the
                                                                                                   west. The glacier flows faster than the surrounding ice
                                                                                                   and discharges ice into the ocean by calving. The
                                                                                                   glacier front is in contact with Antarctic Surface Water
                                                                                                   (Whitworth et al. 1998), which fills the upper layer in
                                                                                                   Lützow-Holm Bay (Ohshima et al. 1996). According to
                                                                                                   previous studies, Langhovde Glacier has been relatively
                                                                                                   stable over a period of decades to millennia. Miura et al.
                                                                                                   (1998) dated fossil shells from beach deposits at c. 3 km
                                                                                                   from the current glacier front, and concluded that this
                                                                                                   location had been ice free over the last 5000 years.
                                                                                                   Komazawa (2014) used aerial photographs and satellite
                                                                                                   images to analyse the frontal variations from 1975–2007
                                                                                                   and found only 400 m retreat during the period.
                                                                                                   Presumably the ice front position is controlled by the
                                                                                                   valley width, which spreads offshore from the current
                                                                                                   glacier front (Fig. 1a).

                                                                                                   Methods
                                                                                                   Satellite image analysis was performed for the glacier
                                                                                                   terminus position, flow velocity and surface elevation
                                                                                                   over the period between 2000–12. The lower 5 km of the
                                                                                                   glacier was analysed in 6 km × 6 km images cropped
                                                                                                   from several different types of satellite visible images.
                                                                                                   Field measurements of flow velocity and surface elevation
                                                                                                   were also made in the lower 3.5 km of the glacier from
        Fig. 1a. An ASTER-VNIR image from 29 December 2011,                                        January to February 2012 as a part of the 53rd JARE
          showing the Langhovde Glacier, with the inset showing the                                programme.
          study area within Antarctica. The glacier frontal margin is
          indicated by the red line. Changes in the area within the
          frontal margin and the black lines are measured to compute                               Terminus position
          mean terminus displacement. b. The glacier frontal margins                               Panchromatic band 8 images obtained by the Enhanced
          during 2000–11. c. Terminus displacement relative to the
                                                                                                   Thematic Mapper Plus (ETM+) mounted on Landsat 7,
          position on 15 January 2000. The data obtained from
                                                                                                   and visible and near-infrared (VNIR) band 3N images
          ASTER-VNIR and Landsat7/ETM+ are indicated by
          red and black crosses, respectively. Measurement error                                   obtained by the Advanced Spaceborne Thermal Emission
          is indicated by the width of the grey line connecting                                    and Reflection (ASTER) radiometer, were orthorectified
          the data.                                                                                and supplied by the US Geological Survey and by the
                                                                                                   Earth Remote Sensing Data Analysis Center in Japan,
                                                                                                   respectively. The spatial resolution of the images is 15 m.
        c. 20 km south of Syowa Station, a Japanese Antarctic                                      Specific dates and other satellite image information used
        Research Expedition (JARE) base. The Sôya coast region                                     are summarized in Table I.
        has been intensively studied by JARE for the past several                                     The glacier frontal margin was manually delineated
        decades, but glaciological studies in this coastal region                                  on each image using GIS software (ArcGIS10, ESRI).

Downloaded from https://www.cambridge.org/core. IP address: 46.4.80.155, on 15 Jan 2021 at 23:14:37, subject to the Cambridge Core terms of use, available at https://www.cambridge.org/core/terms.
https://doi.org/10.1017/S0954102014000364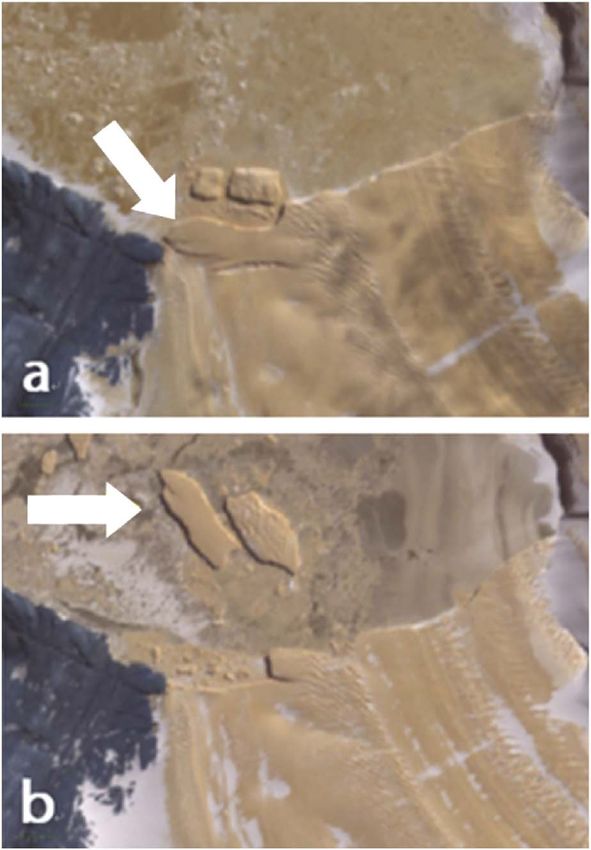
638 TAKEHIRO FUKUDA et al.
Table I. ETM+ and ASTER images used to measure terminus position.
Period Acquisition date
ETM+ (6 images) ASTER (57 images)
1999–00 15 Jan 2000
2000–01 9 Feb 2001 16 Dec 2000
2001–02 4 Jan 2002
2002–03 6 Dec, 22 Dec 2002 4 Nov 2002, 8 Feb, 26 Feb, 14 Mar 2003
2003–04 5 Nov, 2 Dec 2003
2004–05 29 Sep, 27 Nov 2004, 14 Jan, 26 Jan, 13 Feb, 24 Mar 2005
2005–06 14 Nov, 12 Dec 2005, 22 Jan, 11 Mar 2006
2006–07 23 Oct, 17 Nov, 17 Dec 2006, 4 Jan, 28 Feb, 25 Mar 2007
2007–08 18 Nov 2007 9 Nov, 13 Dec 2007, 23 Jan, 29 Feb, 2 Mar 2008
2008–09 8 Feb 2009 19 Sep, 10 Oct, 4 Nov, 24 Dec 2008, 6 Apr 2009
2009–10 2 Sep, 4 Oct, 31 Oct, 14 Nov, 2 Dec, 16 Dec 2009, 11 Feb, 7 Apr 2010
2010–11 7 Sep, 11 Oct, 12 Nov, 19 Dec 2010, 21 Feb, 10 Apr 2011
2011–12 10 Sep, 5 Oct, 30 Oct, 27 Nov, 29 Dec 2011, 7 Jan, 19 Feb, 13 Mar, 5 Apr 2012
By comparing the time series of satellite images, changes This provided horizontal components of the surface
in the glacier surface area near the calving front were displacement and the signal-to-noise ratio (SNR) for an
measured for each time interval (Fig. 1b). This aerial area of 6 km × 6 km near the glacier terminus with a
change was divided by the width of the calving front to spatial resolution of 15 m. The ASTER images were
obtain the mean displacement of the glacier front (Moon
& Joughin 2008). Potential errors in the measurement
include misalignment of satellite images and uncertainties
in the manual delineation process. Five ground control
points (GCPs) were used for each image pair to minimize
misalignment. Consequently, the root mean square error
of GCPs was 23 m. Uncertainties in the delineation were
evaluated by repeating the procedure for one of the
images. The standard deviation of the 20 measurements
was 2.4 m. Thus, the total error in this analysis is assumed
to be 25 m.
Flow velocity
Flow velocities from 2003–12 were measured by using a
feature tracking analysis of ASTER images. The same
image type was used as for the terminus position
measurements (VNIR, band 3N), orthorectified listed in
Table II. Displacements of ice surface features were
measured using COSI-Corr, software provided by
California Institute of Technology (a plug-in for a
remote-sensing platform ENVI (ESRI), a geospatial
imagery analysis and processing application). COSI-
Corr calculates horizontal displacements of surface
features by computing spatial correlations between a
multi-temporal image pair with sub-pixel resolution
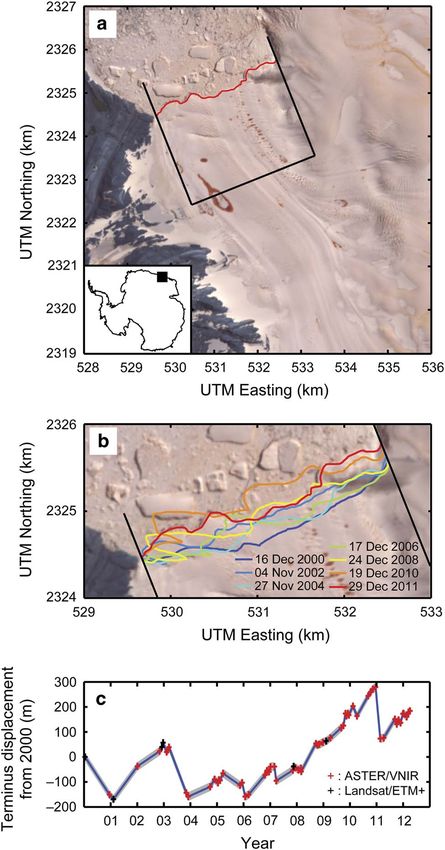
(Leprince et al. 2007, Scherler et al. 2008, Herman et al. Fig. 2a. Velocity vectors and horizontal velocity (colour scale)
between 5 January 2011 and 24 January 2012 obtained by
2011). Using 40 image pairs with intervals of c. 1 year
feature tracking analysis. Locations of ice velocity
between 2003–12 cross-correlation coefficients were
measurement sites (GPS1–4) and GPS reference station
computed with a reference window defined on the first (GPS Fix) are indicated. The background is an ASTER
image over a search window defined on the second image from 24 January 2012. b. Ice flow velocities at
image. The size of the reference window was GPS1–4 from 2003–12. The widths of the markers indicate
32 × 32–16 × 16 pixels depending on the magnitude of the period of COSI-Corr analysis. Data obtained by field
the displacement. GPS measurements are indicated with diamonds.
Downloaded from https://www.cambridge.org/core. IP address: 46.4.80.155, on 15 Jan 2021 at 23:14:37, subject to the Cambridge Core terms of use, available at https://www.cambridge.org/core/terms.
https://doi.org/10.1017/S0954102014000364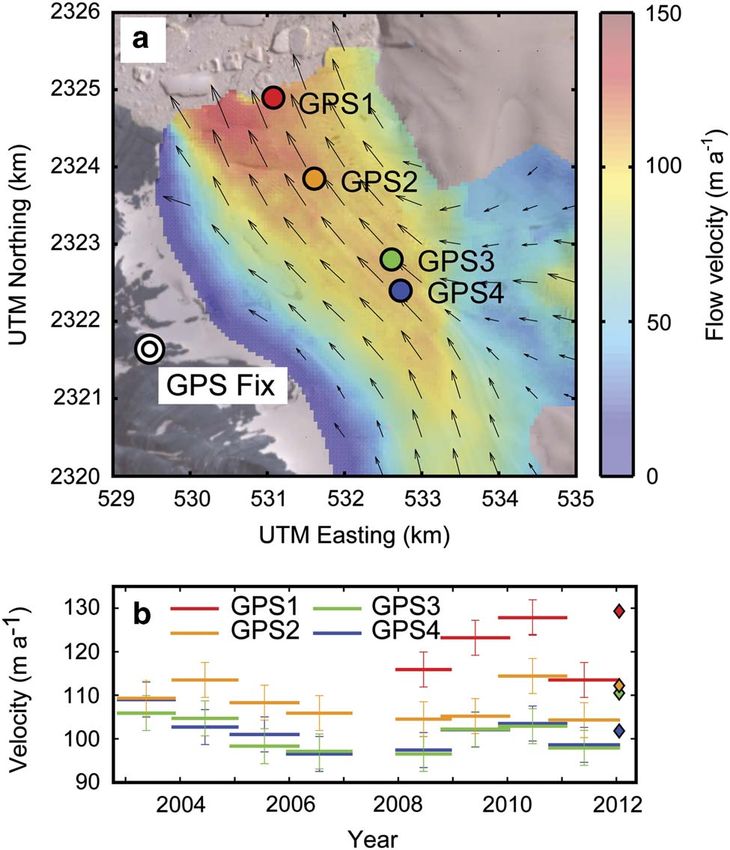
VARIATIONS OF THE LANGHOVDE GLACIER, EAST ANTARCTICA                                                                            639

        Table II. ASTER image pairs used for the velocity measurements.                            Table III. ALOS/PRISM stereo image pairs used for the DEM generation.
                                                                                                   B, N and F denote back, nadir and forward images.
        Period                               Acquisition date                    Interval
                                       Pre-image         Post-image               (days)           Acquisition date                                          Scene ID
        2002–03 to 2003–04            04 Nov 2002           05 Nov 2003             366            16 Nov 2006                       B, N                    ALPSMB043205070
                                      04 Nov 2002           02 Dec 2003             393                                                                      ALPSMN043205015
                                      14 Mar 2003           05 Nov 2003             236            29 Nov 2007                       B, N, F                 ALPSMB096885070
                                      14 Mar 2003           02 Dec 2003             263                                                                      ALPSMN096885015
        2003–04 to 2004–05            05 Nov 2003           27 Nov 2004             388                                                                      ALPSMF096884960
                                      05 Nov 2003           26 Jan 2005             448            10 Nov 2010                       B, N                    ALPSMB255445070
                                      02 Dec 2003           27 Nov 2004             361                                                                      ALPSMN255445015
                                      02 Dec 2003           26 Jan 2005             421
        2004–05 to 2005–06            27 Nov 2004           23 Dec 2005             391
                                      27 Nov 2004           11 Mar 2006             469
                                      26 Jan 2005           23 Dec 2005             331            November 2009), the standard error arising from the
                                      26 Jan 2005           11 Mar 2006             409
                                                                                                   cross-correlation analysis was determined to be 4.0 m.
        2005–06 to 2006–07            12 Dec 2005           17 Nov 2006             340
                                      12 Dec 2005           28 Feb 2007             443            The separation of image pairs used for the velocity
                                      11 Mar 2006           17 Nov 2006             251            measurements was 0.65–1.32 years. Thus, the uncertainty
                                      11 Mar 2006           28 Feb 2007             354            in the velocity was 3.0–6.2 m a-1.
        2006–07 to 2007–08            28 Feb 2007           23 Jan 2008             329               Ice surface velocity was measured in the field from 2–29
                                      28 Feb 2007           29 Feb 2008             366
                                                                                                   January 2012 by surveying aluminium poles installed on
        2007–08 to 2008–09            13 Dec 2007           10 Oct 2008             302
                                      23 Jan 2008           24 Dec 2008             336            the glacier 0.4–3.3 km from the terminus. To survey the
        2008–09 to 2009–10            10 Oct 2008           31 Oct 2009             386            positions of these poles, two types of dual-frequency GPS
                                      10 Oct 2008           16 Dec 2009             432            receivers were used: GEM-1 (GNSS Technologies) and
                                      24 Dec 2008           31 Oct 2009             311            System1200 (Leica Geosystems). The GPS antennae were
                                      24 Dec 2008           19 Jan 2010             391
                                                                                                   mounted on the top of the survey poles, which were
        2009–10 to 2010–11            31 Oct 2009           02 Oct 2010             336
                                      31 Oct 2009           19 Dec 2010             414            drilled > 1.0 m deep into the ice (Fig. 2a, GPS1–4).
                                      31 Oct 2009           05 Feb 2011             462            Another GPS antenna and receiver (GEM-1) was placed
                                      16 Dec 2009           02 Oct 2010             290            on bedrock to the west of the glacier (Fig. 2a, GPS Fix) to
                                      16 Dec 2009           19 Dec 2010             368            serve as a reference station. The distance from the
                                      16 Dec 2009           05 Feb 2011             416
                                                                                                   reference station to the survey poles was 3.1–3.6 km.
                                      19 Jan 2010           05 Feb 2011             382
        2010–11 to 2011–12            02 Oct 2010           05 Oct 2011             368            The GPS data were post-processed to compute the
                                      02 Oct 2010           27 Nov 2011             421            3D coordinates of the poles with a static positioning
                                      02 Oct 2010           25 Jan 2012             480            technique. The measurements were repeated on 5 and
                                      19 Dec 2010           29 Dec 2011             375            29 January 2012 to measure the displacement during this
                                      19 Dec 2010           07 Jan 2012             384
                                                                                                   period. The GPS positioning accuracy expected for the
                                      19 Dec 2010           25 Jan 2012             402
                                      05 Feb 2011           29 Dec 2011             327            baseline length was 5 mm. An error caused by the tilt of
                                      05 Feb 2011           07 Jan 2012             336            the survey poles was less than a few centimetres. Thus,
                                      05 Feb 2011           25 Jan 2012             354            the measurement error was < 0.05 m, which is equivalent
                                                                                                   to a velocity error of < 1.0 m a-1.

                                                                                                   Surface elevation
        orthorectified based on the digital elevation models
        (DEMs) supplied with the images, and the DEMs have                                         Glacier surface elevation was measured by stereographic
        relatively greater errors over a snow surface, low-contrast                                analysis of satellite images captured by the Panchromatic
        area and steep slopes. These errors in the DEM result                                      Remote-sensing Instrument for Stereo Mapping (PRISM) on
        in miscorrelations in the cross-correlation analysis.                                      the Advanced Land Observing Satellite (ALOS). The images
        To minimize errors due to miscorrelations, data with a                                     used for this study were taken on 16 November 2006,
        SNR > 0.90 were removed and a median filter was applied                                     29 November 2007 and 10 November 2010 (Table III).
        to the displacement field. Flow velocities at the GPS                                       The ALOS/PRISM images were radiometrically and
        measurement sites were computed by interpolating the                                       geometrically corrected (Level 1B2) and accompanied
        2D velocity fields.                                                                         with a rational polynomial coefficient file, which
           The accuracy of the velocity measurements were                                          described the parameters needed for converting the
        evaluated by computing the displacement between                                            image pixels to geographical coordinates. The resolution
        images separated by a short period, a so-called null test                                  of the image was 2.5 m.
        (Berthier et al. 2012). By processing two image pairs with                                    The stereographic analysis was performed with a digital
        an interval of 2 days (10–12 October 2008 and 14–16                                        photogrammetry system, consisting of a stereo mirror 3D

Downloaded from https://www.cambridge.org/core. IP address: 46.4.80.155, on 15 Jan 2021 at 23:14:37, subject to the Cambridge Core terms of use, available at https://www.cambridge.org/core/terms.
https://doi.org/10.1017/S0954102014000364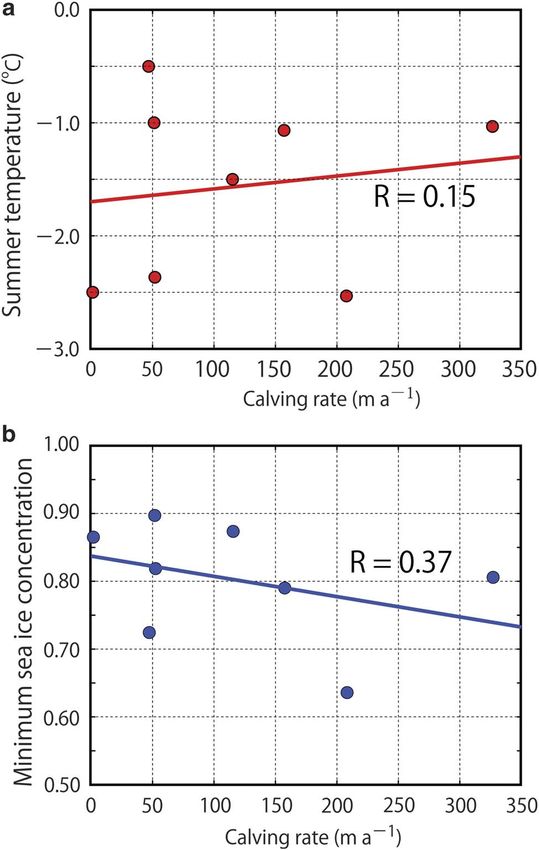
640                                                                  TAKEHIRO FUKUDA et al.

           Fig. 3a. Surface elevation change from 10 November 2006–17 November 2010. Elevation change is illustrated only on the glacier
             surface, and bedrock is indicated by grey. The cyan dots indicate the measurement points of GPS survey. The contour lines show
             surface elevation in 2010 with 10 m intervals. Dashed and solid lines indicate the terminus positions on 10 November 2006 and
             17 November 2010, respectively. b. Surface elevation at GPS2–4 and mean elevation along the GPS survey routes from 2006–12.
             Data obtained by DEMs and field GPS surveys are indicated by colour and black symbols, respectively.

           monitor (SD2020, Planar Systems), 3D mouse (TopoMouse,                                     the ice surface by hand to make a measurement for
           Leica Geosystems) and Leica Photogrammetric Suite 2011                                     15 seconds. We surveyed 382 locations over the region,
           (LPS) mounted on an ERDAS IMAGE 2011 platform                                              approximately every 100 m along seven survey routes
           (Intergraph Corporation). A stereographic image pair was                                   (Fig. 3a). The accuracy of the kinematic GPS positioning
           co-registered using one or more GCPs obtained from a                                       is c. 10 mm. By taking other error sources (e.g. tilt of the
           1:25 000 topographic map for JARE (Geographical                                            survey pole, surface micro roughness), the measurement
           Survey Institute, http://geogisopen.nipr.ac.jp/gisopen/).                                  error in the vertical direction was assumed to be < 0.1 m.
           The LPS automatically generates a polygonal surface                                        Since our study area is located mostly on floating ice,
           from a stereo image pair, but this surface has substantial                                 vertical ice motion due to tides has to be taken into
           errors, particularly in low contrast regions such as snow                                  account. According to our GPS measurements performed
           surfaces, shadows and steep slopes (Toutin 2002). To                                       in the field (Sugiyama et al. 2014), tidal motion is up to
           improve accuracy, the elevation was manually corrected                                     1.5 m at GPS1 and 0.5 m at GPS2. This uncertainty
           on the stereographic view using the 3D monitor and the 3D                                  progressively decreases up-glacier and is negligible at
           mouse. After this manual correction, a 10 m mesh DEM                                       GPS3 and GPS4.
           was generated by interpolating the polygonal surface
           (Lamsal et al. 2011). To estimate errors in the generated
           DEMs, the three DEMs were compared over a bedrock                                          Results
           area, where vertical displacement was assumed to be zero.
                                                                                                      Terminus position
           The mean standard deviation evaluated over a 1 km2
           bedrock surface was 3.2 m, similar to that reported in a                                   The glacier terminus advanced by 180 m from 2000–12
           previous study by Lamsal et al. (2011).                                                    after variations within a distance of 450 m (Fig. 1b & c).
              Glacier surface elevation was measured in the field                                      At the beginning of this period, the glacier showed a
           on 24 and 25 January 2012, using a kinematic GPS                                           sudden retreat of 170 m from 2000–01 and 180 m in 2003.
           positioning technique. Ice was exposed on the glacier                                      These sudden retreats coincided with large calving
           surface in the region of study during the survey period. In                                events which occurred after the summers of 2000–01 and
           this survey, the same reference station was employed as                                    2002–03. The exact timings of the events are not known as
           for the velocity measurement. The antenna of another                                       images are not available for the winter. After these two
           GPS (System1200) was mounted on top of a 2 m                                               events, the terminus advanced by 380 m from January
           long survey pole to record GPS signals every second as a                                   2007–January 2010. During this period, large icebergs
           rover station. The survey pole was held vertical to                                        were not observed in front of the glacier. Another calving

Downloaded from https://www.cambridge.org/core. IP address: 46.4.80.155, on 15 Jan 2021 at 23:14:37, subject to the Cambridge Core terms of use, available at https://www.cambridge.org/core/terms.
https://doi.org/10.1017/S0954102014000364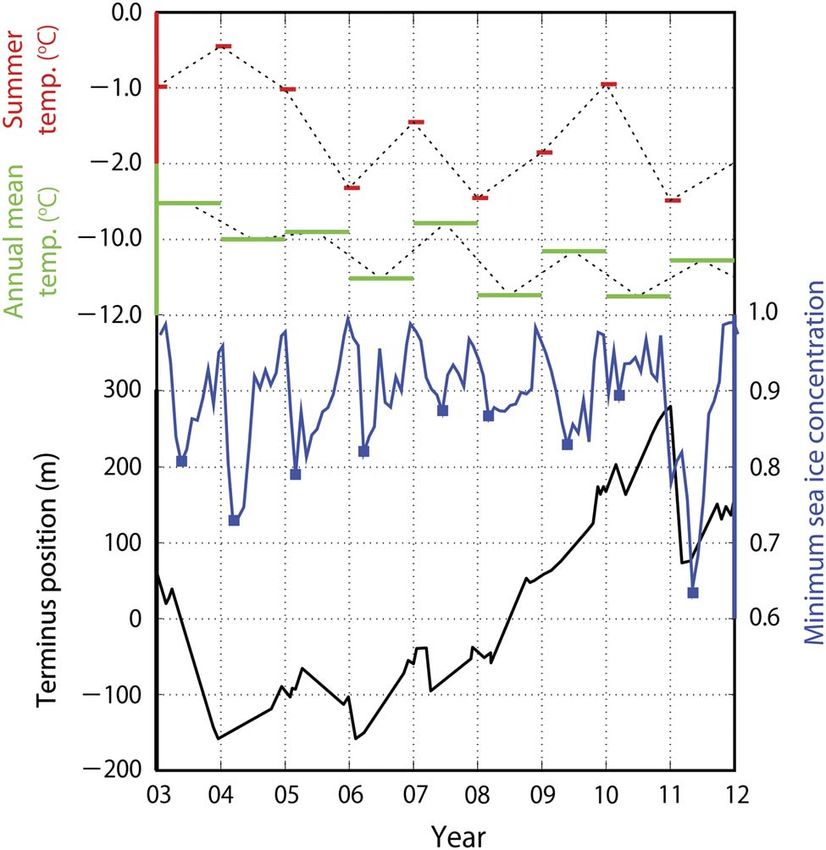
VARIATIONS OF THE LANGHOVDE GLACIER, EAST ANTARCTICA                                                                            641

                                                                                                   in the period from 2008–10. The velocity fell in 2011, but
                                                                                                   the velocity obtained by the field GPS measurement in
                                                                                                   January 2012 was greater than the long-term mean
                                                                                                   velocity from October 2010–February 2012. It should be
                                                                                                   noted that the field measurement represents the summer
                                                                                                   velocity, whereas the other satellite-derived data are
                                                                                                   mean velocity over c. 1 year. These changes were also
                                                                                                   observed at two other GPS sites. While the timings of the
                                                                                                   velocity changes were similar at the three locations, the
                                                                                                   acceleration in 2008–09 was initiated earlier near the
                                                                                                   terminus (GPS1) than in the upper reaches (GPS2–4).

                                                                                                   Surface elevation
                                                                                                   Changes in surface elevation were calculated by
                                                                                                   differentiation of DEMs. Glacier surface elevation
                                                                                                   showed little variation over the study period. The rate of
                                                                                                   surface elevation change in the study region was from
                                                                                                   +4.9–-8.8 m a-1 between 2006–10 (Fig. 3a). There were
                                                                                                   several regions where elevation change was greater than
                                                                                                   the vertical error of the DEMs (3.2 m). However, these
                                                                                                   changes were due to the advection of surface topographical
                                                                                                   features (e.g. crevasses, bumps and depressions) or snow
                                                                                                   deposition on a relatively steep surface. These surface
                                                                                                   features were observable on the satellite images, and also
                                                                                                   confirmed by in situ observations during the field campaign
                                                                                                   in 2011. There was no general trend in elevation change at
        Fig. 4. ASTER-VNIR images captured on a. 11 November                                       the three GPS sites or along the kinematic GPS survey
          2002 and b. 2 December 2003. Arrows indicate the same ice                                routes (Fig. 3b). The mean elevation change over the 382
          block before and after calving.                                                          survey locations along the survey routes was only -0.3 m a-1
                                                                                                   between 2006–12. The magnitudes of the elevation changes

        event occurred in January 2011, resulting in a 200 m
        retreat. According to the images over the study period,
        relatively large icebergs (400–500 m long) were detached
        from the western half of the calving front (Fig. 4), whereas
        smaller and more frequent calving events were observed
        in the eastern half. The mean rate of glacier advance over
        the period from 2000–12 was 15 m a-1.

        Flow velocity
        A 2D flow velocity field between 5 January 2011 and
        25 January 2012 is shown in Fig. 2a. The maximum
        velocity is 128 m a-1 observed at the glacier centre near the
        terminus. The velocity field showed a glacier flowing into
        the terminus region from the south and east. These two
        tributaries were merged in our study region. It showed
        that the velocity along the central flow-line was > 100 m a-1.
           Velocity was interpolated at the GPS measurement
                                                                                                   Fig. 5. Terminus displacement relative to 15 January 2000
        sites to investigate temporal variations from 2003–12                                        (black line with red dots), flow velocity at GPS1 (blue line),
        (Fig. 2b). The data show complex velocity variations over                                    mean surface elevation change along the GPS survey routes
        the study period, which were significantly greater than the                                   (green line) and calculated calving speed (yellow line) of
        measurement errors. At GPS2, velocity decreased from                                         Langhovde Glacier from 2003–12. Error ranges are
        2003–08 by 9.0 m a-1, followed by an increase of 9.9 m a-1                                   indicated by the grey bands.

Downloaded from https://www.cambridge.org/core. IP address: 46.4.80.155, on 15 Jan 2021 at 23:14:37, subject to the Cambridge Core terms of use, available at https://www.cambridge.org/core/terms.
https://doi.org/10.1017/S0954102014000364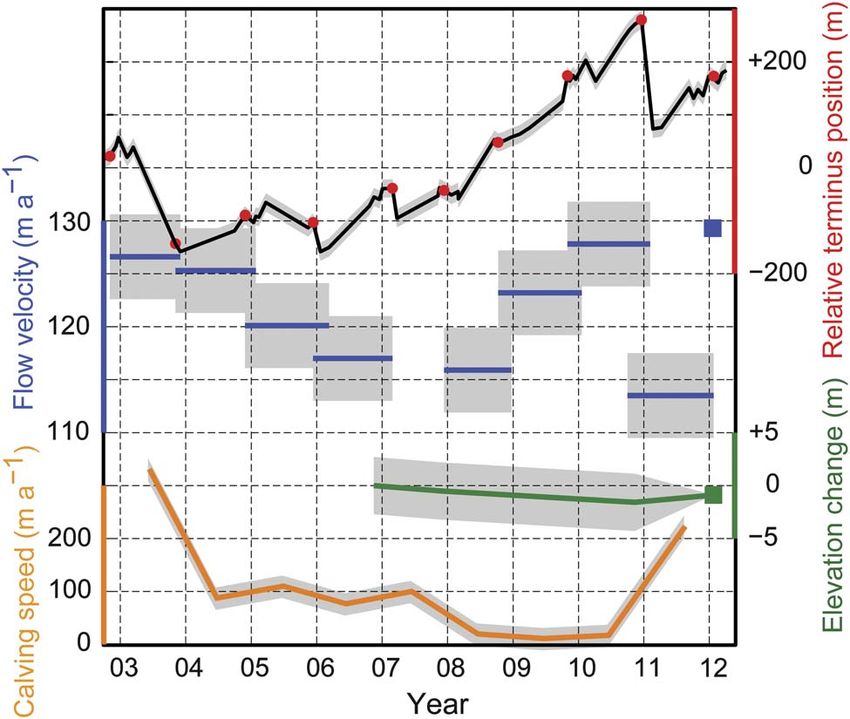
642                                                                  TAKEHIRO FUKUDA et al.

           Fig. 6. Variations in the terminus position (black), air
             temperatures at Syowa Station (green: annual mean, red:
             summer mean), and minimum sea ice concentration in
             Lützow-Holm Bay (blue).

           were smaller than the DEM error. Thus, the DEM
           analyses and GPS field survey show no significant
           elevation change in the survey area from 2006–12.

           Discussion
                                                                                                      Fig. 7. Scatter plots of a. the calving rate of Langhovde
                                                                                                        Glacier and summer mean air temperature at Syowa Station
           The changes in the terminus position, flow velocity                                           (correlation coefficient r = 0.15, P = 0.63) and b. the calving
           and surface elevation between 2003–12 are compared in                                        rate and minimum sea ice concentration in Lützow-Holm
           Fig. 5. In addition to this observational data, the calving                                  Bay (r = 0.37, P = 0.21).
           rate was calculated by subtracting the rate of the terminus
           displacement from the velocity near the glacier front.
           Two relatively large calving events occurred in 2003 and                                   The calving rate dropped in 2008, but annual mean air
           2011, resulting in significant retreats of the terminus                                     temperature showed no marked change. The temperature
           position. This observation indicates that the terminus                                     trend at Syowa Station from 2000–12 was -0.078°C a-1.
           position of Langhovde Glacier is primarily controlled by                                   Similarly, summer mean temperature (the average of
           sporadic large calving events, rather than changes in ice                                  monthly mean air temperatures in December, January
           velocity. The calving rate was relatively constant at                                      and February) showed a very slightly negative trend
           77–110 m a-1 (a mean of 93 m a-1) between 2004–07, and                                     (-0.020°C a-1). The correlation coefficient between the
           was reduced to 11–19 m a-1 (a mean of 16 m a-1) from                                       calving rate and the summer mean temperature was 0.15
           2008–10. Velocity increase was also observed from                                          (P = 0.63) (Fig. 7a). Thus, it seems unlikely that the
           2009–10. Thus, the progressive advance from 2007–11                                        calving rate of Langhovde Glacier is controlled by air
           was driven by a combination of ice velocity increase and                                   temperature in the region.
           calving rate reduction.                                                                       Sea ice conditions in the Lützow-Holm Bay, where
              The foregoing discussion demonstrates that the calving                                  Langhovde Glacier terminates, are possible drivers of the
           rate plays an important role in the frontal variations of                                  calving rate change. Ushio et al. (2006) reported relatively
           Langhovde Glacier. To investigate the control of the                                       unstable (thin and low concentration) sea ice cover
           calving rate variations, air temperature measured at                                       from the late 1990s to 2006. After this period, sea ice
           Syowa Station was compared with our data (Fig. 6).                                         disintegrated and flowed out from the bay in July 2006

Downloaded from https://www.cambridge.org/core. IP address: 46.4.80.155, on 15 Jan 2021 at 23:14:37, subject to the Cambridge Core terms of use, available at https://www.cambridge.org/core/terms.
https://doi.org/10.1017/S0954102014000364
VARIATIONS OF THE LANGHOVDE GLACIER, EAST ANTARCTICA 643
(Ushio 2010). After this opening of the bay, heavy snow individual glacier are needed to understand the precise
accumulation produced thick superimposed ice on newly drivers of variations in outlet glaciers.
formed sea ice, with the sea ice becoming thicker,
producing a stable condition (Ushio 2012). Recent
Conclusions
increase in snowfall in East Antarctica, especially in
Dronning Maud Land and Enderby Land, has also been In recent years, Antarctic ice sheet margins have been
reported (Boening et al. 2012). Thus, we hypothesize that rapidly changing. Notably, changes in the mass balance
this sea ice stabilized the glacier terminus, and inhibited of ice sheet and outlet glaciers, such as large scale calving,
the calving processes (Reeh et al. 2001). flow acceleration and ice thinning, have been observed
To investigate the influence of sea ice on the calving in West Antarctica. However, the mass balance of the
rate of Langhovde Glacier, the sea ice concentration in East Antarctic Ice Sheet has seen different patterns. While
the vicinity of the glacier terminus using satellite data West Antarctic outlet glaciers have reported significant
from 2000–12 was analysed. The Climate Data Record of change, there have been no such reports in East
Passive Microwave Sea Ice Concentration provided by Antarctica. The importance of detailed research in East
that National Oceanic and Atmospheric Administration’s Antarctica is becoming increasingly apparent. To have a
(NOAA) National Snow and Ice Data Center (http:// better understanding of the causes and mechanisms of
nsidc.org/data/seaice/pm.html) was used. Monthly mean change in outlet glaciers, we focused on the terminus
sea ice concentration at 14 measurement sites in Lützow- changes, ice thickness and velocity variations of
Holm Bay were analysed. The sea ice concentration Langhovde Glacier in East Antarctica.
generally increased from 2004–10 and suddenly dropped The surface elevation change from 2006–12 was
in 2011 (Fig. 6). The large calving events in 2004 and 2011 within 2.7 m. This small change in elevation indicates a
occurred during a period of low sea ice concentration. relatively stable condition during the study period, but
Since sea ice weakening during the summer period is most the terminus position showed interesting variations
relevant to calving, the analysis focused on annual within a limited distance. The terminus position showed
variations in the minimum sea ice concentration most complex variations under the influence of calving events
frequently recorded between January and March. The and ice velocity changes during the period. The glacier
correlation coefficient between the minimum sea ice progressively advanced by 380 m from 2007–10. Velocity
concentration and the calving rate from 2003–12 was gradually decreased from 2003–08, and then increased by
0.37 (P = 0.21) (Fig. 7b). This calculation shows a 9.9 m a-1 from 2008–10. It seems that the changes in the
relatively weak but significant positive correlation terminus position were influenced by flow velocity
between the sea ice concentration and calving, implying because these changes occurred during the same period.
that summer sea ice conditions in Lützow-Holm Bay play However, the observed advance was not due to a flow
a crucial role in the calving and frontal variations of velocity change, but influenced more by the reduction in
Langhovde Glacier. the calving rate in 2007.
Recent variations in outlet glaciers in East Antarctica Investigating the probable causes of the large calving
are reported further east from the study site. Miles et al. events, we compared the calving rate with air temperature
(2013) studied frontal variations of 175 glaciers in East and with the sea ice concentration in front of the glacier.
Antarctica along the coast at 90°–170°E. For the period There was no clear trend in the annual mean temperature
2000–10, the mean terminus displacement rate of the record during the study period, and thus no correlation
glaciers studied was -17.9 m a-1 with a median value of between the calving rate and the summer temperature. On
8.4 m a-1. The slight advance observed in Langhovde the other hand, the discharge of sea ice out of Lützow-
Glacier from 2000–12 gives a rate of 15 m a-1, which is Holm Bay in the summer of 2006 was related to the increase
similar to their median value. They argued that greater in the calving rate. Moreover, reduction in the calving rate
changes were observed in larger and faster flowing in 2008–11 coincided with the formation of thick sea ice
glaciers, which may explain the relatively stable caused by heavy snowfall during this period. This data
behaviour of Langhovde Glacier. They also pointed out suggests that the calving rate of Langhovde Glacier is
the importance of sea ice conditions on the variations of affected by sea ice conditions. Thinning or thickening of sea
outlet glaciers in East Antarctica (Miles et al. 2013). The ice in front of outlet glaciers has the potential to drive rapid
influence of sea ice on glacier variation has also been advancement and retreat of glacier fronts.
reported by Frezzotti & Polizzi (2002). Thus, our data
provides support to these studies in East Antarctica. As
Acknowledgements
seen in previous studies, outlet glaciers behave differently
depending on their size, flow rate and other geometrical This research was carried out as a part of the JARE53
conditions (e.g. constraint of the terminus by fjord walls, programme. We thank the members of JARE53 and 52
length of floating extension). Detailed studies on each for their help in the field. The field activity was financially
Downloaded from https://www.cambridge.org/core. IP address: 46.4.80.155, on 15 Jan 2021 at 23:14:37, subject to the Cambridge Core terms of use, available at https://www.cambridge.org/core/terms.
https://doi.org/10.1017/S0954102014000364644 TAKEHIRO FUKUDA et al.
supported by the National Institute of Polar Research, MACGREGOR, J.A., CATANIA, G.A., MARKOWSKI, M.S. & ANDREWS, A.G.
and the research project was funded by JSPS KAKENHI 2012. Widespread rifting and retreat of ice–shelf margins in the
Grant Number 23651002 (2011–14). We used ASTER eastern Amundsen Sea embayment between 1972 and 2011. Journal of
Glaciology, 58, 458–466.
data β processed by AIST GEO Grid, using ASTER data MILES, B.W.J., STOKES, C.R., VIELI, A. & COX, N.J. 2013. Rapid,
owned by METI and NASA. We thank D. White and climate-driven changes in outlet glaciers on the Pacific coast of East
C. Stokes for providing insightful comments, and the Antarctica. Nature, 500, 563–566.
Scientific Editor R. Bingham for handling the paper. MIURA, H., MORIWAKI, K., MAEMOKU, H. & HIRAKAWA, K. 1998.
Fluctuations of the East Antarctic ice-sheet margin since the last
glaciation from the stratigraphy of raised beach deposits along the
Sôya Coast. Annals of Glaciology, 27, 297–301.
Author contributions
MOON, T. & JOUGHIN, I. 2008. Changes in ice front position on
T.F. and S.S. designed the research and wrote the manuscript. Greenland’s outlet glaciers from 1992 to 2007. Journal of Geophysical
Research - Earth Surface, 113, 10.1029/2007JF000927.
T.F., T.S. and K.N. analysed satellite images. T.F.,
NAKAMURA, K., DOI, K. & SHIBUYA, K. 2007. Estimation of seasonal
S.S. and T.S. performed field measurements. All authors changes in the flow of Shirase Glacier using JERS-1/SAR image
discussed the results and commented on the manuscript. correlation. Polar Science, 1, 73–83.
NAKAWO, M., AGETA, U. & YOSHIMURA, A. 1978. Discharge of ice across
the Sôya Coast. Memoirs of National Institute of Polar Research -
References Special Issue, 7, 235–244.
OHSHIMA, K.I., TAKIZAWA, T., USHIO, S. & KAWAMURA, T. 1996.
BERTHIER, E., SCAMBOS, T.A. & SHUMAN, C.A. 2012. Mass loss of
Larsen B tributary glaciers (Antarctic Peninsula) unabated since 2002. Seasonal variations of the Antarctic coastal ocean in the vicinity of
Geophysical Research Letters, 39, 10.1029/2012GL051755. Lützow-Holm Bay. Journal of Geophysical Research - Oceans, 101,
BOENING, C., LEBSOCK, M., LANDERER, F. & STEPHENS, G. 2012. 20 617–20 628.
Snowfall-driven mass change on the East Antarctic Ice Sheet. PRITCHARD, H.D., LIGTENBERG, S.R.M., FRICKER, H.A., VAUGHAN, D.G.,
VAN DEN BROEKE, M.R. & PADMAN, L. 2012. Antarctic ice-
Geophysical Research Letters, 39, 10.1029/2012GL053316.
CALLENS, D., MATSUOKA, K., STEINHAGE, D., SMITH, B. & PATTYN, F. sheet loss driven by basal melting of ice shelves. Nature, 484,
2013. Transition of flow regime along a marine-terminating outlet 502–505.
glacier in East Antarctica. The Cryosphere Discussion, 7, 4913–4936. REEH, N., THOMSEN, H.H., HIGGINS, A.K. & WEIDICK, A. 2001. Sea ice
FOX, A.J. & VAUGHAN, D.G. 2005. The retreat of Jones Ice Shelf, and the stability of north and northeast Greenland floating glaciers.
Antarctic Peninsula. Journal of Glaciology, 51, 555–560. Annals of Glaciology, 33, 474–480.
FREZZOTTI, M. & POLIZZI, M. 2002. 50 years of ice-front changes between RIGNOT, E., CASASSA, G., GOGINENI, P., KRABILL, W., RIVERA, A. &
the Adélie and Banzare coasts, East Antarctica. Annals of Glaciology, THOMAS, R. 2004. Accelerated ice discharge from the Antarctic
34, 235–240. Peninsula following the collapse of Larsen B ice shelf. Geophysical
HERMAN, F., ANDERSON, B. & LEPRINCE, S. 2011. Mountain glacier Research Letters, 31, 10.1029/2004GL020697.
velocity variation during a retreat/advance cycle quantified using SCAMBOS, T.A., BOHLANDER, J.A., SHUMAN, C.A. & SKVARCA, P. 2004.
sub-pixel analysis of ASTER images. Journal of Glaciology, 57, Glacier acceleration and thinning after ice shelf collapse in the
197–207. Larsen B embayment, Antarctica. Geophysical Research Letters, 31,
IIZUKA, Y., SATAKE, H., SHIRAIWA, T. & NARUSE, R. 2001. Formation 10.1029/2004GL020670.
processes of basal ice at Hamna Glacier, Sôya Coast, East Antarctica, SCHERLER, D., LEPRINCE, S. & STRECKER, M.R. 2008. Glacier-surface
inferred by detailed co-isotopic analyses. Journal of Glaciology, 47, velocities in alpine terrain from optical satellite imagery: accuracy
223–231. improvement and quality assessment. Remote Sensing of Environment,
JOUGHIN, I., RIGNOT, E., ROSANOVA, C.E., LUCCHITTA, B.K. & 112, 3806–3819.
BOHLANDER, J. 2003. Timing of recent accelerations of Pine Island SCOTT, J.B.T., GUDMUNDSSON, G.H., SMITH, A.M., BINGHAM, R.G.,
Glacier, Antarctica. Geophysical Research Letters, 30, 10.1029/ PRITCHARD, H.D. & VAUGHAN, D.G. 2009. Increased rate of
2003GL017609. acceleration on Pine Island Glacier strongly coupled to changes in
JOUGHIN, I. & ALLEY, R.B. 2011. Stability of the West Antarctic Ice gravitational driving stress. Cryosphere, 3, 125–131.
Sheet in a warming world. Nature Geoscience, 4, 506–513. SHEPHERD, A., WINGHAM, D.J., MANSLEY, J.A.D. & CORR, H.F.J. 2001.
KOMAZAWA, K. 2014. Compilation of aerial photographs and measurement Inland thinning of Pine Island Glacier, West Antarctica. Science, 291,
of ice sheet elevation change using stereo pair images along the Sôya 862–864.
Coast, East Antarctica. MSc thesis, Graduate School of Environmental SHEPHERD, A., IVINS, E.R., GERUO, A. & 43 OTHERS. 2012. A reconciled
Science, Hokkaido University, 102 pp [in Japanese]. [Unpublished]. estimate of ice-sheet mass balance. Science, 338, 1183–1189.
LAMSAL, D., SAWAGAKI, T. & WATANABE, T. 2011. Digital terrain SHUMAN, C.A., BERTHIER, E. & SCAMBOS, T.A. 2011. 2001–2009
modelling using Corona and ALOS PRISM data to investigate the elevation and mass losses in the Larsen A and B embayments,
distal part of Imja Glacier, Khumbu Himal, Nepal. Journal of Antarctic Peninsula. Journal of Glaciology, 57, 737–754.
Mountain Science, 8, 390–402. STEARNS, L.A., SMITH, B.E. & HAMILTON, G.S. 2008. Increased flow
LEE, H., SHUM, C.K., HOWAT, I.M., MONAGHAN, A., AHN, Y., DUAN, J.B., speed on a large East Antarctic outlet glacier caused by
GUO, J.Y., KUO, C.Y. & WANG, L. 2012. Continuously accelerating ice subglacial floods. Nature Geoscience, 1, 827–831.
loss over Amundsen Sea catchment, West Antarctica, revealed by SUGIYAMA, S., SAWAGAKI, T., FUKUDA, T. & AOKI, S. 2014. Active
integrating altimetry and GRACE data. Earth and Planetary Science water exchange and life near the grounding line of an Antarctic
Letters, 321, 74–80. outlet glacier. Earth and Planetary Science Letters, 399, 10.1016/j.
LEPRINCE, S., BARBOT, S., AYOUB, F. & AVOUAC, J.P. 2007. Automatic espl.2014.05.001.
and precise orthorectification, coregistration, and subpixel correlation TOUTIN, T. 2002. Three-dimensional topographic mapping with ASTER
of satellite images, application to ground deformation measurements. stereo data in rugged topography. IEEE Transactions on Geoscience
IEEE Transactions on Geoscience and Remote Sensing, 45, 1529–1558. and Remote Sensing, 40, 2241–2247.
Downloaded from https://www.cambridge.org/core. IP address: 46.4.80.155, on 15 Jan 2021 at 23:14:37, subject to the Cambridge Core terms of use, available at https://www.cambridge.org/core/terms.
https://doi.org/10.1017/S0954102014000364VARIATIONS OF THE LANGHOVDE GLACIER, EAST ANTARCTICA 645
USHIO, S., WAKABAYASHI, H. & NISHIO, F. 2006. Sea ice variation in WHITWORTH, T., ORSI, A.H., KIM, S.J., NOWLIN, W.D. & LOCARNINI, R.A.
Lützow–Holmbukta, Antarctica, during the last fifty years. Journal of 1998. Water masses and mixing near the Antarctic Slope Front.
the Japanese Society of Snow and Ice, 68, 299–305 [in Japanese with Antarctic Research Series, 75, 1–28.
English abstract]. WINGHAM, D.J., WALLIS, D.W. & SHEPHERD, A. 2009. Spatial and
USHIO, S. 2010. Land-fast ice variation in Lützow–Holm Bay, temporal evolution of Pine Island Glacier thinning, 1995–2006.
Antarctica, during the past eight decades. Summaries of JSSI & Geophysical Research Letters, 36, 10.1029/2009GL039126.
JSSE Joint Conference on Snow and Ice Research, 2010, B3–15, YU, J.Y., LIU, H.X., JEZEK, K.C., WARNER, R.C. & WEN, J.H. 2010.
209. Analysis of velocity field, mass balance, and basal melt of the Lambert
USHIO, S. 2012. Sea ice condition in Lützow-Holm Bay, Antarctica, in Glacier – Amery Ice Shelf system by incorporating Radarsat SAR
the austral summer of 2011/12. Summaries of JSSI & JSSE Joint interferometry and ICESat laser altimetry measurements. Journal of
Conference on Snow and Ice Research, 2012, C3–1, 72. Geophysical Research - Solid Earth, 115, 10.1029/2010JB007456.
Downloaded from https://www.cambridge.org/core. IP address: 46.4.80.155, on 15 Jan 2021 at 23:14:37, subject to the Cambridge Core terms of use, available at https://www.cambridge.org/core/terms.
https://doi.org/10.1017/S0954102014000364You can also read