Presentation on Far East Hospitality Trust - August 2020

Page created by Irene Gutierrez
 
CONTINUE READING
Presentation on Far East Hospitality Trust - August 2020
Presentation on
Far East Hospitality Trust
August 2020
Presentation on Far East Hospitality Trust - August 2020
Important Notice

Information contained in this presentation is intended solely for your personal reference and is strictly confidential. The information and opinions in this presentation are subject to change without notice, its accuracy
is not guaranteed and it may not contain all material information concerning Far East Hospitality Trust (the “Trust”), a stapled group comprising Far East Hospitality Real Estate Investment Trust and Far East
Hospitality Business Trust. Neither FEO Hospitality Asset Management Pte. Ltd. (the “Manager”), FEO Hospitality Trust Management Pte. Ltd. (the “Trustee-Manager”, and together with the Manager, the
“Managers”), the Trust nor any of their respective affiliates, advisors and representatives make any representation regarding, and assumes no responsibility or liability whatsoever (in negligence or otherwise) for, the
accuracy or completeness of, or any errors or omissions in, any information contained herein nor for any loss howsoever arising from any use of these materials. By attending or viewing all or part of this
presentation, you are agreeing to maintain confidentiality regarding the information disclosed in this presentation and to be bound by the restrictions set out below. Any failure to comply with these restrictions may
constitute a violation of applicable securities laws.

The information contained in these materials has not been independently verified. No representation or warranty, expressed or implied, is made as to, and no reliance should be placed on, the fairness, accuracy,
completeness or correctness of, the information or opinions contained herein. None of the Trust, the Managers, DBS Trustee Limited (as trustee of Far East Hospitality Real Estate Investment Trust), Far East
Organization, controlling persons or affiliates, nor any of their respective directors, officers, partners, employees, agents, advisers or representatives shall have any liability whatsoever (in negligence or otherwise)
for any loss howsoever arising, whether directly or indirectly, from any use, reliance or distribution of this presentation or its contents or otherwise arising in connection with this presentation. It is not the intention to
provide, and you may not rely on these materials as providing a complete or comprehensive analysis of the Trust's financial or trading position or prospects. The information and opinions contained in these materials
are provided as at the date of this presentation and are subject to change without notice. Nothing contained herein or therein is, or shall be relied upon as, a promise or representation, whether as to the past or the
future and no reliance, in whole or in part, should be placed on the fairness, accuracy, completeness or correctness of the information contained herein. Further, nothing in this document should be construed as
constituting legal, business, tax or financial advice. None of the Joint Bookrunners or their subsidiaries or affiliates has independently verified, approved or endorsed the material herein.

Nothing in this presentation constitutes an offer of securities for sale in Singapore, United States or any other jurisdiction where it is unlawful to do so.

The information in this presentation may not be forwarded or distributed to any other person and may not be reproduced in any manner whatsoever. Any forwarding, distribution or reproduction of this information in
whole or in part is unauthorised. Failure to comply with this directive may result in a violation of the Securities Act or the applicable laws of other jurisdictions.

This presentation contains forward-looking statements that may be identified by their use of words like “plans,” “expects,” “will,” “anticipates,” “believes,” “intends,” “depends,” “projects,” “estimates” or other words of
similar meaning and that involve assumptions, risks and uncertainties. All statements that address expectations or projections about the future and all statements other than statements of historical facts included in
this presentation, including, but not limited to, statements about the strategy for growth, product development, market position, expenditures, and financial results, are forward-looking statements. Such forward-
looking statements are based on certain assumptions and expectations of future events regarding the Trust's present and future business strategies and the environment in which the Trust will operate, and must be
read together with those assumptions. The Managers do not guarantee that these assumptions and expectations are accurate or will be realized. Actual future performance, outcomes and results may differ
materially from those expressed in forward-looking statements as a result of a number of risks, uncertainties and assumptions. Although the Managers believe that such forward-looking statements are based on
reasonable assumptions, it can give no assurance that such expectations will be met. Representative examples of these risks, uncertainties and assumptions include (without limitation) general industry and
economic conditions, interest rate trends, cost of capital and capital availability, competition from other companies, shifts in customer demands, customers and partners, changes in operating expenses including
employee wages, benefits and training, governmental and public policy changes and the continued availability of financing in the amounts and the terms necessary to support future business. Predictions, projections
or forecasts of the economy or economic trends of the markets are not necessarily indicative of the future or likely performance of the Trust. Past performance is not necessarily indicative of future performance. The
forecast financial performance of the Trust is not guaranteed. You are cautioned not to place undue reliance on these forward-looking statements, which are based on the Managers’ current view of future events.
The Managers do not assume any responsibility to amend, modify or revise any forward-looking statements, on the basis of any subsequent developments, information or events, or otherwise.

This presentation is for information purposes only and does not constitute or form part of an offer, solicitation or invitation of any offer, to buy or subscribe for any securities, nor should it or any part of it form the basis
of, or be relied in any connection with, any contract or commitment whatsoever. Any decision to invest in any securities issued by the Trust or its affiliates should be made solely on the basis of information contained
in the prospectus to be registered with the Monetary Authority of Singapore (the “MAS”) after seeking appropriate professional advice, and you should not rely on any information other than that contained in the
prospectus to be registered with the MAS.

These materials may not be taken or transmitted into the United States, Canada or Japan and are not for distribution, directly or indirectly, in or into the United States, Canada or Japan.

These materials are not an offer of securities for sale into the United States, Canada or Japan. The securities have not been and will not be registered under the Securities Act and, subject to certain exceptions, may
not be offered or sold within the United States. The securities are being offered and sold outside of the United States in reliance on Regulation S under the United States Securities Act of 1933, as amended. There
will be no public offer of securities in the United States and the Managers do not intend to register any part of the proposed offering in the United States.

This presentation has not been and will not be registered as a prospectus with the MAS under the Securities and Futures Act, Chapter 289 of Singapore and accordingly, this document may not be distributed, either
directly or indirectly, to the public or any member of the public in Singapore.

                                                                                                                                                                                                                                       2
Presentation on Far East Hospitality Trust - August 2020
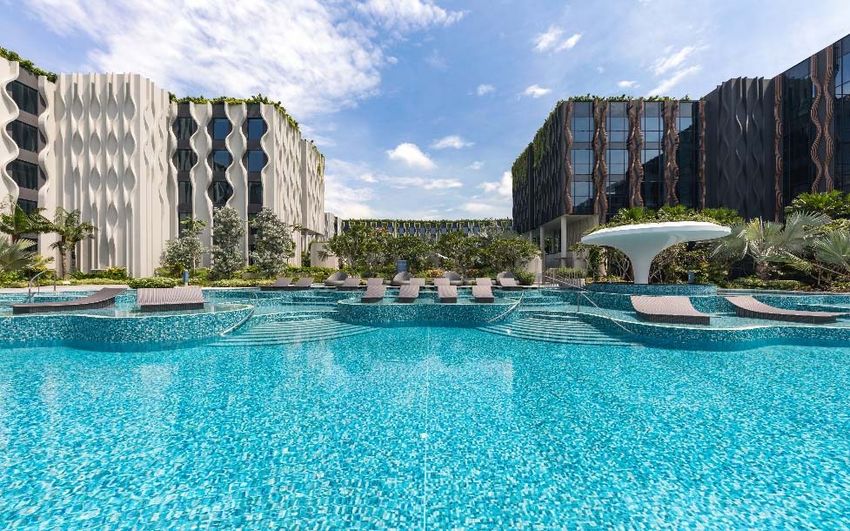
Overview of Far East Hospitality Trust

                                         3
Presentation on Far East Hospitality Trust - August 2020
Overview of Far East H-Trust

                                                                                      Public                              Far East
  Issuer                Far East Hospitality Trust
                                                                                          39.0%                                 61.0%

  Sponsor               Far East Organization group of companies
                                                                                                        Far East
                                                                                                        H-Trust
                                                                                                                                 Business
  REIT Manager          FEO Hospitality Asset Management Pte. Ltd.        REIT                                                     Trust2

                                                                            REIT             Far East          Far East       Trustee-
                        13 properties valued at approximately              Manager           H-REIT             H-BT          Manager
                        S$2.65 billion1
  Portfolio
                        9 hotel properties (“Hotels”) and 4 serviced
                        residences (“SR” or “Serviced Residences”)                                                    REIT
                                                                                      Hotel          SR
                                                                                                                   Commercial
                                                                                     Portfolio     Portfolio
  Hotel and SR                                                                                                      Premises
                        Far East Hospitality Management (S) Pte Ltd
  Operator

  Retail & Office                                                                       Master Lessees
  Space Property        Jones Lang LaSalle Property Consultants Pte Ltd
  Manager

                        Sponsor companies, part of the Far East                        Hotel & Serviced        Retail & Office
  Master Lessees                                                                         Residence             Space Property
                        Organization group of companies
                                                                                          Operator                Manager

  (1) As at 31 December 2019
  (2) Dormant at Listing Date and master lessee of last resort
                                                                                                                                            4
Presentation on Far East Hospitality Trust - August 2020
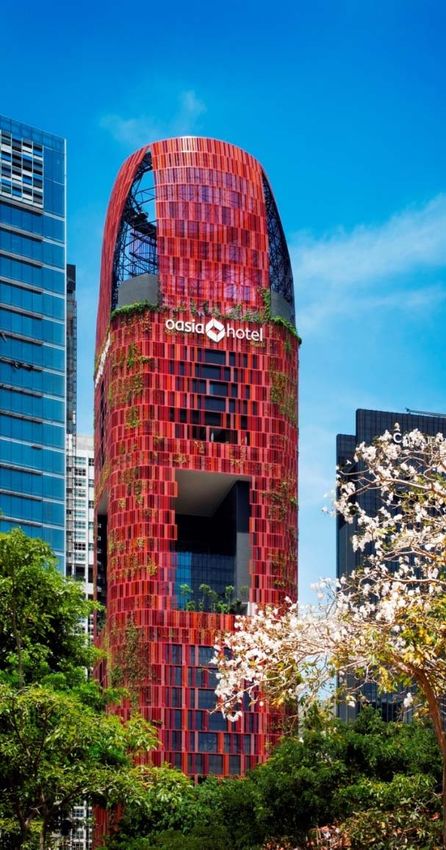
Key Terms of Master Lease Agreements for Hospitality Portfolio

 Tenure                                20 years with the option to renew for an additional 20 years

                                       Fixed Rent = Total of S$67 million per annum
                                        (S$57 million for Hotels, S$10 million for Serviced Residences)
 Composition of Master
 Lease Rental                          Variable Rent = (33% x GOR1) + (30%3 x GOP2) - Fixed Rent

                                       Downside protection with upside potential

 Furniture, fixtures and
                                       2.5% of GOR
 equipment reserve

 Master Lessees                        Sponsor companies, part of the Far East Organization group of companies

 (1)   GOR refers to the Gross Operating Revenue of the Property.
 (2)   GOP refers to the Gross Operating Profit of the Property.
 (3)   Average for the whole portfolio; actual percentage for each property ranges from 23% to 37% for Hotels, and 38% to 41% for Serviced
       Residences.

                                                                                                                                             5
Presentation on Far East Hospitality Trust - August 2020
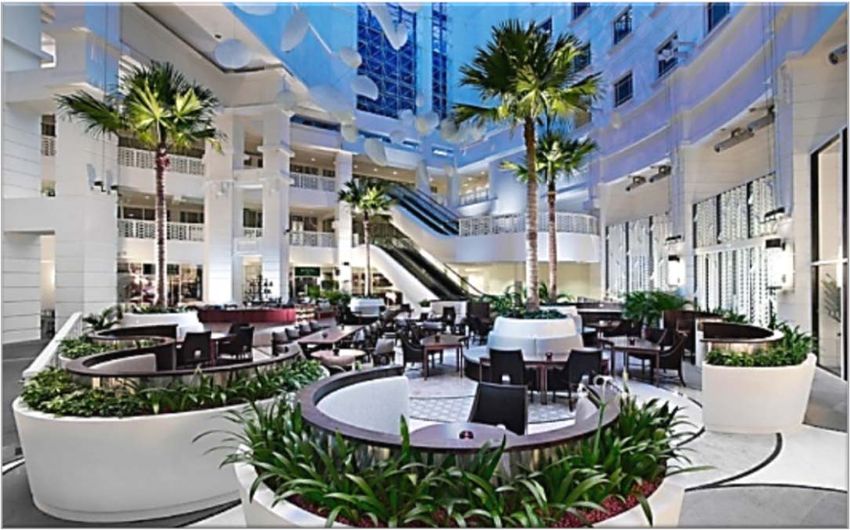
Master Lease Structure for Hospitality Portfolio

 Breakdown of Revenue (FY2019)

                   Rental Revenue for
          19%      Commercial
                   premises                    Fixed rent makes up large
                                                 proportion of revenue
          23%      Variable Rent for           Fixed rent for hotels and
                   Hotels & Serviced            serviced residences and rental
                   Residences                   revenue for commercial
                                                premises constitute about three
                                                quarters of gross revenue.
                   Fixed Rent for Hotels
                   & Serviced                  The minimum rental payment
                   Residences                   provides a downside protection
          58%                                   for unitholders and mitigates the
                                                impact of volatility experienced
                                                during adverse economic
                                                circumstances.

                                                                                    6
Presentation on Far East Hospitality Trust - August 2020
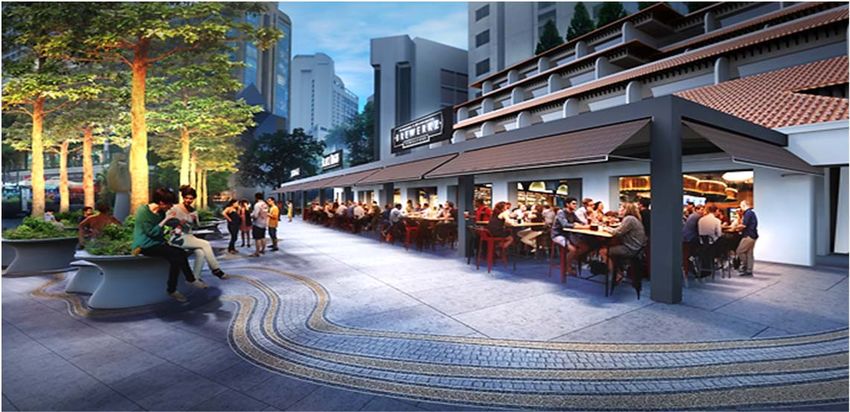
Financial Highlights
Presentation on Far East Hospitality Trust - August 2020
Executive Summary for 1H 2020 – Performance vs LY

                                                                 1H 2020            1H 2019             Variance

                                                                  S$’000             S$’000                %

   Gross Revenue                                                  44,270             55,725              (20.6)

   Net Property Income                                            38,604             50,186              (23.1)

   Income Available for Distribution                              25,689             34,966              (26.5)

   Income Available for Distribution after retention              20,171             34,966              (42.3)

   Distribution per Stapled Security (“DPS”) after retention
                                                                   1.03                1.82              (43.4)
   (cents)

   •   Gross Revenue for 1H 2020 was S$44.3 million, a decrease of 20.6% year-on-year, due to the negative impact
       of the COVID-19 pandemic. Retail and Office Revenue decreased by 12.5% year-on-year.

   •   Net Property Income was 23.1% lower year-on-year.

   •   REIT Manager’s fees was lower by 20.5% year-on-year mainly due to changes resulting from a review of the
       management fee structure.

   •   Income Available for Distribution was S$25.7 million, 26.5% lower year-on-year, translating into 1.29 Singapore
       cents or 29.1% lower year-on-year.

   •   Given the ongoing uncertainties due to the COVID-19 pandemic, part of the distributable amount was
       retained. DPS after retention was 1.03 Singapore cents or 43.4% lower year-on-year. Far East H-Trust intends
       to maintain its policy of distributing at least 90% of the REIT's taxable income.                                 8
Presentation on Far East Hospitality Trust - August 2020
Portfolio Performance 1H 2020 – Hotels

            Average Occupancy                          Average Daily Rate (ADR)                  Revenue Per Available Room
                                                                                                         (RevPAR)
  %                                             $                                       $

100           88.7    -11.1pp                200                                      200
                              77.6                        156       -34.7%
80                                           160                                      160           138      -42.9%

60                                           120                           102        120
                                                                                                                      79
40                                            80                                       80

20                                            40                                       40

  0                                            0                                        0
          1H 2019        1H 2020                      1H 2019         1H 2020                   1H 2019         1H 2020

      •    Average occupancy of the hotels suffered in the initial phase of the COVID-19 pandemic but picked up in subsequent
           months as the hotels secured business from companies that required their Malaysian workers to stay in Singapore and
           from government agencies for isolation purposes. Average occupancy of 77.6% for 1H 2020 was 11.1pp below same
           time last year.

      •    ADR decreased 34.7% to S$102 as travel restrictions curtailed traditional sources of business for the hotels, and the
           need to secure lower-rated business opportunities available during this period.

      •    As a result, RevPAR for the hotel portfolio declined by 42.9% to S$79.
                                                                                                                                   9
Presentation on Far East Hospitality Trust - August 2020
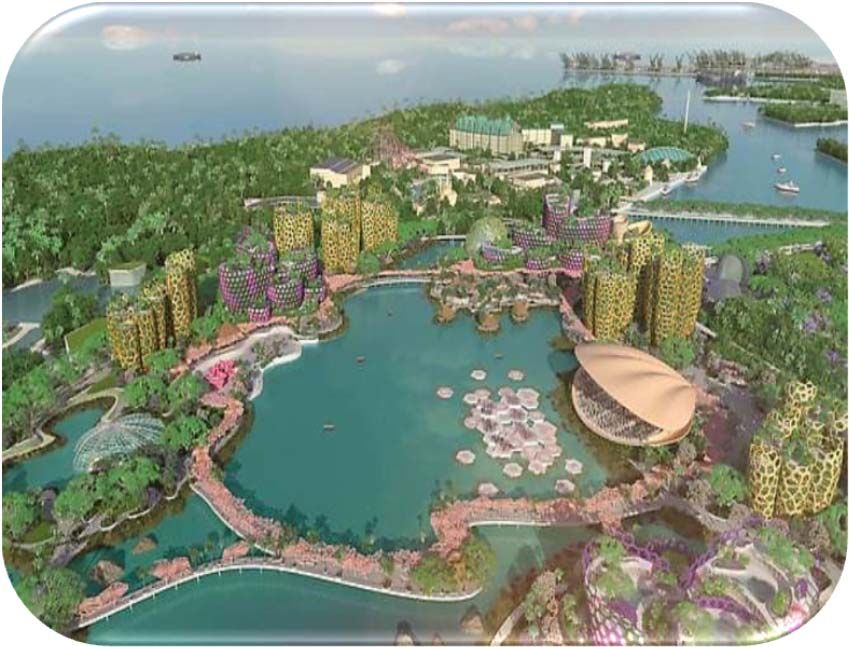
Portfolio Performance 1H 2020 – Serviced Residences

              Average Occupancy                        Average Daily Rate (ADR)                  Revenue Per Available Unit
                                                                                                        (RevPAU)
    %                  1.7pp                                         -6.6%
                                                  $                                          $
 100.0                                                        214                                              -4.7%
                81.0            82.7            240                          200           240
                                                                                                       174          166
  80.0                                          200                                        200

                                                160                                        160
  60.0
                                                120                                        120
  40.0
                                                 80                                        80
  20.0
                                                 40                                        40

   0.0                                            0                                         0
             1H 2019       1H 2020                       1H 2019        1H 2020                    1H 2019      1H 2020

         •    While the serviced residences registered a decline in performance in 1H 2020 due to the challenging market
              circumstances and lack of inbound travel, the long leases from corporate sources helped to boost occupancy and
              minimize the negative impact.

         •    Average occupancy was higher year-on-year by 1.7pp at 82.7%, although the ADR was 6.6% lower at S$200.

         •    As a result, the RevPAU of the SR portfolio fell 4.7% to S$166 in 1H 2020.

                                                                                                                               10
Breakdown of Gross Revenue – Total Portfolio

  1H 2019                                1H 2020
                            Serviced
                                                                    Serviced
                            Residences
                                                           14.0%    Residences
                    11.5%

            68.8%
                    19.7%                          64.4%    21.6%
  Hotels
                        Commercial       Hotels                     Commercial

                                                                          11
Capital Management
 As at 30 June 2020                                                                                          Debt Maturity Profile (figures in S$million)
                                                                                                                       225                                                225
 Total debt                                            S$990.8m                                                                         210

                                                                                                                                                         161                               157
 Available revolving facility                          S$287.1m

 Gearing ratio                                             39.2%
                                                                                                       13

 Unencumbered asset                                                                                 2020             2021             2022             2023             2024             2025
                                                           100%
 as % total asset
                                                                                                                                  Interest Rate Profile

 Proportion of fixed rate                                  60.3%                                                                                                                    Floating
                                                                                                                                                            39.7%
                                                                                                  Fixed                                                                             S$393.6m
 Weighted average debt                                                                            S$597.2m
                                                        2.8 years                                                                   60.3%
 maturity

 Average cost of debt                                       2.5%
                                                                                • In October 2019, a 2-year S$100.0 million term loan due to mature in April 2020 was extended to
                                                                                  a 2.5-year S$60.0 million term loan and 5-year S$40.0 million term loan ahead of its maturity.
 Interest coverage ratio1                                   2.7x                  There are no other term loans maturing this year. The weighted average debt-to-maturity was
                                                                                  2.8 years taking into account the extended tenor.

 1 Interest coverage ratio is calculated by dividing the trailing 12 months earnings before interest, tax, depreciation and amortisation (excluding effects of any fair value changes of derivatives

 and investment properties, and foreign exchange translation), by the trailing 12 months interest expense and borrowing-related fees per the formula prescribed by paragraph 1.2(f), Appendix 6
 of the Code on Collective Investment Schemes.                                                                                                                                                         12
Proactive Initiatives
Asset Enhancement Initiatives

 1. Renovation of The Elizabeth Hotel
    Artist impression of the reception area

                                              Proposed Scope:

                                                 Lobby and reception area
                                                 Main lift lobby and circulation areas
                                                 All-day dining outlet
                                                 Function rooms
                                                 156 Superior & Deluxe rooms
                                                 100 Premier rooms
                                                 Guestroom floor lift lobbies and corridors

                                                                                               14
Asset Enhancement Initiatives
2. Upgrading of the outdoor refreshment area at The Orchard Rendezvous Hotel
   Artist impression

                                                 Proposed Scope:

                                                      Floor and wall finishes
                                                      New canopy system
                                                      Landscape enhancement
                                                      New finishes to the forecourt

3. Building repainting of Rendezvous Hotel Singapore
  Artist impression

                                                  Proposed Scope:

                                                      Podium block - different paint colours for
                                                       the walls, pillars and decorative corbels
                                                      Tower block - single paint colours and
                                                       darker tone for grooves

                                                                                                    15
Covid19 Guest Handling Protocols

           All hotels have been certified           Guestroom Protocols
           under the SG Clean scheme                • Rooms are fully disinfected after
           • Certification audited by                 each departure
             independent assessors and              • Single-use amenities are provided in
             reflects the stringent sanitization      every room
             and hygiene measures

          Flexible reservation and                 F&B and Dining Protocol
          cancellation policies                    • Physical distancing is enforced for
          • Help guests plan their travel with       dine-in at restaurants
            confidence                             • Alternative breakfast options
          • Reservations can be changed or
            cancelled with no charge

                                                    Social Distancing Measures
           Safety Measures on Property
                                                    • Queue markers placed at
           • Scanning of entry and exit with
                                                      appropriate areas
             SafeEntry
                                                    • Lift capacity is monitored and lift
           • Temperature screening for all
                                                      flooring is demarcated
             guests

           Cleaning & Sanitizing                    Meeting & Events Protocols
           • Use of hospital-grade solutions for    • Capacity and seating of event
             cleaning and sanitization                venues reduced
           • Increased frequency of deep            • Increased frequency of air filter
             cleaning                                 replacement and Air Handling Unit
                                                      (AHU) cleaning

                                                                                             16
Cost Containment Initiatives & Savings

Proactive Cost Containment Initiatives

    Notwithstanding unavoidable fixed costs, the Operator has made concerted efforts to reduce costs across all
    hotel departments relative to approved budgets. Key examples are provided below:

         •   Hiring pause across all departments, reduction of overtime and freeze on all casual labor

         •   Clearance of carried over and annual leave by all staff

         •   50% reduction in Advertising & Promotion spend

         •   50% reduction in outsourced public area cleaning costs with this function moved inhouse

         •   Temporary discontinuation of ancillary third-party contracts

         •   Deferment of certain engineering expenses to 2021 and insourcing of repairs and maintenance

         •   30% reduction in total hotel expenditure

                                                                                                                  17
Cost containment at the REIT

   Reduction in management fees (with effect from 1 January 2020)

                                  Change                                            Illustration on FY2019 fee

    Base fee is reduced from 0.3% to 0.28% per annum of the                 Reduction would have been
    value of the deposited property of Far East H-REIT.                     approximately S$0.54 million or 6.7%

    Performance fee is reduced from 4.0% of the net property
    income to 4.0% of the net property income or 4.0% of the                Reduction would have been
    annual distributable amount for that financial year,                    approximately S$1.2 million or 28.8%
    whichever is lower.

       For illustrative purposes, the overall Management Fees for FY2019 would have been lower by S$1.74 million or
        14.2% based on the above changes.

       The REIT Manager will also be undertaking cost-cutting measures, with the savings going towards funding the fee
        reduction.

                                                                                                                          18
Growth Strategy
Key Engines of Growth

 A                                   B                                    C
                                            Executing Asset
     Driving Organic Growth              Enhancement Initiatives                 Growing the Portfolio

   Optimising the performance        Implementing refurbishment             Acquiring completed
    of hospitality assets              programmes to refresh and               Sponsor ROFR properties
                                       upgrade the properties
   Growing contribution from                                                 Seeking suitable 3rd party
    commercial spaces                 Optimizing plant and                    acquisitions
                                       equipment for greater
                                 +     energy efficiency and cost        +
                                       savings

                        Key initiatives to drive both immediate and long-term growth
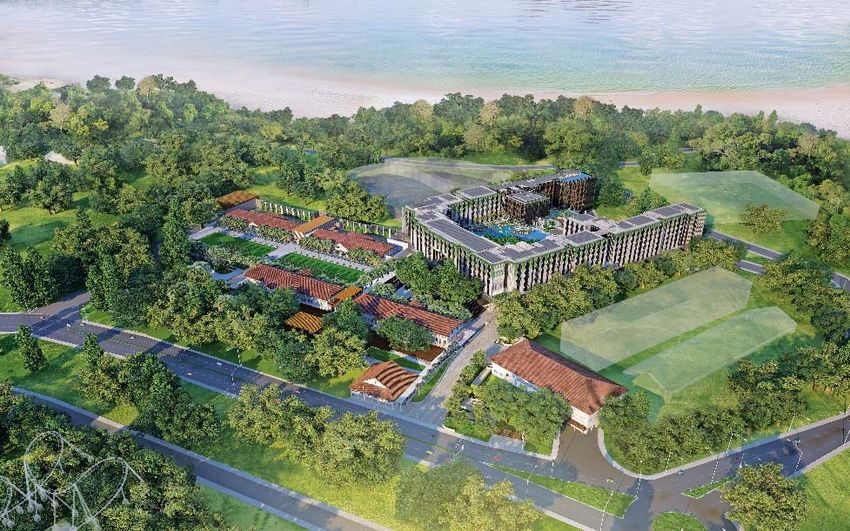
                                                                    20
Acquisition of Rendezvous Hotel Singapore – Completed August 2013

                                         298-room upscale hotel strategically
                                          located near the business and
                                          cultural districts

                                         Purchase price of S$264.3 million, or
                                          S$886,913 per key

                                         Retail Net Floor Area of 2,799 sqm
      Rendezvous Hotel Singapore
                                         70 year-lease commencing from
                                          completion date of 1 August 2013

                                         Master lessee is Serene Land Pte Ltd

                                         Term of master lease is 20 years plus
                                          an option to renew for another 20
                                          years

      Courtyard area
                                                                                  21
Acquisition of Oasia Hotel Downtown – Completed on 2 April 2018

                                                                                                                                                     314-room upscale hotel located at
                                                                                                                                                      100 Peck Seah Street, in the Tanjong
                                                                                                                                                      Pagar area of Singapore’s CBD

                                                                                                                                                     Purchase price of S$210.0 million1 or
                                                                                                                                                      S$668,789 per key

                                                                                                                                                     Valued at S$245.0 million as at 31
                                                              Infinity Pool                                                                           December 2019

                                                                                                                                                     65 year-lease commencing from
                                                                                                                                                      completion date of 2 April 20182

                                                                                                                                                     Vendor and master lessee is Far East
                                                                                                                                                      SOHO Pte. Ltd.

 Oasia Hotel Downtown                                         Deluxe room

      1 The Vendor and the REIT Trustee had entered into an Earn-out Agreement, in which the REIT Trustee will issue S$15.0 million worth of Stapled Securities to the Vendor if, by 31 December 2023 (or up to 31

      December 2025 if there are any Extension Events as defined in the Earn-out Agreement), the net property income (“NPI”) of the Property is at least S$9.9 million per annum for two full consecutive years.

      2 The Vendor owns a leasehold interest of 99 years commencing from 13 April 2011. As the leasehold tenure in the Property to be acquired by the REIT Trustee is in respect of a shorter leasehold period than the

      length of the leasehold title held by the Vendor, upon expiry of the leasehold tenure held by the REIT Trustee, the title to the Property will revert back to the Vendor.                                           22
Hotel Development on Sentosa with Sponsor

      In September 2014, Far East H-REIT took up a 30% stake in a joint venture with Far East Organization Centre Pte.
       Ltd. (a member of Far East Organization)

      Integrated development comprising 3 hotels and 839 rooms – Village Hotel Sentosa, The Outpost Hotel and
       The Barracks Hotel

      60-year leasehold interest from 7 March 2014

      Far East H-REIT’s agreed proportion of investment is approx S$133.1 million (of a total estimated cost of S$443.8
       million)

      Far East H-REIT is entitled to purchase remaining 70% of the development should a sale be contemplated by the
       Sponsor

                                                                                                                           23
Potential Pipeline Projects from the Sponsor
            1 Orchard Scotts Residences                         2    Orchard Parksuites                                       Village Residence
                                                                                                                  3                                                          4            AMOY Hotel
                                                                                                                                  West Coast

                    Number of Units: 204                            Number of Units: 223                                    Number of Units: 51                                    Number of Rooms: 37
                                                                                                                                                                                                         Expected         Est. No of
                                                                                                                                                                         Name of ROFR Property         Completion Date   Rooms / Units
                                                                                                                                                                 Completed
                                                                                                                                                             1   Orchard Scotts Residences               Completed           204
                                                                                                                                                             2   Orchard Parksuites                      Completed           223
                                                                                                                                                             3   Village Residence West Coast            Completed            51
            Completed                                                                                                                                            AMOY Hotel                              Completed            37
                                                                                                                                                             4
                                                                                                                      1,818               4,961
            Under Development                                                                                                                                5   Oasia West Residences                   Completed           140
                                                                                                                      57.8%
            Central Region                                                                                                                                   6   Village Hotel Sentosa, The Outpost
                                                                                                                                                                                                         Completed           839
                                                                                                                      growth                                     Hotel and The Barracks Hotel
                                                                                                 3,143
                                                                                                                                                                 Completed Subtotal                                          1,494
                                                                                                                                                                 Under Development
                                   5 3                      1                                                                                                7   The Clan                                   2020             324
                                                        2                                                                                                        Under Development Subtotal                                  324
                                                            4                                                                                                    Total
                                                                7
                                                                                                                                                         3
                                                                                                                                                                 Hotel Rooms                                                 1,200
                                                    6                                        Existing Portfolio   ROFR Properties   Enlarged Portfolio           Serviced Residence Units                                     618
                                                                                                                                                                 Grand Total                                                 1,818
                                                                                            Village Hotel, The Outpost Hotel
                                      5      Oasia West Residences1                     6                                                                    7               The Clan1
                                                                                                 and The Barracks Hotel1

                                              Number of Units: 140                             Number of Rooms: 839                                               Number of Rooms: 324

  (1) This picture is an artist’s impression of the property and may differ from the actual view of the property                                                                                                                         24
Industry Outlook & Prospects
Historical and Forecasted Visitor Arrivals in Singapore

                                                                                                                                                           Visitor arrival numbers are
                                                                                                                                                                             in millions.

                                                                                                                                                                    19.1
                                                                                                                                                             18.5 (+3.3%)
                                                                                                                                                      17.4 (+6.2%)
                                                                                                                                               16.4 (+6.2%)               13.4 to
                                                    Sub-Prime Crisis                                                           15.1    15.2  (+7.7%)                        14.3
                                                                                                                      15.6   (-3.0%) (+0.9%)                             (-25% to
post-Sep 11 and SARS                                                                                       14.5                                                            -30%)
                                                                                                13.2
                                                                                      11.6
                                             9.8        10.3      10.1       9.7
                                   8.9
                        8.3
 7.6
             6.1

 2002       2003      2004       2005       2006      2007       2008      2009       2010      2011       2012       2013   2014    2015   2016    2017     2018      2019    2020E

             Visitor arrivals to Singapore showed healthy year-on-year growth in the period from 2016 to 2018, with an average growth
              of 6.7% per year. Comparatively, in 2019, year-on-year growth was lower at 3.3%, with a total of 19.1 million visitors for the
              year, amidst global headwinds and macroeconomic uncertainty.
              In view of the COVID-19 outbreak, STB forecasted arrivals to drop by 25% to 30% in 2020.

            Sources : Singapore Tourism Board (STB) International Visitor Arrivals, reported as at 11 February 2020                                                                    26
Estimated Hotel Room Supply in Singapore

                                                                                                           789          717
                                                                                               1,284
                                                                           2,665      702                (+1.2%)      (+1.0%)
                                                                                              (+1.9%)
                                                                 2,559    (+4.2%)   (+1.1%)
                                                       4,266    (+4.2%)
                                       2,010          (+7.5%)                                                                     New
                      3,230           (+3.7%)                                                                                     Supply
                     (+6.2%)                                                                                                      Existing
                                                                                                                                  Supply

                      2013             2014              2015    2016      2017      2018     2019         2020        2021
                                                                                                        (projected) (projected)

               New hotel room supply registered a more moderate increase of 1.9% in 2019, as compared to a compound
                annual growth of 5.1% between 2013 to 2017. Supply is expected to increase by 1.2% in 2020 and 1.0% in 2021.

               Since July 2014, the government had placed a moratorium on the release of new sites for hotel
                development, until January 2019, when the tender for the site at Club Street was awarded.

   Sources: Savills report and Far East H-Trust’s compilation
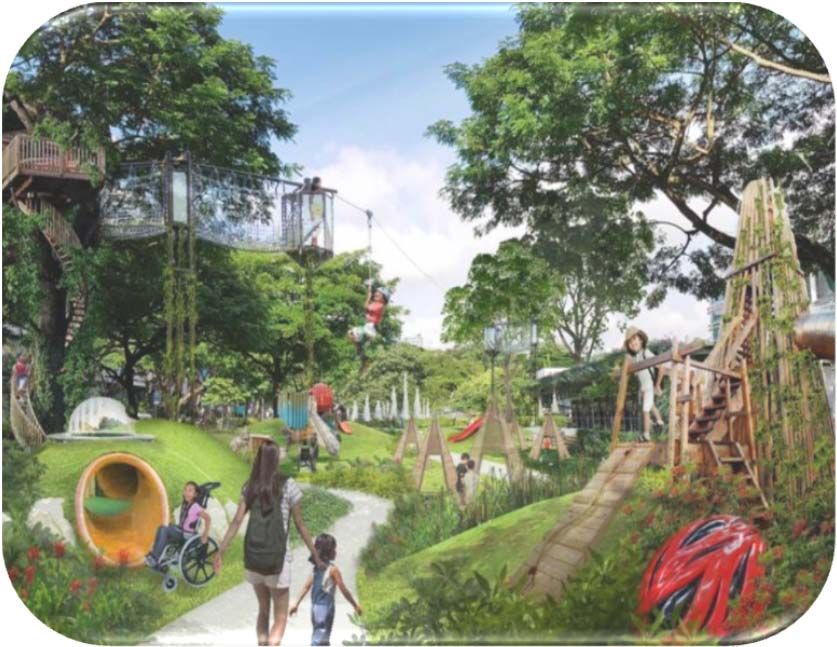
                                                                                                                                             27
Transformation of Tourism Landscape in the coming years

     Sentosa-Brani                                                                              Revamp of
       Masterplan                                                                            Orchard Road
     Pulau Brani and                                                                         The Singapore
      Sentosa will be                                                                           government
    redeveloped and                                                                       announced plans to
   integrated, and the                                                                        transform the
    entire area would                                                                      Orchard Road belt
  include new leisure,                                                                         into a vibrant
recreation and tourism                                                                        family-friendly
    offerings. The first                                                                  lifestyle destination
     phase (“Sentosa                                                                       and garden oasis,
    Sensoryscape”) is                                                                      offering more than
slated for completion in                                                                         just retail.
           2022*.
                                                                                          Mandai Makeover
 Jurong Lake District
                                                                                                (2023*)
       tourism hub
                                                                                           Eco-tourism hub
New integrated tourism
                                                                                               with eco-
 development to be set
                                                                                          accommodation at
 up at the Jurong Lake
                                                                                            Mandai nature
District by 2026*, in line
                                                                                               precinct,
 with the government’s
                                                                                           integrating new
 plan to spread out its
                                                                                           attractions (Bird
     offerings across
                                                                                           Park, Rainforest
     different parts of
                                                                                            Park) with the
  Singapore. This area
                                                                                           Singapore Zoo,
 will include attractions,
                                                                                            Night Safari &
hotels and other lifestyle
                                                                                             River Safari
          offerings

          *Opening/Completion dates may be subject to change
          Images from Channelnewsasia, JLD.com, Today Online, The Straits Times, TNP.sg                  28
Far East Hospitality Trust – Trading Performance

                                                           $0.78
                                                       (17 Jan 2020)

                                                                                $0.49
                                                                            (4 Aug 2020)

                                                             Source : SGX

                                  Unit Price
                          2 Jan 2020          $0.75
                          17 Jan 2020         $0.78
                          4 Aug 2020          $0.49
                                   NAV/Unit
                          30 Jun 2020         $0.855
                               Price / Book Value
                          4 Aug 2020          0.57

                                                                                           29
Thank You
Far East H-Trust Asset Portfolio Overview

                                                                                                            Hotels

                                                                                                                                  Orchard                               Rendezvous                             Total /
                             Village Hotel        Village Hotel       The Elizabeth       Village Hotel         Oasia                                   The                                 Oasia Hotel
                                                                                                                                 Rendezvous                                Hotel                              Weighted
                             Albert Court            Changi               Hotel               Bugis          Hotel Novena                           Quincy Hotel                            Downtown
                                                                                                                                    Hotel                                Singapore                            Average
                                                                                                                Mid-tier /         Mid-tier /
Market Segment                    Mid-tier            Mid-tier             Mid-tier           Mid-tier                                                  Upscale            Upscale            Upscale            NA
                                                                                                                Upscale            Upscale
                                                  1 Netheravon            24 Mount                                                                 22 Mount Elizabeth    9 Bras Basah
                            180 Albert Street,                                          390 Victoria Street, 8 Sinaran Drive,   1 Tanglin Road,                                           100 Peck Seah St,
Address                                               Road,           Elizabeth, S’pore                                                               Road, S’pore       Road, S’pore
                             S’pore189971                                                 S’pore 188061       S’pore 307470     S’pore 247905                                               S’pore 079333
                                                  S’pore 508502            228518                                                                       228517              189559

Date of Completion              3 Oct 1994         30 Jan 19902         3 May 1993         19 Oct 1988        2 June 2011        20 June 19872        27 Nov 2008        5 June 20002       30 Dec 2015

# of Rooms                          210                 380                  256                393                428                388                 108                298                314             2,775

Lease Tenure1                    68 years            58 years             68 years           59 years           85 years            43 years            68 years           64 years           63 years           NA

GFA/Strata Area (sq m)            11,426              22,826               11,723             21,676             22,457             34,072               4,810              19,720             17,793

Retail NLA (sq m)                  1,003                805                  583               1,166               NA                3,778                NA                 2,799               NA            10,134

Office NLA (sq m)                   NA                  NA                   NA                 NA                 NA                2,515                NA                  NA                 NA             2,515

                               First Choice         Far East               Golden                              Transurban                                Golden                               Far East
                                                                                         Golden Landmark                        Far East Orchard                        Serene Land Pte
Master Lessee / Vendor          Properties        Organization          Development                            Properties                             Development                              SOHO
                                                                                             Pte. Ltd.                               Limited                                  Ltd
                                  Pte Ltd        Centre Pte. Ltd.      Private Limited                          Pte. Ltd.                            Private Limited                          Pte Ltd

Valuation (S$ ‘mil)1               127.8               205.8                163.7              232.7              330.0              431.2                82.0               284.1             245.0           2,102.3

          1 As  at 31 December 2019
          2   Date of acquisition by Sponsor, as property was not developed by Sponsor
                                                                                                                                                                                                                        31
Far East H-Trust Asset Portfolio Overview

                                                              Serviced Residences

                                Village Residence       Village Residence      Village Residence             Regency                     Total /
                                   Clarke Quay               Hougang            Robertson Quay                House                 Weighted Average

 Market Segment                        Mid-tier               Mid-tier              Mid-tier                  Upscale                     NA

                                 20 Havelock Road,      1 Hougang Street 91,   30 Robertson Quay,       121 Penang House,
 Address
                                   S’pore 059765           S’pore 538692         S’pore 238251            S’pore 238464

 Date of Completion                 19 Feb 1998             30 Dec 1999           12 July 1996              24 Oct 2000

 # of Rooms                              128                    78                     72                        90                       368

 Lease Tenure1                        73 years               74 years               71 years                  74 years                    NA

 GFA/Strata Area (sq m)                17,858                 14,257                 10,570                   10,723                     53,408

 Retail NLA (sq m)                      2,213                   NA                   1,179                      539                      3,931

                                    Office: 1,473
 Office NLA (sq m)                                              NA                    NA                       2,291                     4,587
                                 Serviced Office: 823
 Master Lessee / Vendor         OPH Riverside Pte Ltd   Serene Land Pte Ltd     Riverland Pte Ltd   Oxley Hill Properties Pte Ltd

 Valuation (S$ ‘mil) 1                  205.9                  62.0                  105.3                     170.2                     543.4

   1 As   at 31 December 2019

                                                                                                                                                       32
You can also read