ENERCOM'S THE OIL & GAS CONFERENCE - AUGUST 16, 2021 ED LAFEHR, PRESIDENT AND CEO - THE OIL & GAS CONFERENCE
←
→
Page content transcription
If your browser does not render page correctly, please read the page content below
EnerCom’s
The Oil & Gas Conference

      August 16, 2021

Ed LaFehr, President and CEO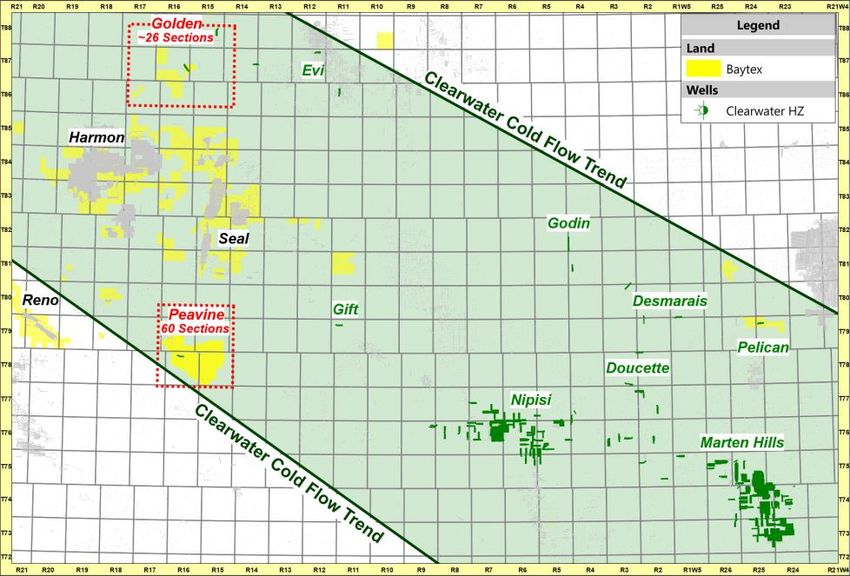
Advisory

Forward Looking Statements
Any “financial outlook” or “future oriented financial information” in this presentation as defined by applicable securities laws, has been approved by management of Baytex. Such financial outlook
or future oriented financial information is provided for the purpose of providing information about management’s current expectations and plans relating to the future. Readers are cautioned that
reliance on such information may not be appropriate for other circumstances.
In the interest of providing the shareholders of Baytex and potential investors with information regarding Baytex, including management's assessment of future plans and operations, certain
statements in this presentation are "forward-looking statements" within the meaning of the United States Private Securities Litigation Reform Act of 1995 and "forward-looking information" within
the meaning of applicable Canadian securities legislation (collectively, "forward-looking statements"). In some cases, forward-looking statements can be identified by terminology such as
"anticipate", "believe", "continue", "could", "estimate", "expect", "forecast", "intend", "may", "objective", "ongoing", "outlook", "potential", "project", "plan", "should", "target", "would", "will" or similar
words suggesting future outcomes, events or performance. The forward-looking statements contained in this presentation peak only as of the date hereof and are expressly qualified by this
cautionary statement.

Specifically, this presentation contains forward-looking statements relating to but not limited to: that we have 10+ years of drilling inventory in core areas, strong capital efficiencies and flexibility
on discretionary capital; we have potential to deliver more than $350 million of free cash flow ($0.62 per share) in 2021; we use derivate contract and crude-by-rail to reduce volatility in adjusted
funds flow; that approximately 45% of our net crude oil exposure is hedged for H2/2021; our GHG emissions intensity reduction target; expectations for 2021 as to Baytex’s production on a
boe/d basis, percentage of production that will be liquids, exploration and development expenditures, production by area and commodity; that our 2021 capital program is fully funded at
US$35/bbl WTI, will have capital efficiencies of ~$12,000 boe/d, 75% will be directed to high netback light oil assets, intend to implement a heavy oil program with 35 net wells in H2/2021
including 7 net clearwater equivalent wells and have the potential to further advance Pembina Duvernay; the expected number of wells onstream and total capex for 2021 in pour Viking, Eagle
Ford, Heavy Oil, East Duvernay and other Operating Areas; that our 5-year plan at $55 WTI will: target capital spending at $1 billion of free cash flow, has a target net debt of $1 to $1.2 billion and a target net debt to bank EBITDA ratio of
100 sections prospective for Sprit River
(clearwater equivalent), 2021 plan includes up to 7 clearwater wells with 5 wells at Peavine; ~22 net wells planned for H2/2021 in Lloydminster; in Pembina Area Duvernay, measured delineation
is planned, two wells drilled in 2020 demonstrate repeatability of 11-30 pad completed in 2019 and 2 wells planned for H2/2021; the expected individual well payout, IRR, recycle ratio and
breakeven WTI price for wells in the Eagle Ford, Viking, Peace River (excluding clearwater) and Lloydminster areas; the expected drill, complete, equip and tie-in well costs, reserves and drilling
inventory for our Eagle Ford, Peace River, Lloydminster, Viking and Pembina Duvernay assets; our aspiration, visions and approach to ESG; that we are committed to corporate sustainability;
the components of our GHG emissions reduction strategy; our new ESG targets: reducing our GHG emissions intensity by 65% by 2025 from our 2018 baseline, reduce our end of life well
inventory to zero by 2040, by 2022 evaluate and test new methods to reduce freshwater intensity and by 2022 expand our baseline to include multiple dimensions of diversity and enhance our
processes to measure employee engagement; and our 2021 guidance for exploration and development expenditures, production, royalty rate, operating, transportation, general and
administration and interest expense and leasing expenditures and asset retirement obligations. In addition, information and statements relating to reserves are deemed to be forward-looking
statements, as they involve implied assessment, based on certain estimates and assumptions, that the reserves described exist in quantities predicted or estimated, and that they can be
profitably produced in the future.
These forward-looking statements are based on certain key assumptions regarding, among other things: petroleum and natural gas prices and differentials between light, medium and heavy oil
prices; well production rates and reserve volumes; the ability to add production and reserves through exploration and development activities; capital expenditure levels; the ability to borrow under
credit agreements; the receipt, in a timely manner, of regulatory and other required approvals for operating activities; the availability and cost of labour and other industry services; interest and
foreign exchange rates; the continuance of existing and, in certain circumstances, proposed tax and royalty regimes; the ability to develop crude oil and natural gas properties in the manner
currently contemplated; and current industry conditions, laws and regulations continuing in effect (or, where changes are proposed, such changes being adopted as anticipated). Readers are
cautioned that such assumptions, although considered reasonable by Baytex at the time of preparation, may prove to be incorrect.

                                                                                                                                                                                                                2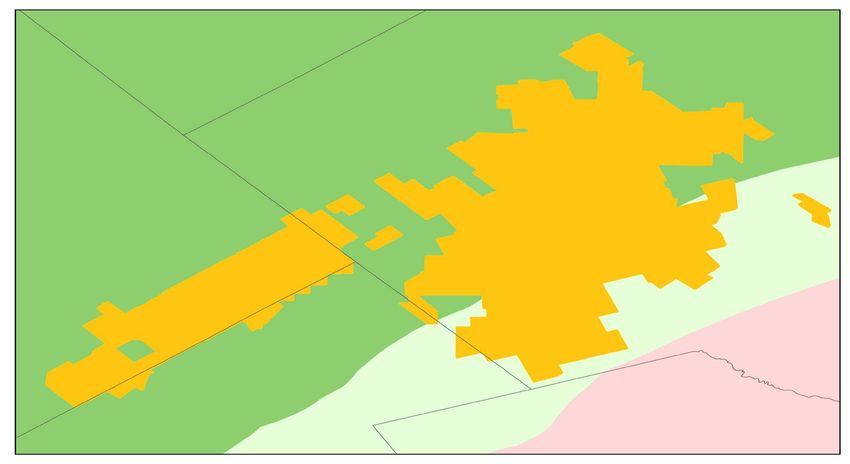
Advisory (Cont.)
Actual results achieved will vary from the information provided herein as a result of numerous known and unknown risks and uncertainties and other factors. Such factors include, but are not limited
to: the volatility of oil and natural gas prices and price differentials (including the impacts of Covid-19); the availability and cost of capital or borrowing; risks associated with our ability to exploit our
properties and add reserves; availability and cost of gathering, processing and pipeline systems; that our credit facilities may not provide sufficient liquidity or may not be renewed; failure to comply
with the covenants in our debt agreements; risks associated with a third-party operating our Eagle Ford properties; public perception and its influence on the regulatory regime; restrictions or costs
imposed by climate change initiatives and the physical risks of climate change; new regulations on hydraulic fracturing; restrictions on or access to water or other fluids; changes in government
regulations that affect the oil and gas industry; regulations regarding the disposal of fluids; changes in environmental, health and safety regulations; costs to develop and operate our properties;
variations in interest rates and foreign exchange rates; risks associated with our hedging activities; retaining or replacing our leadership and key personnel; changes in income tax or other laws or
government incentive programs; uncertainties associated with estimating oil and natural gas reserves; our inability to fully insure against all risks; risks of counterparty default; risks related to our
thermal heavy oil projects; alternatives to and changing demand for petroleum products; risks associated with our use of information technology systems; results of litigation; risks associated with
large projects; risks associated with the ownership of our securities, including changes in market-based factors; risks for United States and other non-resident shareholders, including the ability to
enforce civil remedies, differing practices for reporting reserves and production, additional taxation applicable to non-residents and foreign exchange risk; and other factors, many of which are
beyond our control. These and additional risk factors are discussed in our Annual Information Form, Annual Report on Form 40-F and Management's Discussion and Analysis for the year ended
December 31, 2020, filed with Canadian securities regulatory authorities and the U.S. Securities and Exchange Commission and in our other public filings.

The above summary of assumptions and risks related to forward-looking statements has been provided in order to provide shareholders and potential investors with a more complete perspective on
Baytex’s current and future operations and such information may not be appropriate for other purposes.

There is no representation by Baytex that actual results achieved will be the same in whole or in part as those referenced in the forward-looking statements. The future oriented financial information
and forward-looking statements are made as of July 28 2021 and Baytex disclaims any intent or obligation to update publicly any forward-looking statements, whether as a result of new information,
future events or results or otherwise, other than as required by applicable securities laws.

Non-GAAP Financial and Capital Management Measures
This presentation contains certain financial measures that do not have a standardized meaning prescribed by International Financial Reporting Standards (“IFRS”) and therefore are considered non-
GAAP measures. These non-GAAP measures may not be comparable to similar measures presented by other issuers. The following terms are not recognized measures under IFRS, but are
presented in this presentation.
“Adjusted funds flow” is defined as cash flow from operating activities adjusted for changes in non-cash operating working capital, asset retirement obligations settled and transaction costs.
Management of Baytex consider adjusted funds flow a key measure of performance as it demonstrates the combined entity’s ability to generate the cash flow necessary to fund capital investments,
debt repayment, settlement of abandonment obligations and potential future dividends. In addition, the ratio of net debt to adjusted funds flow is used to manage Baytex’s capital structure.
“Asset level free cash flow” is defined as field level operating netback less exploration and development expenditures.
“Bank EBITDA” is calculated based on terms and definitions set out in the credit agreement which adjusts net income or loss for financing and interest expense, income tax, non-recurring losses,
certain specific unrealized and non-cash transactions (including depletion, depreciation, exploration and evaluation expense, impairment, deferred income tax expense or recovery, unrealized gains
and losses on financial derivatives and foreign exchange and share-based compensation) and is calculated based on a trailing twelve month basis including the impact of material acquisitions as if
they had occurred at the beginning of the twelve month period. Bank EBITDA for the twelve months ended December 31, 2020 was $414.9 million.
“Capital Efficiency” is defined as exploration and development expenditures divided by the expected aggregate IP365 rate (boe/d) for all wells coming on production in the year, normalized to a
January 1 start-date.“
“Exploration and development expenditures” is defined as expenditures related to drilling, completing and equipping, facilities, land, seismic and other. Exploration and development expenditures
includes additions to exploration and evaluation assets along with additions to oil and gas properties.
“Free cash flow” is defined as adjusted funds flow less exploration and development expenditures, payments on lease obligations and asset retirement obligations settled.
“Internal rate of return” of “IRR” is a rate of return measure used to compare the profitability of an investment and represents the discount rate at which the net present value of costs equals the net
present value of the benefits. The higher a project’s IRR, the more desirable the project.
“Net debt” is defined as the sum of monetary working capital (which is current liabilities (excluding current financial derivatives and onerous contracts)) and the principal amount of both the long-term
notes of Baytex and the credit facilities of Baytex. Management of Baytex believe that net debt assists in providing a more complete understanding of Baytex’s cash liabilities.
“Operating netback” is defined as petroleum and natural gas sales less blending expense, royalties, production and operating expense and transportation expense divided by barrels of oil equivalent
sales volume for the applicable period. Management of Baytex believe that operating netback assists in characterizing Baytex’s ability to generate cash margin on a unit of production basis.

                                                                                                                                                                                                            3
Advisory (Cont.)

Advisory Regarding Oil and Gas Information
The reserves information contained in this presentation has been prepared in accordance with National Instrument 51-101 -Standards of Disclosure for Oil and Gas Activities of the Canadian
Securities Administrators ("NI 51-101"). The determination of oil and gas reserves involves the preparation of estimates that have an inherent degree of associated uncertainty. Categories of
proved and probable reserves have been established to reflect the level of these uncertainties and to provide an indication of the probability of recovery. The estimation and classification of
reserves requires the application of professional judgment combined with geological and engineering knowledge to assess whether or not specific reserves classification criteria have been
satisfied. Knowledge of concepts, including uncertainty and risk, probability and statistics, and deterministic and probabilistic estimation methods, is required to properly use and apply reserves
definitions.
The recovery and reserves estimates described herein are estimates only and there is no guarantee that the estimated reserves will be recovered. Actual reserves and future production from
such reserves may be greater or less than the estimates provided herein. The estimates of reserves for individual properties may not reflect the same confidence level as estimates of reserves
for all properties, due to the effects of aggregation. Complete NI 51-101 reserves disclosure for year-end 2020 is included in our Annual Information Form for the year ended December 31,
2020, which will be filed on or before March 31, 2021 with Canadian securities regulatory authorities and the U.S. Securities and Exchange Commission.
This presentation discloses drilling inventory and potential drilling locations. Drilling inventory and drilling locations refers to Baytex’s total proved, probable and unbooked locations. Proved
locations and probable locations account for drilling locations in our inventory that have associated proved and/or probable reserves. Unbooked locations are internal estimates based on our
prospective acreage and an assumption as to the number of wells that can be drilled per section based on industry practice and internal review. Unbooked locations do not have attributed
reserves. Unbooked locations are farther away from existing wells and, therefore, there is more uncertainty whether wells will be drilled in such locations and if drilled there is more uncertainty
whether such wells will result in additional oil and gas reserves, resources or production. In the Eagle Ford, Baytex’s net drilling locations include 135 proved and 75 probable locations as at
December 31, 2020 and 38 unbooked locations. In the Viking, Baytex’s net drilling locations include 985 proved and 283 probable locations as at December 31, 2020 and 443 unbooked
locations. In Peace River, Baytex’s net drilling locations include 17 proved and 48 probable locations as at December 31, 2020 and 163 unbooked locations. In Lloydminster, Baytex’s net drilling
locations include 99 proved and 74 probable locations as at December 31, 2020 and 417 unbooked locations. In the Duvernay, Baytex’s net drilling locations include 13 proved and 12 probable
locations as at December 31, 2020 and 278 unbooked locations.
References herein to average 30-day initial production rates and other short-term production rates are useful in confirming the presence of hydrocarbons, however, such rates are not
determinative of the rates at which such wells will commence production and decline thereafter and are not indicative of long term performance or of ultimate recovery. While encouraging,
readers are cautioned not to place reliance on such rates in calculating aggregate production for us or the assets for which such rates are provided. A pressure transient analysis or well-test
interpretation has not been carried out in respect of all wells. Accordingly, we caution that the test results should be considered to be preliminary.
Where applicable, oil equivalent amounts have been calculated using a conversion rate of six thousand cubic feet of natural gas to one barrel of oil. BOEs may be misleading, particularly if used
in isolation. A boe conversion ratio of six thousand cubic feet of natural gas to one barrel of oil is based on an energy equivalency conversion method primarily applicable at the burner tip and
does not represent a value equivalency at the wellhead.

Notice to United States Readers
The petroleum and natural gas reserves contained in this presentation have generally been prepared in accordance with Canadian disclosure standards, which are not comparable in all respects
to United States or other foreign disclosure standards. For example, the United States Securities and Exchange Commission (the "SEC") requires oil and gas issuers, in their filings with the
SEC, to disclose only "proved reserves", but permits the optional disclosure of "probable reserves" (as defined in SEC rules). Canadian securities laws require oil and gas issuers disclose their
reserves in accordance with NI 51-101, which requires disclosure of not only "proved reserves" but also "probable reserves". Additionally, NI 51-101 defines "proved reserves“ and "probable
reserves" differently from the SEC rules. Accordingly, proved and probable reserves disclosed in this presentation may not be comparable to United States standards. Probable reserves are
higher risk and are generally believed to be less likely to be accurately estimated or recovered than proved reserves.
In addition, under Canadian disclosure requirements and industry practice, reserves and production are reported using gross volumes, which are volumes prior to deduction of royalty and similar
payments. The SEC rules require reserves and production to be presented using net volumes, after deduction of applicable royalties and similar payments.
Moreover, in this presentation future net revenue from its reserves has been determined and disclosed estimated using forecast prices and costs, whereas the SEC rules require that reserves
be estimated using a 12-month average price, calculated as the arithmetic average of the first-day-of-the-month price for each month within the 12-month period prior to the end of the reporting
period. As a consequence of the foregoing, the reserve estimates and production volumes in this presentation may not be comparable to those made by companies utilizing United States
reporting and disclosure standards.
All amounts in this presentation are stated in Canadian dollars unless otherwise specified.

                                                                                                                                                                                                  4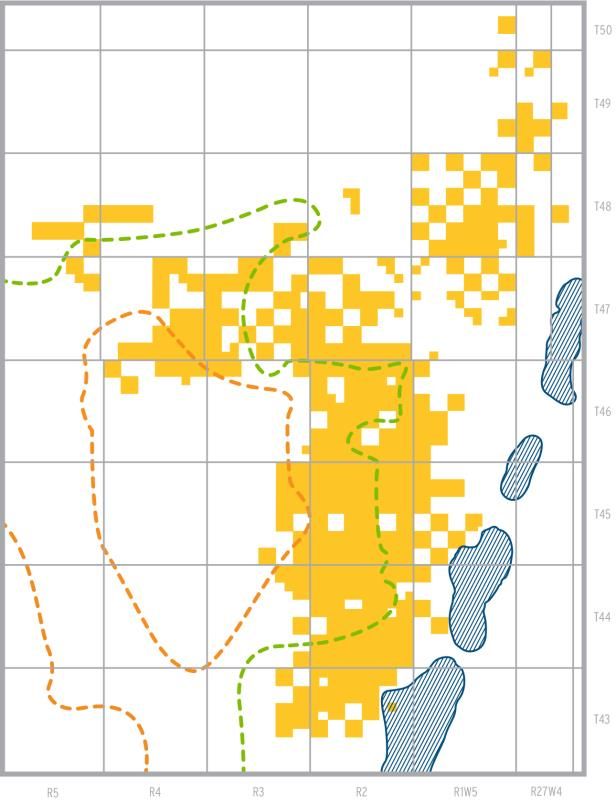
Corporate Profile

                                                                                       Market Summary
                                                                                        Ticker Symbol                                                                   TSX: BTE
                                                                                         Average Daily Volume              (1)                                          7.7 million
                                                                                        Shares      Outstanding (2)                                                     564 million
                                                                                        Market Capitalization / Enterprise                 Value (2)                    $1.2 billion / $2.8 billion

                                                                                     Operating Statistics
                                                                                        Production (Gross W.I.) (3)                                                     79,000 – 80,000 boe/d
                                                                                        Production Mix            (3)                                                   81% liquids
                                   PEACE RIVER

                                 DUVERNAY
                                       LLOYDMINSTER
                                                                                        E&D Expenditures (3)                                                            $285 to $315 million
                                                 VIKING                                 Reserves – 2P Gross (4)                                                         462 mmboe

                                                                                               Production by                                   Production by                             Revenue by
                                                                                                Core Area (5)                                  Commodity (5)                            Commodity (6)

                                                                                                                                                                                         Natural
                                                                                                 Other
                                                                                                                                              Natural                                 NGLs Gas        Heavy
                                                                                                                                               Gas              Heavy                                  Oil
                                                                                                                   Eagle                                         Oil
                                                                                                                   Ford                   NGLs
                                                                                           Heavy
                                                                                            Oil
                                                                                                                                                                                             Light
                                                   EAGLE FORD
                                                                                                         Viking                                         Light                                 Oil
                                                                                                                                                         Oil

(1)   Average daily trading volumes for July 1-27, 2021. Volumes are a composite of all exchanges in Canada.
(2)   Enterprise value based on closing share price on the Toronto Stock Exchange on July 27, 2021 and shares outstanding and net debt as at June 30, 2021.
(3)   Production, production mix, and exploration and development (“E&D”) expenditures represents 2021 guidance.
(4)   Baytex reserves as at December 31, 2020 as evaluated by McDaniel & Associates Consultants Ltd.
(5)   Production (Gross W.I.) composition based on 2021 guidance. Heavy oil includes Peace River and Lloydminster.
(6)   Revenue by commodity composition based on 2020 actuals.                                                                                                                                                 5
ESG Highlights

GHG Emission Reduction                     Safety
          46% reduction in GHG                       25% reduction in total
          emissions intensity                        recordable injury frequency in
          65% reduction in GHG                       5 years
          emissions intensity target

Gas Conservation                           Indigenous Relations
          97% routine gas conservation               Recent agreements with
          in Peace River in 2020                     Woodland Cree First Nation
                                                     and Peavine Métis Settlement

Spill Volumes                              Gender Diversity
          59% reduction in reportable                25% women Board members
          spill volumes over 5 years                 as of April 2021

Abandonment & Reclamation                  Water
          Reduce inactive well inventory             Initiate water recycle projects
          to zero by 2040                            in Kerrobert, Viking and
                                                     Duvernay
                                                                                       6
Q2 2021 Highlights

Operational Execution
   •   Production of 81,200 boe/d, up 3% from Q1/2021
   •   E&D capital of $61 million, consistent with full-year plan
   •   Continue to advance our Peace River Clearwater play with 5 wells on
       production

Free Cash Flow Generation
   •   Adjusted funds flow of $176 million ($0.31 per basic share), a 12% increase
       over Q1/2021
   •   Substantial free cash flow of $112 million ($0.20 per basic share)

Strengthened Balance Sheet
   •   Reduced net debt by $129 million through a combination of free cash flow and
       the Canadian dollar strengthening relative to the U.S. dollar
   •   Increased undrawn capacity to $511 million (50% undrawn on our $1 billion
       credit facilities)
   •   Repurchased and cancelled US$106 million of our outstanding long-term
       notes due 2024 during and subsequent to the quarter

                                                                                      7
2021 Capital Program

•   Cash neutrality (capital program fully         2021 Guidance (1)
    funded) at US$35/bbl WTI
                                                   E&D CapEx                                                      $285 - 315 million

•   Capital efficiencies of approximately          Production                                              79,000 - 80,000 boe/d
    $12,000 per boe/d across the                   Oil and NGLs                                                                         81%
    portfolio
                                                                                           Net Wells
•   75% directed to our high netback           Operating Area                              Onstream                 CapEx ($MM) (2)
    light oil assets in the Eagle Ford and
                                               Viking                                                 120                               $115
    Viking
                                               Eagle Ford                                               22                              $110
•   Heavy oil program kicked off in June       Heavy Oil                                                35                                $45
    – 35 net wells planned for the year,
    including up to 7 net Clearwater           East Duvernay                                              2                               $20
    equivalent wells                           Other                                                      4                               $10
                                               Total                                                                                    $300
•   Further advancing our Pembina
    Duvernay development with two well       (1)    2021 capital spending is 52% weighted to the second half of the year. Eagle Ford
                                                    development includes 14 net wells drilled and 22 net wells on production. Other development
    program in H2/2021                              includes 2 net natural gas wells drilled and 4 net natural gas wells on production.
                                             (2)    Represents mid-point of 2021 guidance range.

                                                                                                                                                  8
5-Year Plan (2021 to 2025) at US$55 WTI

1. Disciplined and Returns Based Capital Allocation
                •        Target capital spending at < 70% of adjusted funds flow
                •        Optimize production in the 80,000 to 85,000 boe/d range
                •        Capital efficiencies during the plan period of $15,000 to $16,000 per boe/d

2. Maximize Free Cash Flow
                •        Generate > $1 billion of free cash flow during the plan period

3. Improve Leverage Ratios
                •        Target net debt of $1.0 to $1.2 billion and net debt to bank EBITDA ratio of
                         < 1.5x at US$55 WTI

4. Enhance Shareholder Returns (2022-2025)
                •        Consider introduction of share buy-back, dividend and/or reinvestment for
                         organic growth
Notes:
(1)      For illustrative purposes only and should not be relied upon as indicative of future results. Baytex’s actual results may vary.
(2)      Budget and forecast beyond 2021 have not been finalized and are subject to a variety of factors including prior year’s results. Year one of the 5-year plan (2021) based on H1/2021 actual results and the forward strip for the
         balance of the year. Full year 2021 pricing assumptions:: WTI - US$64/bbl; WCS differential - US$13/bbl; MSW differential – US$5/bbl, NYMEX Gas - US$3.30/mcf; AECO Gas - $3.45/mcf and Exchange Rate (CAD/USD) - 1.26
         Years two through five of the five-year plan (2022 to 2025) based on the following commodity price assumptions: WTI - US$55/bbl; WCS differential - US$12.50/bbl; MSW differential – US$5.50/bbl, NYMEX Gas - US$2.75/mcf;
         AECO Gas - $2.75/mcf and Exchange Rate (CAD/USD) - 1.28.
(3)      Net Debt to Bank EBITDA ratio calculation is based on forecast net debt at each year-end and forecast Bank EBITDA for that particular year. See advisory for definitions of Non-GAAP Financial and Capital Management Measures
         on page 3 of this presentation.

                                                                                                                                                                                                                                            9
5-Year Plan Generates > $1 Billion Cumulative Free Cash Flow

                     90,000
                                                                                                                                                                                                          > $1 Billion Cumulative Free Cash Flow
                     80,000                                                                                                                                                                     $1,400

                     70,000

                                                                                                                                                       Cumulative Free Cash Flow ($ millions)
                                                                                                                                                                                                $1,200
                     60,000
                                                                                                                                                                                                $1,000
Production (boe/d)

                     50,000
                                                                                                                                                                                                 $800
                     40,000
                                                                                                                                                                                                 $600
                     30,000

                                                                                                                                                                                                 $400
                     20,000

                     10,000                                                                                                                                                                      $200

                           0                                                                                                                                                                       $0
                            2021                     2022                     2023                    2024                     2025                                                                         2021          2022      2023      2024     2025
                                         Eagle Ford          Viking       Heavy Oil        Duvernay          Conventional

                                                                                                      Adjusted                           Adjusted                                                             Capital
                                                                    Production                                                                                                                                                    Free Cash    Ending Net Debt
                                                                                                    Funds Flow                        Funds Flow                                                         Expenditures
                                                                       (boe/d)                                                                                                                                                   Flow ($MM)             ($MM)
                                                                                                        ($ MM)                       ($ per share)                                                             ($MM)
            2021                                                             79,500                              $675                             $1.20                                                            $300                $360             $1,480
            2022                                                             79,900                              $591                             $1.04                                                            $366                $200             $1,280
            2023                                                             81,500                              $615                             $1.08                                                            $410                $180             $1,100
            2024                                                             83,000                              $648                             $1.14                                                            $410                $213               $887
            2025                                                             83,900                              $666                             $1.16                                                            $410                $231               $656
  Notes:
  (1)                For illustrative purposes only and should not be relied upon as indicative of future results. Baytex’s actual results may vary.
  (2)                Budget and forecast beyond 2021 have not been finalized and are subject to a variety of factors including prior year’s results. Year one of the 5-year plan (2021) based on H1/2021 actual results and the forward strip for the balance
                     of the year. Full year 2021 pricing assumptions:: WTI - US$64/bbl; WCS differential - US$13/bbl; MSW differential – US$5/bbl, NYMEX Gas - US$3.30/mcf; AECO Gas - $3.45/mcf and Exchange Rate (CAD/USD) - 1.26.
  (3)                Years two through five of the five-year plan (2022 to 2025) based on the following commodity price assumptions: WTI - US$55/bbl; WCS differential - US$12.50/bbl; MSW differential – US$5.50/bbl, NYMEX Gas - US$2.75/mcf;
                     AECO Gas - $2.75/mcf and Exchange Rate (CAD/USD) - 1.28.

                                                                                                                                                                                                                                                              10
5-Year Plan with Upside WTI Scenario’s
US$55 WTI US$60 WTI US$65 WTI
>$1 Billion >$1.5 Billion >$2 Billion
Cumulative FCF Cumulative FCF Cumulative FCF
$500 2.0x
$450 1.8x
$400 1.6x
$350 1.4x
Free Cash Flow ($ millions)
Net Debt to Bank EBITDA ratio
$300 1.2x
$250 1.0x
$200 0.8x
$150 0.6x
$100 0.4x
$50 0.2x
$0 0.0x
2021 2022 2023 2024 2025 2021 2022 2023 2024 2025 2021 2022 2023 2024 2025
US$55/bbl US$60/bbl US$65/bbl
Free Cash Flow Net Debt to Bank EBITDA
Notes:
(1) For illustrative purposes only and should not be relied upon as indicative of future results. Baytex’s actual results may vary. Budget and forecast beyond 2021 have not been finalized and are subject to a variety of factors including
prior year’s results.
(2) 2021 (year one of the base case and the upside WTI scenarios) is based on H1/2021 actual results and the forward strip for the balance of the year. Full year 2021 pricing assumptions: WTI - US$64/bbl; WCS differential -
US$13/bbl; MSW differential – US$5/bbl, NYMEX Gas - US$3.30/mcf; AECO Gas - $3.45/mcf and Exchange Rate (CAD/USD) - 1.26
(3) Years two through five of the base case (2022 to 2025) based on the following commodity price assumptions: WTI - US$55/bbl; WCS differential - US$12.50/bbl; MSW differential – US$5.50/bbl, NYMEX Gas - US$2.75/mcf;
AECO Gas - $2.75/mcf and Exchange Rate (CAD/USD) - 1.28. In the upside WTI scenarios, all other pricing assumptions are held constant
(4) Net Debt to Bank EBITDA ratio calculation is based on forecast net debt at each year-end and forecast Bank EBITDA for that particular year. Free cash flow is utilized to reduce net debt. See advisory for definitions of Non-GAAP
Financial and Capital Management Measures on page 3 of this presentation.
11Financial Liquidity
• Credit Facilities ~ 50% Balance Sheet (1) $ millions
Undrawn Credit facilities $487
• $511 million of undrawn credit Long-term notes $1,109
capacity and liquidity, net of Long-term debt $1,596
working capital, of $477 million Working Capital deficiency $34
Net Debt $1,630
• First long-term note maturity
C$548
not until 2024 Undrawn
• Repurchased and cancelled
US$106 million of 2024 long- US$400
Long-Term Notes Maturity Schedule (2) ($ millions)
term notes in 2021
Repurchased and
cancelled in 2021 US$106
US$500
(1) Balance sheet as at June 30, 2021. Revolving credit facilities mature April 2024 and are
comprised of a US$575 million facility and a $300 million term loan facility. Revolving Principal amount
credit facilities are not borrowing base facilities and do not require annual or semi-annual outstanding as of July
US$294
reviews. 2021
(2) S&P corporate rating “B” and senior unsecured debt rating “B+” ; Fitch corporate rating
and senior unsecured debt rating “B”; Moody’s corporate rating “B2” and senior
unsecured debt rating “B3”. 2021 2022 2023 2024 2025 2026 2027 2028
12Crude Oil Hedge Portfolio
Q3/2021 Q4/2021 H2/2021 2022
WTI Fixed Hedges (1)
Volumes (bbl/d) 4,000 4,000 4,000 10,000
Fixed Price (US$/bbl) $45.00 $45.00 $45.00 $53.50
WTI 3-Way Option (2)
Volumes (bbl/d) 17,500 17,500 17,500 10,500
Average Sold Put / Put / Sold Call (US$/bbl) $35/$45/$52 $35/$45/$52 $35/$45/$52 $48/$58/$68
Total Hedge Volumes (bbl/d) 21,500 21,500 21,500 20,500
Hedge (%) (3) 45% 45% 45% 42%
Basis Differential Hedges
WCS Volumes (bbl/d) 11,000 11,000 11,000 10,000
WCS Price Relative to WTI (US$/bbl) ($13.23) ($13.23) ($13.23) ($12.53)
MSW Volume (bbl/d) 7,500 7,500 7,500 2,000
MSW Price Relative to WTI (US$/bbl) ($5.03) ($5.03) ($5.03) ($4.63)
(1) WTI fixed hedges for 2022 include 10,000 bbl/d of swaptions where the counterparty has the right, if exercised on December 31, 2021, to enter into a swap transaction for the volumes and price indicated.
(2) WTI 3-way options consist of a sold put, a bought put and a sold call. In a $48/$58/$68 example, Baytex receives WTI+$10/bbl when WTI is at or below $48/bbl; Baytex receives $58/bbl when WTI is
between $48/bbl and $58/bbl; Baytex receives WTI when WTI is between $58/bbl and $68/bbl; and Baytex receives $68/bbl when WTI is above $68/bbl.
(3) Percentage of hedged volumes are based on 2021 annual production guidance (excluding NGL), net of royalties
13Asset Highlights
Geographic and play diversification with ~ 10 or more years drilling inventory in each core area
Eagle Ford Viking Heavy Oil Pembina Duvernay
Production 30,400 boe/d 17,800 boe/d 23,800 boe/d 1,900 boe/d
(Gross; H1 2021)
Oil and NGLs 79% 90% 91% 82%
(Gross; H1 2021)
2P Reserves (1) 215 mmboe 85 mmboe 123 mmboe 17 mmboe
(Gross)
▪ 19,851 net acres in the ▪ 419,615 net acres of ▪ Dominant land position ▪ 148,480 net acres of
core of Karnes county land in the Viking play of 672,640 net acres 100% W.I. lands in the
with outstanding ▪ Shallow, light oil, strong ▪ Low decline production Pembina area
operating partner, netback asset with provides capital ▪ Offset development and
Marathon “manufacturing” allocation flexibility 9 wells drilled to-date
▪ Stable production base development ▪ Innovative multi-lateral have derisked ~ 40% of
with low sustaining ▪ Technical horizontal drilling acreage position
Asset capital has driven ~ advancements drive generates top tier capital ▪ Measured delineation
Highlights $923 million of asset productivity efficiencies planned
level free cash flow improvements
since 2016 (2)
▪ Enhanced completions
continue to drive step
change in performance
(1) Baytex reserves as at December 31, 2020 as evaluated by McDaniel & Associates Consultants Ltd. See “Advisories”.
(2) The term “asset level free cash flow” is a non-GAAP measure. See slide 3 for more information.
14Eagle Ford: Core of Karnes County
• 19,900 net acres in the
core of the Eagle Ford
shale in south Texas
Wilson
• Four AMI’s (Longhorn,
Sugarloaf, Ipanema and
Excelsior) with average
25% W.I.
Karnes
• H1/2021 production of
LONGHORN 30,400 boe/d (79%
liquids)
Atascosa
• H1/2021 - 62 gross (17.2
SUGARLOAF
net) wells established
average 30-day IP rates of
IPANEMA
EXCELSIOR ~ 1,600 boe/d per well
• Expect to bring ~ 22 net
wells on production in
Live Oak 2021
Bee
Oil Condensate Dry Gas
15Viking Light Oil: 460 Highly Prospective Sections
• Shallow (700 m), light oil
(36° API) resource play
with strong netbacks
• Produced 17,800 boe/d
(90% oil) in H1/2021
• Drilling activity resumed
in December with two
rigs mobilized
Kerrobert
Plenty
•
Esther/Hoosier
Greater Gleneath
Capital reduction effort
Lucky Hills/Whiteside Dodsland
and operational
efficiencies drive costs
down ~ 10%
Mantario (Laporte)
Plato
• Expect to bring ~ 120 net
wells on production in
2021
Baytex Lands
16Peace River: Innovative Multi-Lateral Development
Performance Drivers
• Produced 13,700 boe/d in
H1/2021 (86% oil)
Golden • Dominant 560 net sections
• Three net Bluesky multi-lateral
wells planned for H2/2021
Seal Peavine Lands
Harmon Valley
• 60 section strategic agreement
with Peavine Metis settlement
signed in Q1/2020
• Exploratory play targeting Spirit
River formation, a Clearwater
formation equivalent
• Five net wells on production -
Reno
Peavine two successful appraisal wells
(2-laterals each); three
additional wells (8-laterals each)
Baytex Lands
17Northwest Clearwater: Extending the Trend
Peavine
• > 500 net sections in the NW Clearwater fairway with > 100 prospective for Spirit River
(Clearwater equivalent)
• 2021 development includes 7 Clearwater multi-lateral wells, including 5 wells at Peavine
• Promising results from initial two appraisal wells (two laterals each) with 30-day initial production
rate of ~ 175 bbl/d per well; 3 additional 8-lateral wells on production
• With over a decade of experience in heavy oil exploration and multi-lateral development, this play
type aligns strongly with our core competencies
• >3 million meters and >2,400 legs drilled in the region since 2005
18Lloydminster: Significant Land Position and Drilling Inventory
Performance Drivers
• Produced 10,100 boe/d in
H1/2021 (98% oil)
Ardmore/Cold Lake • Strong capital efficiencies
• Applying multi-lateral
horizontal drilling and
Lindbergh
production techniques
Lloydminster Tangleflags
• ~ 22 net wells planned for
Soda Lake
H2/2021
Kerrobert
ALBERTA SASKATCHEWAN
Baytex Lands
19Pembina Area Duvernay Light Oil: Emerging Resource Play
Pembina Duvernay
• 232 sections of 100% WI lands
• Nine wells drilled to date have
delineated a minimum of 100-
125 sections
• Produced 1,900 boe/d (82%
liquids) in H1/2021
• Two wells drilled in 2020
Black Oil demonstrate repeatability of 11-
30 pad completed in 2019
Volatile
• 10-16 generated a 30-day IP
Liquids Rich Gas Oil rate of 1,300 boe/d (69% oil);
11-16 generated a facility
constrained 30-day IP rate of
900 boe/d (68% oil)
Baytex Lands
Rimbey Leduc Reef
Liquids • Two wells to be drilled and
Rich Gas
completed in Q3/2021
Producing Pads (7 wells) Two wells (10-16, 11-16) Two wells (06-08, 07-08)
pre-2020 onstream November 2020 expected onstream Q3 2021
20Investment Highlights
High Quality and ▪ ~ 10 or more years of projected drilling inventory in each of our
Diversified Oil Portfolio core areas (Viking, Eagle Ford and Canadian heavy oil)
Across Multiple Plays ▪ Strong capital efficiencies and flexibility on discretionary capital
▪ Exploration and development expenditures represents 81% of
Track Record of adjusted funds flow over the last five years (2016 to 2020)
Substantial Free Cash
▪ Potential to deliver > $350 million ($0.62 per share) of free cash
Flow Generation flow in 2021 (1)
Financial Liquidity and ▪ Credit facilities ~ 50% undrawn and liquidity ~ $500 million (2)
No Near-Term Maturities ▪ First long-term note maturity not until June 2024
▪ Utilize financial derivative contracts and crude-by-rail to reduce the
Consistent Approach to volatility in our adjusted funds flow
Risk Management ▪ ~ 45% of net crude oil exposure hedged for H2/2021
▪ Proven commitment to environmental, social and governance
(“ESG”) objectives
Committed to ESG
▪ Established target to reduce GHG emissions intensity by 65% by
2025, relative to 2018 baseline
(1) 2021 full-year pricing assumptions: WTI - US$64/bbl; WCS differential - US$13/bbl; MSW differential – US$4/bbl; NYMEX Gas -
US$3.30/mcf; AECO Gas - $3.45/mcf and Exchange Rate (CAD/USD) - 1.26.
(2) As at June 30, 2021.
21Contact Information
Baytex Energy Corp. Edward D. LaFehr
President and Chief Executive Officer
Suite 2800, Centennial Place 587.952.3000
520 – 3rd Avenue S.W.
Calgary, Alberta T2P 0R3 Rodney D. Gray
T 587.952.3000 Executive Vice President & Chief Financial Officer
Toll Free 1.800.524.5521 587.952.3160
Brian G. Ector
www.baytexenergy.com Vice President, Capital Markets
587.952.3237You can also read