Bank of America Merrill Lynch - GLOBAL ENERGY CONFERENCE Miami, Florida November 13, 2014
←
→
Page content transcription
If your browser does not render page correctly, please read the page content below

Bank of America Merrill Lynch
GLOBAL ENERGY CONFERENCE

Miami, Florida      Brian Ector
November 13, 2014   SVP Capital Markets and Public Affairs
Advisory
Forward-Looking Statements

In the interest of providing Baytex's shareholders and potential investors with information regarding Baytex, including management's assessment of Baytex's future plans and operations, certain
statements made by the presenter and contained in these presentation materials (collectively, this "presentation") are "forward-looking statements" within the meaning of the United States Private
Securities Litigation Reform Act of 1995 and "forward-looking information" within the meaning of applicable Canadian securities legislation (collectively, "forward-looking statements"). The forward-looking
statements contained in this presentation speak only as of the date of this presentation and are expressly qualified by this cautionary statement. The information contained in this presentation does not
purport to be all-inclusive or to contain all information that potential investors may require.

Specifically, this presentation contains forward-looking statements relating to, but not limited to: our business strategies, plans and objectives; our plans for funding our capital expenditures and dividends
on our common shares; our dividend policy; our plan to divest our North Dakota assets, including the timing of closing the divestiture, the estimated net proceeds from the divestiture and the intended use
of the net proceeds from the divestiture; our oil and natural gas production, production mix and capital expenditures for the second half of 2014 and full-year 2014; production growth rates; reserves and
reserves life index; single well economics at Eagle Ford, Peace River and Lloydminster, including drilling and completion costs, initial production rates, liquids weighting, capital efficiency ratio, internal
rates of return and payout; profit to investment ratios for North American resource plays; our Eagle Ford shale play, including the growth potential of the assets, estimated ultimate recoverable reserves
from the wells, our expectation regarding the effect of well downspacing, improving completion techniques and new development targets on the reserves potential of the assets, initial production rates
from new wells, drilling efficiency and individual well economics; our belief that the Eagle Ford assets will be an excellent fit with our business model, will provide shareholders with exposure to a low-risk,
repeatable, high-return asset with leading capital efficiencies, that the acquired assets have infrastructure in place to provide future production growth, and that such assets will provide material
production, long-term growth and high quality reserves with upside potential; our Peace River heavy oil resource play, including development and operational plans, years of drilling inventory remaining,
the number and type of wells to be drilled in 2014, reservoir characteristics and well economics for multi-lateral horizontal wells (including well design, drilling and completion costs, initial production rates,
estimated recoverable reserves, capital efficiency ratio and finding and development costs); our Lloydminster heavy oil property, including years of drilling inventory remaining, the number and type of
wells to be drilled in 2014, and drilling and completion costs, initial production rates, estimated recoverable reserves, capital efficiency ratio and finding and development costs for both vertical and
horizontal wells; our operational plans for 2014, including oil and natural gas production and capital expenditures for the second half of 2014 and full-year 2014, the allocation of our capital budget by
area, the number of wells to be drilled by area and the amount of capital to be spent drilling wells in the Eagle Ford that will not contribute production until 2015; the results of our asset portfolio review,
including the possibility of further asset divestitures; the outlook for Canadian heavy oil prices and the pricing differential between Canadian heavy oil and West Texas Intermediate light oil, including
catalysts that could positively impact heavy oil prices in 2014; pricing differentials for Western Canadian Select and Maya heavy crude oils; the development of rail transportation capacity in Western
Canada; our ability to optimize the price received for our oil production and to manage our exposure to heavy oil price differentials by transporting our crude oil to market using trucks and railways; the
existence, operation and strategy of our risk management program, including the breakdown of our heavy oil sales portfolio by market for Q3/2014 and the portion of future exposures that have been
hedged; proposed pipeline infrastructure development and the timing of completing such developments; the demand outlook for Canadian heavy oil in the United States; our liquidity and financial
capacity; and the sufficiency of our financial resources to fund our operations. In addition, information and statements relating to reserves are deemed to be forward-looking statements, as they involve
implied assessment, based on certain estimates and assumptions, that the reserves described exist in quantities predicted or estimated, and that the reserves can be profitably produced in the future.

Cash dividends on our common shares are paid at the discretion of our Board of Directors and can fluctuate. In establishing the level of cash dividends, the Board of Directors considers all factors that it
deems relevant, including, without limitation, the outlook for commodity prices, our operational execution, the amount of funds from operations and capital expenditures and our prevailing financial
circumstances at the time. Although Baytex believes that the expectations and assumptions upon which the forward-looking statements are based are reasonable, undue reliance should not be placed on
the forward-looking statements because Baytex can give no assurance that they will prove to be correct.

These forward-looking statements are based on certain key assumptions regarding, among other things: completion of the divestiture of our North Dakota assets; our ability to execute and realize on the
anticipated benefits of the acquisition of the Eagle Ford assets; petroleum and natural gas prices and pricing differentials between light, medium and heavy gravity crude oils; well production rates and
reserve volumes; our ability to add production and reserves through our exploration and development activities; capital expenditure levels; the receipt, in a timely manner, of regulatory and other required
approvals for our operating activities; the availability and cost of labour and other industry services; the amount of future cash dividends that we intend to pay; interest and foreign exchange rates; the
continuance of existing and, in certain circumstances, proposed tax and royalty regimes; our ability to develop our crude oil and natural gas properties in the manner currently contemplated; and current
or, where applicable, proposed assumed industry conditions, laws and regulations will continue in effect or as anticipated. Readers are cautioned that such assumptions, although considered reasonable
by us at the time of preparation, may prove to be incorrect.

                                                                                                                                                                                                                       2
Advisory (Cont.)
Actual results achieved will vary from the information provided herein as a result of numerous known and unknown risks and uncertainties and other factors. Such factors include, but are not limited to:
failure to realize the anticipated benefits of the acquisition of the Eagle Ford assets; declines in oil and natural gas prices; risks related to the accessibility, availability, proximity and capacity of gathering,
processing and pipeline systems; variations in interest rates and foreign exchange rates; risks associated with our hedging activities; uncertainties in the credit markets may restrict the availability of credit or
increase the cost of borrowing; refinancing risk for existing debt and debt service costs; a downgrade of our credit ratings; the cost of developing and operating our assets; risks associated with the
exploitation of our properties and our ability to acquire reserves; changes in government regulations that affect the oil and gas industry; changes in income tax or other laws or government incentive
programs; uncertainties associated with estimating petroleum and natural gas reserves; risks associated with acquiring, developing and exploring for oil and natural gas and other aspects of our operations;
risks associated with large projects or expansion of our activities; risks related to heavy oil projects; changes in environmental, health and safety regulations; the implementation of strategies for reducing
greenhouse gases; depletion of our reserves; risks associated with the ownership of our securities, including the discretionary nature of dividend payments and changes in market-based factors; risks for
United States and other non-resident shareholders, including the ability to enforce civil remedies, differing practices for reporting reserves and production, additional taxation applicable to non-residents and
foreign exchange risk; and other factors, many of which are beyond our control. These risk factors are discussed in Baytex's Annual Information Form, Annual Report on Form 40-F and Management's
Discussion and Analysis for the year ended December 31, 2013, as filed with Canadian securities regulatory authorities and the U.S. Securities and Exchange Commission.

Readers are cautioned that the foregoing list of risk factors is not exhaustive. New risk factors emerge from time to time, and it is not possible for management to predict all of such factors and to assess in
advance the impact of each such factor on our business or the extent to which any factor, or combination of factors, may cause actual results to differ materially from those contained in any forward-looking
statements.

The above summary of assumptions and risks related to forward-looking statements in this presentation has been provided in order to provide potential investors with a more complete perspective of our
current and future operations and as such information may be not appropriate for other purposes. There is no representation by Baytex that actual results achieved will be the same in whole or in part as
those referenced in the forward-looking statements and Baytex does not undertake any obligation to update publicly or to revise any of the included forward-looking statements, whether as a result of new
information, future events or otherwise, except as may be required by applicable securities law.

Oil and Gas Information

This presentation contains estimates, as at December 31, 2013, of the volume of our petroleum and natural gas reserves as prepared by our independent qualified reserves evaluators, Sproule Associates
Limited ("Sproule"), except for the Eagle Ford assets, which were prepared by an internal non-independent qualified reserves evaluator. These estimates have been prepared in accordance with Canadian
reserves disclosure standards and definitions as set forth in National Instrument 51-101 “Standards of Disclosure for Oil and Natural Gas Activities” of the Canadian Securities Administrators (“NI 51-101”).
The determination of oil and gas reserves involves the preparation of estimates that have an inherent degree of associated uncertainty. Categories of proved and probable reserves have been established to
reflect the level of these uncertainties and to provide an indication of the probability of recovery. The estimation and classification of reserves requires the application of professional judgment combined with
geological and engineering knowledge to assess whether or not specific reserves classification criteria have been satisfied. Knowledge of concepts, including uncertainty and risk, probability and statistics,
and deterministic and probabilistic estimation methods, is required to properly use and apply reserves definitions.

The recovery and reserves estimates described herein are estimates only and there is no guarantee that the estimated reserves will be recovered. Actual reserves and future production from such reserves
may be greater or less than the estimates provided herein. The estimates of reserves for individual properties may not reflect the same confidence level as estimates of reserves for all properties, due to the
effects of aggregation. For complete NI 51-101 reserves disclosure, please see our Annual Information Form for the year end December 31, 2013 dated March 25, 2014.

This presentation contains estimates of the volumes of the "contingent resources" for our oil resource plays in the Bluesky in the Peace River area of Alberta and the Mannville group in northeast Alberta as
of December 31, 2013 and for the Gemini SAGD project in Cold Lake, Alberta, as of December 31, 2012. These estimates were prepared by our independent qualified reserves evaluators, Sproule and
McDaniel & Associates Consultants Ltd. ("McDaniel").

"Contingent resources" are not, and should not be confused with, petroleum and natural gas reserves. "Contingent resources" are defined in the Canadian Oil and Gas Evaluation Handbook as: "those
quantities of petroleum estimated, as of a given date, to be potentially recoverable from known accumulations using established technology or technology under development, but which are not currently
considered to be commercially recoverable due to one or more contingencies. Contingencies may include factors such as economic, legal, environmental, political and regulatory matters or a lack of markets.
It is also appropriate to classify as contingent resources the estimated discovered recoverable quantities associated with a project in the early evaluation stage.”

The outstanding contingencies applicable to our disclosed contingent resources do not include economic contingencies. Economic contingent resources are those resources that are currently economically
recoverable based on specific forecasts of commodity prices and costs. The assigned contingent resources are categorized as economically recoverable based on economics completed at year-end 2012.                       3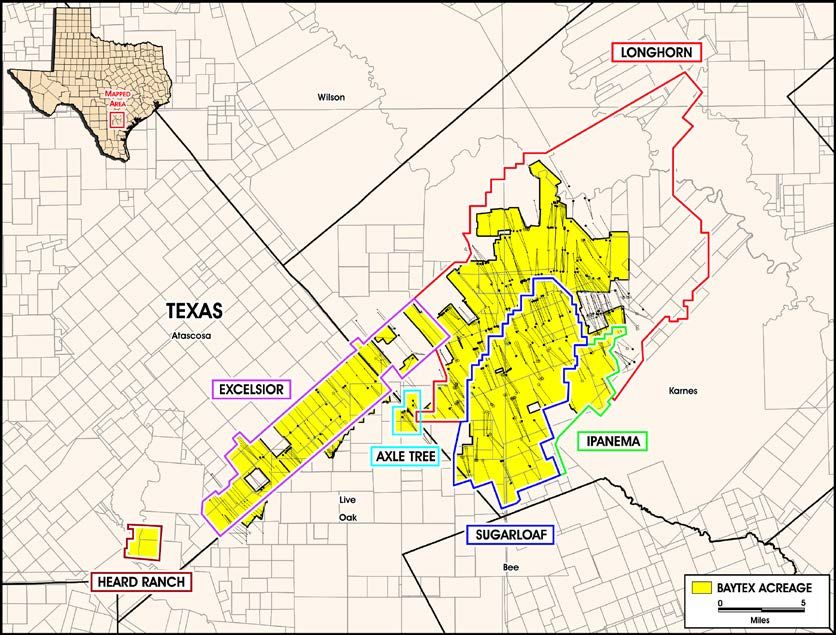
Advisory (Cont.)

A range of contingent resources estimates (low, best and high) were prepared by Sproule and McDaniel. A low estimate (C1) is considered to be a conservative estimate of the quantity of the
resources that will actually be recovered. It is likely that the actual remaining quantities recovered will exceed the low estimate. Those resources in the low estimate have the highest degree of certainty
(a 90% confidence level) that the actual quantities recovered will equal or exceed the estimate. A best estimate (C2) is considered to be the best estimate of the quantity of the resources that will
actually be recovered. It is equally likely that the actual remaining quantities recovered will be greater or less than the best estimate. Those resources in the best estimate have a 50% confidence level
that the actual quantities recovered will equal or exceed the estimate. A high estimate (C3) is considered to be an optimistic estimate of the quantity of the resources that will actually be recovered. It is
unlikely that the actual remaining quantities of resources recovered will equal or exceed the high estimate. Those resources in the high estimate have a lower degree of certainty (a 10% confidence
level) that the actual quantities recovered will equal or exceed the estimate.

The primary contingencies which currently prevent the classification of the contingent resources as reserves consist of: preparation of firm development plans, including determination of the specific
scope and timing of the project; project sanction; access to capital markets; stakeholder and regulatory approvals; access to required services and field development infrastructure; oil prices and price
differentials between light, medium and heavy gravity crude oils; future drilling program and testing results; further reservoir delineation and studies; facility design work; limitations to development
based on adverse topography or other surface restrictions; and the uncertainty regarding marketing and transportation of petroleum from development areas.

There is no certainty that it will be commercially viable to produce any portion of the contingent resources or that we will produce any portion of the volumes currently classified as contingent resources.
The estimates of contingent resources involve implied assessment, based on certain estimates and assumptions, that the resources described exists in the quantities predicted or estimated and that
the resources can be profitably produced in the future.

The recovery and resources estimates provided herein are estimates only. Actual contingent resources (and any volumes that may be reclassified as reserves) and future production from such
contingent resources may be greater than or less than the estimates provided herein.

References herein to initial test production rates, 30-day IP rates and other short-term production rates are useful in confirming the presence of hydrocarbons; however, such rates are not
determinative of the rates at which such wells will commence production and decline thereafter and are not indicative of long term performance or of ultimate recovery. While encouraging, readers are
cautioned not to place reliance on such rates in calculating aggregate production for us or the acquired assets. A pressure transient analysis or well-test interpretation has not been carried out in
respect of all wells. Accordingly, we caution that the test results should be considered to be preliminary.

When converting volumes of natural gas to oil equivalent amounts, Baytex has adopted a conversion factor of six million cubic feet of natural gas being equivalent to one barrel of oil, which is based on
an energy equivalency conversion method primarily applicable at the burner tip and does not represent a value equivalency at the wellhead. Oil equivalent amounts may be misleading, particularly if
used in isolation.

Non-GAAP Financial Measures

This presentation refers to funds from operations, total monetary debt and operating netback, which do not have any standardized meaning prescribed by generally accepted accounting principles in
Canada ("GAAP"). We define funds from operations ("FFO") as cash flow from operating activities adjusted for financing costs, changes in non-cash operating working capital and other operating
items. We believe that this measure assists in providing a more complete understanding of certain aspects of our results of operations and financial performance, including our ability to generate the
cash flow necessary to fund future dividends to shareholders and capital investments. However, funds from operations should not be construed as an alternative to traditional performance measures
determined in accordance with GAAP, such as cash flow from operating activities and net income. Please refer to our most recent management's discussion and analysis of financial condition and
results of operations for a reconciliation of funds from operations to cash flow from operating activities.

 We define total monetary debt as the sum of monetary working capital (which is current assets less current liabilities (excluding non-cash items such as unrealized gains or losses on financial
derivatives)), the principal amount of long-term debt and long-term bank loans. Baytex believes that this measure assists in providing a more complete understanding of its cash liabilities.

We define operating netback as product sales price less royalties, production and operating expenses and transportation expenses divided by barrels of oil equivalent sales volume for the applicable
period. Baytex's determination of operating netback may not be comparable with the calculation of similar measures by other entities. We believe that this measure assists in characterizing our ability
to generate cash margin on a unit of production basis.

                                                                                                                                                                                                                  4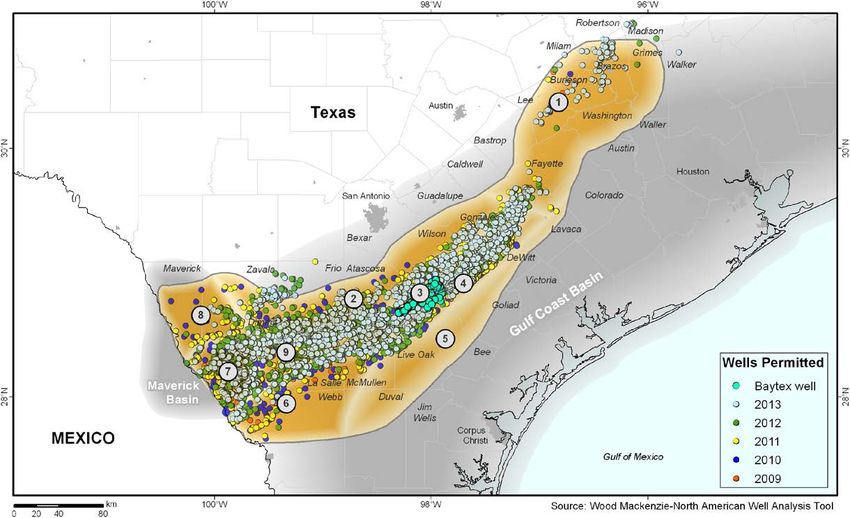
Baytex Key Attributes

                         Profitable Growth and Income

                            -   Focus on per share growth in production and reserves
  Production Growth         -   Production growth focused on crude oil and liquids
                            -   Significant inventory of development prospects

                            -   Sector leading capital efficiencies in three core resource plays: Eagle
                                Ford, Peace River and Lloydminster
  Capital Efficiencies
                            -   Strong capital efficiencies result in low sustaining capital; provides
                                flexibility on discretionary capital

                            -   Target to fund capital program and cash dividends from internally
                                generated funds from operations
    Sustainability
                            -   No near-term maturities on long-term debt; significant undrawn
                                capacity on existing credit facilities

                            -   Risk management policy allows hedging of up to 60% of financial
   Risk Mitigation              exposure
  Through Hedging           -   Mitigate the volatility in WCS price differentials by transporting crude
                                oil to higher value markets by rail

                                                                                                           55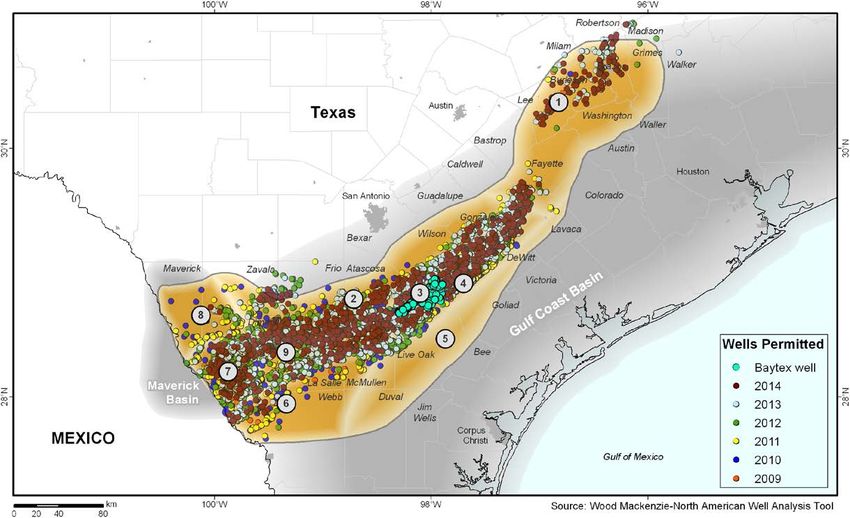
Corporate Profile

         Market Summary

      Ticker Symbol                                                                                             TSX / NYSE: BTE
      Average Daily Volume (1)                                                                                  Canada: 2,316,000/ U.S.: 630,610
      Shares Outstanding (Current)                                                                              167 million
      Market Capitalization / Enterprise Value                                                                  $5.4 billion / $7.7 billion
      Total Monetary Debt (2)                                                                                   $2.3 billion
      Monthly Dividend / Dividend Yield (3)                                                                     $0.24 per share / 8.8%

         Corporate Summary

      Production (4)                                                                                            90,500 boe/d
      Production Mix                                                                                            85% oil and liquids
      Reserves – 2P Gross (5)                                                                                   432 mmboe
(1)   Average daily trading volumes for October 1-28, 2014. Volumes are a composite of all exchanges in Canada and the U.S.
(2)   Total monetary debt as at September 30, 2014.
(3)   The dividend yield is calculated by dividing the annualized dividend of C$2.88 by the closing price of Baytex shares of C$32.57 on the TSX on November 7, 2014.
(4)   Production based on Q3/2014 actual results less contributions from asset sales.
(5)   Reserves per NI 51-101 as at December 31, 2013 and adjusted for the Eagle Ford acquisition and North Dakota asset sale. See “Advisory – Oil and Gas Information” for more information.

                                                                                                                                                                                               6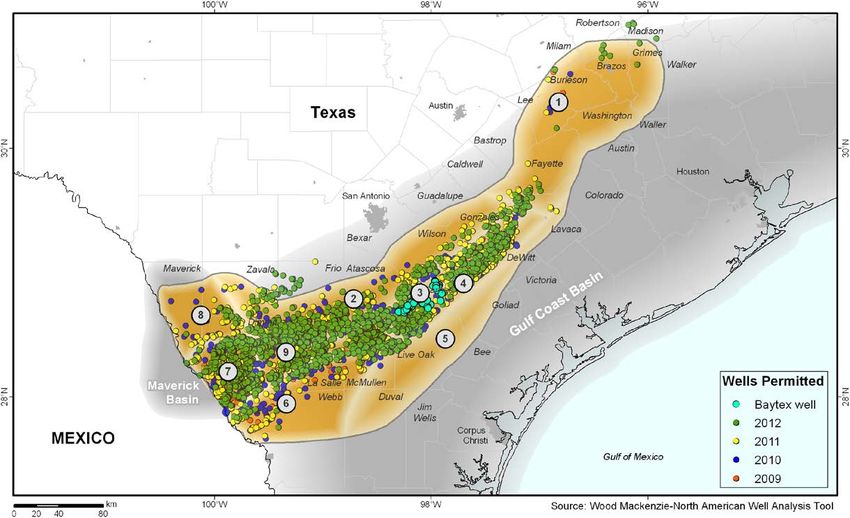
Three Key Resource Plays

           Eagle FordTexas                              Peace River
                           34%
- Q3/14 production ~ 34,000          - Q3/14 production ~26,000 boe/d
                                 Texas
  boe/d                           34%
                                     - 5+ year drilling inventory
                                                      Heavy Oil
                                                            51%
- 5+ year drilling inventory                Light Oil
                                     - ~ 25 to 30 net wells per year
                                              22%
- ~ 45-55 net wells per year
                                     - Developed via multi-lateral
- Actively developing the              horizontal wells
  Lower Eagle Ford formation
  in the core of the play            - One of highest rates of return
                                       projectsNGLs
                                                in North America
                                         Gas      17%     Texas
- Significant upside potential           14%               34%
  via further delineation of
  Austin Chalk/Upper Eagle                          Lloydminster
  Ford, ongoing completion
  design optimization and            - Q3/14 production ~20,000 boe/d
  down-spacing
                                     - 5+ year drilling inventory
                                     - ~ 80 to 100 net wells per year
                                                  North Dakota
                                                       4%
                                     - Conventional
                                        Lloydminster     heavyPeaceoilRiver
                                                                        targeting
                                       multiple
                                       Heavy Oil  stacked
                                                 36%
                                          Western Canada     pay
                                                             Heavy
                                                       Western     formations
                                                                   Oil
                                                               Canada   36%
                                                              66%
                                                63%
                                                                    Gas 10%
          Western Canada
               66%
                                     - Expanding
                                              Light Oiluse
                                                        18% of multi-lateral

                                 Texas
                                       drilling techniques with
                                  34% encouraging initial results

                                                                               7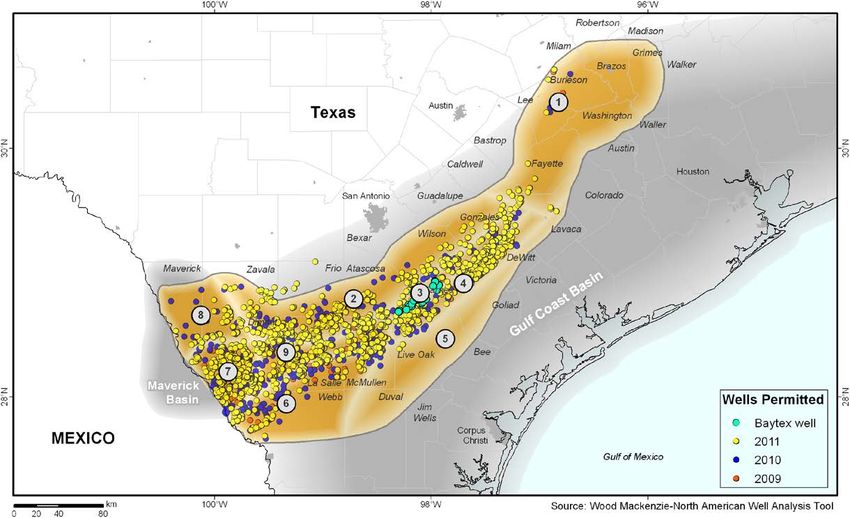
Production Growth

                                                                                                                             Production Breakdown
                                                                                                                               H2/2014 Guidance
    100,000                       Production CAGR = 13%                                    550
                                                                                                                              91,000 – 92,000 boe/d
                                                                                     530
                                  (per share CAGR = 7%)                                                                              NGLs
                                                                                                                             Gas      7%
        80,000                                                                             500                               15%
                                                                                                                                             Heavy Oil

                                                                                                 boe/d per thousand shares
                                                                                                                                               50%
                                                                   456                                                         Light Oil
                                                    443                                                                          28%
        60,000                                                                             450
                                                                                 77,500
                                    422
boe/d

        40,000       385                                                                   400
                                                                 57,196                                                        Production By Region
                                   50,132         53,986                                                                          Q3/2014 Actual
        20,000      44,341                                                                 350

                                                                                                                             United States
            0                                                                              300                                   36%
                     2010           2011           2012           2013           2014E                                                         Canada
                                                                                                                                                64%
 Oil (%)            79%             84%           87%             89%            85%

           2014E based on mid point of guidance range of 77,000 – 78,000 boe/d.
           Gas production converted at energy equivalence ratio of 1 boe per 6 mcf
                                                                                                                                                         8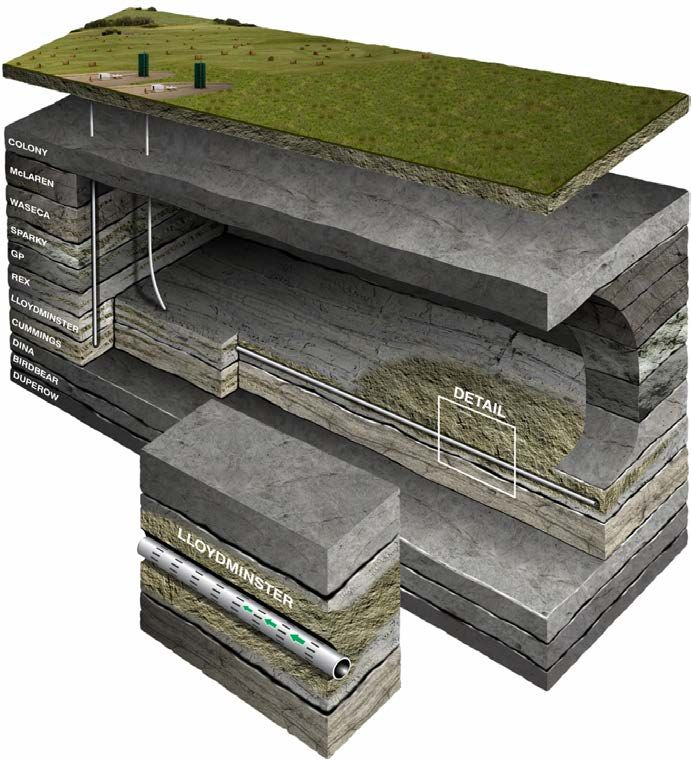
Reserves Growth / Contingent Resources
Reserve CAGR = 17% 2P Reserve Breakdown (1)
500 (per share CAGR = 8%) 3.0 Company Total = 432 MMboe
Gas NGLs
2.54 2.59 Heavy Oil
14%Gas
17%
2.40 53%
2.5 15%NGLs
400 NGLs 17%
Light Oil
2.14
2.01 Natural17%
Gas16%
2P Reserves (mmboe)
14%
boe per million shares
2.0 Heavy Oil
Heavy Oil
432 53% 53%
300
Light Oil
16%
1.5
200 318
1.0
292 Gas
14%
252
100 229
0.5 (2)
Economic Contingent Resources
Best
0 0.0 (Millions of barrels of bitumen) Estimate
(1)
2010 2011 2012 2013 2013 Adjusted
Peace River, Alberta 553
Oil (%) 91% 92% 93% 90% 86%
Northeast Alberta 125
Light Oil
RLI (yrs) (3) 13.1
13.9 13.0 14.5 14.9 Angling Lake,16%
Alberta 87
Total 764
(1) 2013 Adjusted Reserves as at December 31, 2013 including Eagle Ford acquisition and 2014 divestitures.
(2) Contingent Resource at December 31, 2013 adjusted for 2014 divestitures. See “Advisory – Oil and Gas Information for more information on contingent resources.
(3) RLI’s are based on Q4 production rate for each year. 2013 Adjusted RLI based on Q3/2014 production adjusted for divestitures. 9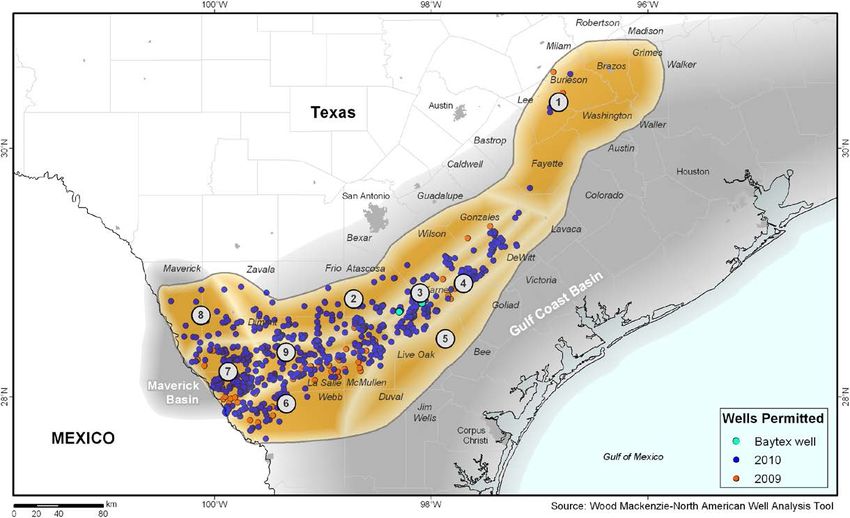
Type Curve Well Economics at US$80/bbl WTI (1)

                                                                                           Eagle Ford                           Peace River                         Lloydminster

      Formation                                                                      Lower Eagle Ford                                Bluesky                      Mannville Group
      Completion                                                                      Multi-Stage Frac                            Open Hole                       Hz Slotted Liner
      Well Cost ($ millions)                                                                   US$7.6                                    $3.4                                 $1.0

      Production (boe/d)
         IP30                                                                              800 - 1,000                              300 - 500                              70 - 80
         % Liquids                                                                                72%                                  100%                                 100%

      Single Well Economics:
         IRR (before-tax)                  (2)                                                    88%                                    80%                                  70%
         Payout (before tax)                                                                 1.1 years                              1.2 years                            1.5 years
         Capital Efficiency - $/boe/d (IP365)                                              US$16,000                                 $17,000                              $18,500

(1)   Baytex internal estimates. Pricing Assumptions: WTI = US$80/bbl, WCS heavy oil differential = 18% of WTI, FX rate = 1.12 (C$/US$)
(2)   IRR is a rate of return measure used to compare the profitability of an investment and represents the discount rate at which the net present value of costs equals the net present value of the
       benefits. The higher a project’s IRR, the more desirable the project. IRR as presented above is based on individual well economics and excludes acreage acquisition costs.                     10
Profit Investment Ratio (PIR)
0.0x
0.5x
1.0x
1.5x
2.0x
2.5x
3.0x
Woodenhouse Heavy - Vt
WTI of 20%.
Seal Cold Heavy Multi-Lateral
Ante Creek Montney (Tier 1)
SE Sask Viewfield Bakken
Musreau/Resthaven Montney
SE SK Frobisher/Alida
Dodsland Viking
Kaybob Montney Oil
SE Sask Border Torquay
Bantry Glauconite
Valhalla Doig
SW Sask Shaunavon (Upper)
Lloyd Heavy (Tier 1)
AB Bakken (east, shallow)
Eagle Ford - Karnes Condensate
Gordondale Montney Oil
Bilbo/Karr Montney Gas
PRA Montney Oil
Spirit River Charlie Lake Oil
Marcellus - PA (Dry Gas- Tier 1)
SE Sask Border Midale
Hoadley Glauconite (Tier 1)
Nesson Anticline Three Forks
Brazeau Belly River
Kaybob Duvernay (300 bbl/mmcf)
Baytex Plays
Garrington Cardium
Top 50 North America Resource Plays –
NE BC Montney
Pembina Notikewin/Falher
East Pembina Cardium
Ranking Based on Profit to Investment Ratio
Karr Dunvegan Oil
Elmworth Montney
Other Plays
SW Sask Shaunavon (Lower)
Lloyd (Regional) Heavy
Provost Heavy
Cold Lake Heavy
Kakwa Falher/Wilrich
Tower Montney Oil
Kaybob Duvernay (150 bbl/mmcf)
Pouce Coupe Montney/Doig Gas
Uinta Basin Green River/Wasatch
chart represents the Top 50 North American Resource Plays as ranked by Scotia Capital, as at September 2014 (in aggregate, Scotia Capital has
Lloyd (Regional) Heavy - Vt
ranked over 90 resource plays). Commodity assumptions: WTI oil US$81.00/bbl, NYMEX gas US$3.85/mcf (C$3.25/mcf), WCS heavy oil differential to
Redwater Viking
Profit to Investment Ratio is defined as the present value of the future cash flows (after-tax, 9% discount rate) divided by the initial investment. The above
11Balance Sheet Strength
Debt Composition Long -Term Debt Maturity Schedule
($ millions) ($ millions)
Credit Capacity $2.6 billion No material repayments required
until 2021
$616
$448
$300
$9 $0 $0 $7 $0
2017 2018 2019 2020 2021 2022 2023 2024
As at September 30, 2014.
12Funds from Operations Sensitivities
Estimated Effect on Estimated Effect on
Annual Funds Flow Annual Funds Flow
Sensitivities ($ Millions) (Per Share)
Change of US$1.00/bbl WTI crude oil $14.5 $0.09
Change of 1% WCS heavy oil differential $10.0 $0.06
Change of US$0.25/mcf NYMEX natural gas $6.0 $0.04
Change of $0.01 in the US$/C$ exchange rate $14.0 $0.08
13 13The Eagle Ford
14Eagle Ford Acreage Position
The Eagle Ford Provides Baytex With Exposure to a
World Class Oil Resource Play
Overview of Acreage
- 23,000 net contiguous acres in the
Sugarkane Field in the core of the
liquids-rich Eagle Ford shale.
- The Sugarkane Field has been
largely delineated which is
expected to facilitate future
production growth.
- Extensive infrastructure in place
across the acreage position,
including centralized processing
facilities, disposal wells and infield
gathering systems.
- 97% of acreage is held by
production
15Eagle Ford – Gas/Liquids Window Map
Nine Eagle Ford Sub-Play Areas
Eagle Ford Play
Eagle Ford Play
• Study based on production
information received from the Texas
Railroad Commission as of April
2014
• Over 8,500 wells included in the
analysis
• Excludes Austin Chalk, Olmos,
Pearsall etc.
Wood Mackenzie breaks the Eagle Ford into nine distinct sub-play areas: (1) Northeast Oil, (2) Black Oil, (3) Karnes Trough Condensate, (4) Edwards Condensate, (5) Southeast Gas,
(6) Southwest Gas, (7) Maverick Condensate, (8) Maverick Oil and (9) Hawkville Condensate. Baytex’s Eagle Ford acreage falls largely within the Karnes Trough sub-play area. 16Eagle Ford - Wells Completed 2009 to 2014
Wood Mackenzie breaks the Eagle Ford into nine distinct sub-play areas: (1) Northeast Oil, (2) Black Oil, (3) Karnes Trough Condensate, (4) Edwards Condensate, (5) Southeast Gas,
(6) Southwest Gas, (7) Maverick Condensate, (8) Maverick Oil and (9) Hawkville Condensate. Baytex’s Eagle Ford acreage falls largely within the Karnes Trough sub-play area.
17Eagle Ford – Sub Play Economics
Sub-Play Analysis Type Well Breakeven
Source: Wood Mackenzie.
Wood Mackenzie breaks the Eagle Ford into nine distinct sub-play areas: (1) Northeast Oil, (2) Black Oil, (3) Karnes Trough Condensate, (4) Edwards Condensate, (5) Southeast Gas,
(6) Southwest Gas, (7) Maverick Condensate, (8) Maverick Oil and (9) Hawkville Condensate. Baytex’s Eagle Ford acreage falls largely within the Karnes Trough sub-play area. Sub-play
analysis and type well break-even represents the entire acreage in the sub-play areas and may not be representative of Baytex’s Eagle Ford position.
18Eagle Ford Development
Development to date has targeted
the Lower Eagle Ford
- Originally developed at 80-acre spacing;
current development is now 60-acre
spacing (volatile oil) and 40-acre
spacing (condensate gas)
Extending Lower Eagle Ford /
Austin Chalk success
- YTD we are seeing an approximate
20% improvement in 30-day IP rates
- Eight Austin Chalk wells drilled in
Q3/2014 with 30-day IP rates of 800 to
1,300 boe/d
- Austin Chalk now delineated on
approximately 50% of our acreage
- Stack and Frac pilots to include Austin
Chalk, Upper Eagle Ford and Lower
Eagle Ford formations 19Heavy Oil Overview
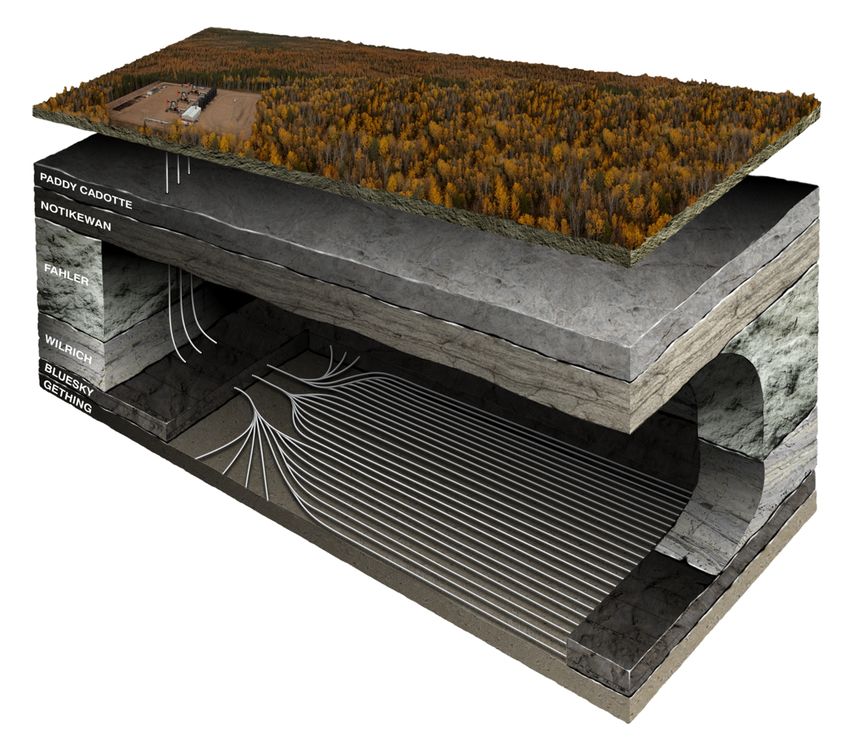
20 Peace River Oil Sands
Multi-Lateral Drilling Drives Strong Capital Efficiencies
Area Statistics
Land Holdings 308 net sections
Production (Q3/2014) 26,000 bbl/d
2P Reserves (YE13) (1) 114 mmbbls
Drilling Inventory (2) ~ 5 years
(1) 2P Reserve breakdown = 67 million barrels
(primary) and 47 million barrels (thermal).
(2) Drilling inventory in years based on identified
drilling locations (cold horizontal multi-lateral
wells) and 2014 drilling plans.
2014 Development
2014 Drilling Program ~ 30 multi-lateral
horizontal wells
28 stratigraphic
and service wells
21 Multi-Lateral Cold Horizontal Wells
Reservoir Characteristics (1)
Formation Bluesky
Depth ~ 600 metres
Completion Open Hole
Oil Quality 11 °API
Average Porosity 28%
Permeability 1 - 5 darcies
Oil Saturation 70%
Recovery Factor 5 - 7%
Well Economics at US$80/bbl (1)
Well Design ~ 12 laterals
Completed Well Cost ~ $3.4 MM
Production (IP30) ~ 400 bbl/d
IRR (before tax) 80%
Payout 1.2 years
80% Rate of Return at Capital Efficiency $17,000
US$80/bbl WTI Crude (based on IP365) per boe/day
Oil Price (1) Baytex internal estimates.
22Lloydminster
Lloydminster Heavy Oil Heavy Oil
Shift to Horizontal Drilling Expands Inventory
Area Statistics
Land Position 730 net sections
Production (Q3/2014) 20,000 boe/d
2P Reserves (YE13) (1) 114 mmbbls
Drilling Inventory (2) ~ 6.5 years
(1) Includes SAGD projects at Gemini (44 million barrels) and
Kerrobert (12 million barrels)
(2) Drilling inventory in years based on identified drilling locations
and 2014 drilling plans.
2014 Development
Drilling ~ 95 net wells
% Horizontal/Vertical 73% / 27%
23Lloydminster Development
Reservoir Characteristics (1)
Formation Mannville Group
Depth 350 – 800 metres
Completion Horizontal Slotted Liner /
Vertical Stacked Pays
Oil Quality 11 – 18 °API
Average Porosity 30%
Permeability 0.5 – 5.0 darcies
Oil Saturation 70%
Horizontal Well Economics at US$80/bbl (1)
Completed Well Cost $950,000
Production (IP30) 70-80 bbl/d
IRR (before tax) 70%
Payout 1.5 years
Capital Efficiency $18,500
Increased Multi-Lateral Drilling at (based on IP365) per bbl/day
Lloydminster is Leading to an ~ 20% (1) Baytex internal estimates.
Improvement in Capital Efficiencies 24Crude Oil Marketing
2014: A Break Out Year for Canadian Heavy

- Market conditions remain positive with the forward market indicating
  a WCS differential of ~ 16% for Q4/2014

- Positive catalysts in 2014 are contributing to lower differentials and
  stronger heavy oil pricing
   - BP Whiting repositioning adds ~ 250,000 bbl/d of heavy oil demand
   - Enbridge Flanagan South pipeline; capacity of 585,000 bbl/d
   - Enbridge mainline capacity showing substantial gains in 2014
   - Rail capacity of Canadian crude increases with new projects targeting
     Q4/2014 and Q1/2015 start-up
   - Line 9 reversal (Sarnia to Montreal) adds incremental end-use refiner demand
Heavy Oil Differential – WCS and Maya
27Oil Marketing Portfolio
Q4 2014 Heavy Oil Sales Portfolio WTI Financial Hedging
Q4 / 2014
% Hedged 51%
Fixed Price US$96.45/bbl
Q1/ 2015
% Hedged 45%
Fixed Price US$96.54/bbl
FY 2015
% Hedged 24%
Fixed Price US$94.66/bbl
Percentage of hedged volumes are based on
2014 production guidance, net of royalties
(i.e. hedgeable volumes). See notes to
Heavy Oil Sales Portfolio based on anticipated sales volumes for financial statements for individual contracts.
Q4/2014, as at October 28th, 2014
28Why Invest in Baytex
Superior Asset Base Income Payout Proven Track Record
- Low risk inventory – oil - Committed to paying a - Sophisticated risk
focus meaningful dividend management
- Sector leading capital - Over $1.7 billion distributed - Significant credit capacity
efficiency to shareholders in the last
10 years - Highly regarded
- Significant development management team
upside - Conservative payout ratio
- Long-term track record of
- Defined long range plan value creation
Production (mboe/d) 2P Reserves (mmboe)
300
50
200
25
100
0 0
2006 2007 2008 2009 2010 2011 2012 2013 2006 2007 2008 2009 2010 2011 2012 2013
29Contact Information
Suite 2800, Centennial Place James L. Bowzer
520 – 3rd Avenue S.W. President & Chief Executive Officer
Calgary, Alberta T2P 0R3 (587) 952-3000
T: (587) 952-3000 1-800-524-5521
Rodney D. Gray
www.baytexenergy.com Chief Financial Officer
(587) 952-3160
Brian G. Ector
Senior Vice President, Capital Markets
and Public Affairs
(587) 952-3237You can also read