Australian agriculture - Rural Bank
←
→
Page content transcription
If your browser does not render page correctly, please read the page content below
2020   Australian
       agriculture
       mid-year outlook
Executive summary
                Cattle                                                  Cropping                                            Dairy
                A rainfall driven switch to                             Following the best start                            A lower cost of production
                herd rebuilding to tighten                              to the winter cropping                              will promote supply
                supply and support high                                 season in several years, an                         growth and aid profitability
                cattle prices.                                          increase in production and
                                                                        lower prices are expected.

                Horticulture                                            Sheep                                               Wool
                There will be challenges                                Producers to benefit                                The Australian wool
                to the foodservices                                     from favourable seasonal                            industry will face some
                industry and a period of                                conditions and high prices.                         significant challenges over
                softer prices.                                                                                              the next six months.

 The first half of 2020 has been one of the most disruptive in a                  Unfortunately, lower consumer spending is significantly impacting the
 generation – from devastating summer bushfires to the upheaval                   wool industry. The Australian wool market is expected to remain under
 caused by COVID-19. Despite this, for many regions 2020 has been                 pressure for the remainder of this year, as global demand remains
 one of the best starts on record. Favourable seasonal conditions are             stagnant.
 resulting in cattle farmers starting to rebuild herds, good seasonal
                                                                                  COVID-19 has not been the only disruptive force this year. The
 conditions for horticulture and an increase in production in cropping.
                                                                                  increased tariffs on barley exports to China have effectively priced
 Rural Bank’s Australian agriculture mid-year outlook looks at the driving        out Australian barley from this critical market. While there are now
 forces affecting agricultural markets over the coming six months.                opportunities to trade with other markets such as Japan and Saudi
 Focusing on the future of supply, demand and price, the Outlook covers           Arabia, these markets are more price sensitive and this will likely flow
 agriculture by commodity to provide farmers with a useful overview of            through to values at the farm gate.
 the current environment and importantly, what could come next.
                                                                                  These escalating trade tensions have drawn focus to Australia’s reliance
 Our 2019 mid-year outlook stated that a return to favourable seasonal            on a single market with emphasis now on exploring options with
 conditions would result in a dramatic change in pace for many in                 alternative countries.
 agriculture. High rainfall across much of eastern Australia is now
                                                                                  African Swine Fever continues to shape the outlook for the protein
 leading that change, away from prolonged drought. Forecasts are for
                                                                                  market. A significant protein gap exists in China which is aiding demand
 favourable seasonal conditions to continue for much of the country.
                                                                                  for Australian beef and lamb. Strong competition from countries such as
 These improved conditions are likely to increase growth in supply in fruit       Brazil and the United States is likely to increasingly affect demand for
 and vegetables as producers recover from shortages caused by drought             Australian proteins, particularly in late 2020 and into 2021.
 and bushfire. Seasonal conditions are also helping boost supply levels
                                                                                  As an agricultural specialist lender, Rural Bank understands that issues
 in milk, cereals, canola and wool, and driving restocking activity for cattle
                                                                                  impacting farm business’ performance can evolve quickly and farmers
 and sheep. Dairy farmers in Victoria and Tasmania have had exceptional
                                                                                  are operating in a sometimes-unpredictable environment – which is why
 conditions, and pasture growth will lead to an increase in milk supply
                                                                                  we want to support them with a regular forecast for their industry.
 this year.

 Consumer behaviour has undergone a seismic shift due to COVID-19
 and the associated social distancing measures. The foodservice
 industry has been one of the hardest hit, with demand from cafes and
 restaurants expected to remain subdued, despite the possible easing
 of restrictions in 2020. In comparison, in-home consumption has
 increased, as has a focus on healthy immune boosting foods.

2                                                            AUSTRALIAN AGRICULTURE MID-YEAR OUTLOOK 2020
Economic outlook
Australia has entered its first recession in 29 years, following the Despite a more positive outlook, Australia is still facing its largest
announcement that Australia has seen negative gross domestic economic contraction since the 1930’s, and therefore recovery is
product (GDP) growth in the first quarter of this year for the first time coming from a very low base. Both business and consumer confidence
since 2011. plummeted since the pandemic began and the demand for higher value
items, including food, may be slow to pick up.
Australia and the rest of the world is now in the process of recovering
from the initial shock(s) of the COVID-19 pandemic, notwithstanding The COVID-19 outbreak, and the economic impacts thereof, have all but
the threat of further outbreaks. The speed of this recovery will depend officially ensured that low interest rates are here to stay. Any move away
on the extent to which the virus is able to be controlled and restrictions from low interest rates is likely to be many years away, with Australian
are able to be lifted. government 10-year bond yields still siting below one per cent.
Modelling by the Reserve Bank of Australia (RBA), in its most recent The Australian dollar has recovered ahead of earlier expectations,
Statement on Monetary Policy, presented a base case of Australia rising back above the 70 US cent level. Assuming the pace of Australia’s
returning to positive growth during the third quarter of 2020 and back recovery outperforms other countries, particularly the United States, there
to pre-COVID-19 levels in the early stages of 2022. may be limited scope for a lower Australian dollar below 60 US cents
in the second half of this year, limiting the ability of the Australian dollar
An upside scenario shows a return to pre-COVID-19 GDP by the end
to support an uptick in farmgate prices for agricultural products.
of this year while the downside scenario includes a return to growth
later during the fourth quarter of 2020. Markets had initially been drawn Farmland values have been resilient following several years of
to more pessimistic scenarios but are now leaning to the upside as the challenging seasonal conditions. We expect growth in the value
economy reopens. of Australian farmland to continue over the long-term as ongoing
improvements in Australian agricultural productivity and profitability
The recovery in the unemployment rate looks as though it will be a
fuel strong demand for agricultural assets.
longer process, with only the upside scenario showing unemployment
getting back to pre-COVID-19 levels by 2022 although fears of a rise While factors such as strong commodity prices, a low interest rate
to 10 per cent unemployment are also being wound back, with eight environment and tight supply of land support strong demand for
per cent now the consensus. farmland in the short-term, this will be tempered by disruptions to global
economies. We expect farmland values to continue to grow but at a
reduced rate compared to the growth seen in the past six years.
Australian farmland values –
Australian dollar exchange rate historic performance
0.85 $6,000 16,000
0.80 14,000
$5,000
12,000
0.75
$4,000
10,000
AUD/USD
0.70
$3,000 8,000
0.65
6,000
$2,000
0.60
4,000
0.55 $1,000
2,000
0.50 0 0
Dec 15
Mar 16
Jun 16
Sep 16
Dec 16
Mar 17
Jun 17
Sep 17
Dec 17
Mar 18
Jun 18
Sep 18
Dec 18
Mar 19
Jun 19
Sep 19
Dec 19
Mar 20
Jun 20
1995
1997
1999
2001
2003
2005
2007
2009
2011
2013
2015
2017
2019
Median price $/ha (LHS) Number of transactions (RHS)
Source: RBA
Source: Pricefinder, Rural Bank
3 AUSTRALIAN AGRICULTURE MID-YEAR OUTLOOK 2020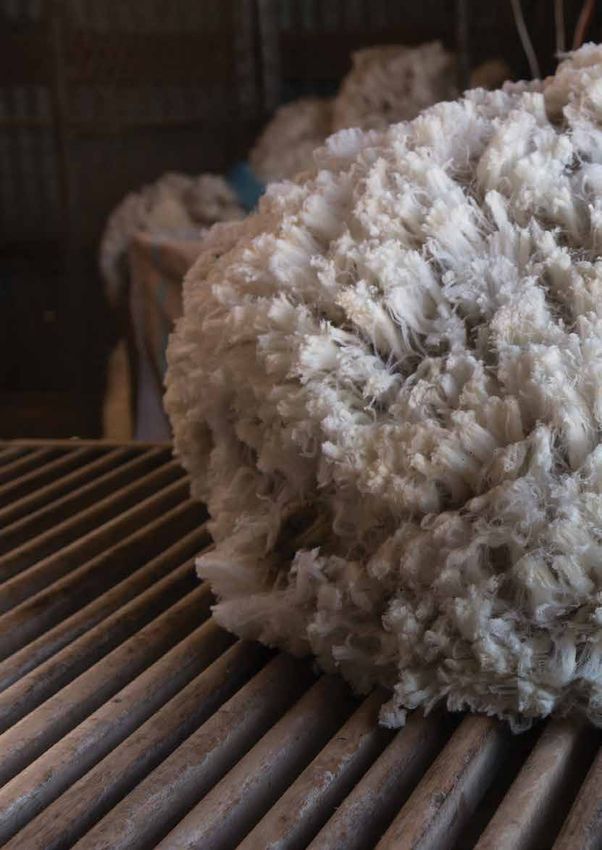
Cattle

    The fundamentals of the Australian cattle
    industry indicate support for exceptionally
    high prices for the remainder of 2020.
    Improved seasonal conditions will
    support herd rebuilding, which will in turn
    lead to a tightening of supply and strong
    restocker demand.
    Donna Slevin, Rural Bank, Victoria

4                                  AUSTRALIAN AGRICULTURE MID-YEAR OUTLOOK 2020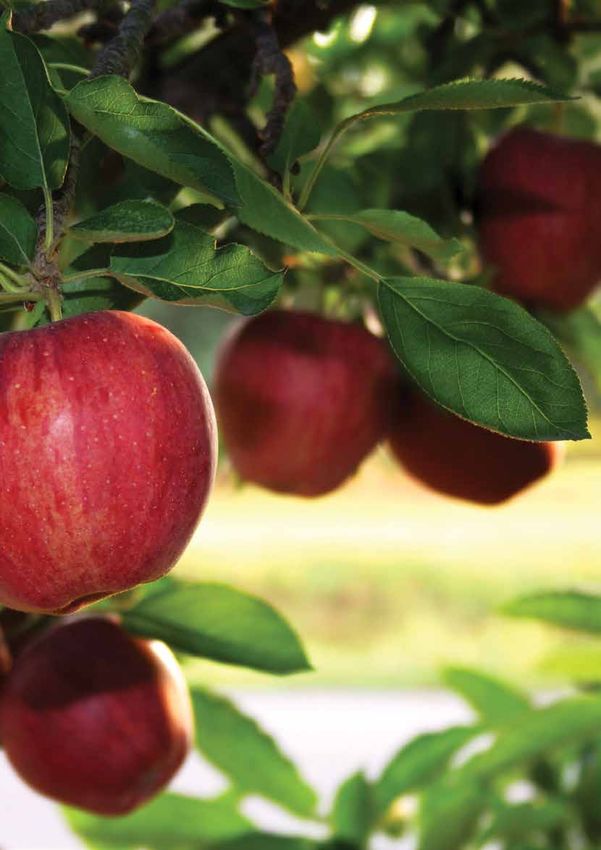
Cattle
Supply Price
Australian beef production in to be 23 per Eastern Young Cattle Indicator (EYCI) to be
cent lower in the 2nd half of 2020 than the well supported between 750–800c/kg activity.
same time last year.
Demand Outlook
Continued strong restocker demand and A rainfall driven switch to herd rebuilding to
improving consumer demand to support tighten supply and support high cattle prices.
high prices.
Supply
Tight supply will be the defining characteristic of the Australian cattle market
in the second half of 2020 as production will be restricted by the smallest Eastern Young Cattle Indicator forecast
900
national herd since 1992. Producers are seeking to retain stock to begin herd
rebuilding in response to favourable seasonal conditions in eastern Australia. 800
These factors have contributed to the lowest annual beef production since 2000 700
and a forecast decline in beef production of 23 per cent in July to December 600
compared the same time last year.
c/kg cwt
500
Offshore, beef production in the United States has recovered quickly after being 400
severely disrupted by COVID-19 in April and May. United States production and 300
export volumes in the second half of 2020 are expected to be 1.3 per cent and
2.3 per cent lower than last year, respectively.
200
5 YEAR
DECILE 9.9
100
Demand 0
Dec 14
Jun 15
Dec 15
Jun 16
Dec 16
Jun 17
Dec 17
Jun 18
Dec 18
Jun 19
Dec 19
Jan 20
Dec 20
If average rainfall continues, producers with abundant pasture supplies and
depleted breeding herds will be eager to acquire stock. As a result, demand
for cattle from re-stockers is expected to remain strong, particularly in eastern
states. Monthly average EYCI values forecast at 68 per cent
confidence interval.
Foodservice demand is likely to remain restricted for some time, particularly Source: Meat and Livestock Australia (MLA), Rural Bank
at the higher-value end of the market, but a staggered easing of COVID-19
restrictions will reduce some of the pressure the market has been under
since March. This is expected to support demand from processors and overall
carcass values.
Value of Australian beef exports
Export demand from key Asian markets is expected to strengthen. Demand is 900
expected to remain particularly strong from China as beef imports play a role
800 2019
in filling the 20 to 25 million tonne gap created by reduced pork production
700 2020
resulting from African Swine Fever. However, a 27 per cent decline in export
volumes is forecast in the second half of the year due to a fall in Australian 600
AUD (millions)
beef production. 500
Australian beef exports to Japan and South Korea are likely to experience 400
increased competition from increasing volumes of cheaper beef coming from 300
the United States later in 2020 and into 2021 as processors work through a 200
backlog of cattle resulting from processing disruption in April and May. 100
0
Price
China Japan US South Indonesia Others
The Eastern Young Cattle Indicator (EYCI) is forecast to remain above Korea
750c/kg CWT for the remainder of 2020 and could rise to 800c/kg if
January to April beef exports show year-on-year growth
average to above average rainfall in spring drives stronger restocker demand. in value to all major markets.
Prices will remain supported around record high levels by tight supply, strong Source: Global Trade Atlas, Rural Bank
restocker demand and recovering consumer demand in Australia and abroad.
5 AUSTRALIAN AGRICULTURE MID-YEAR OUTLOOK 2020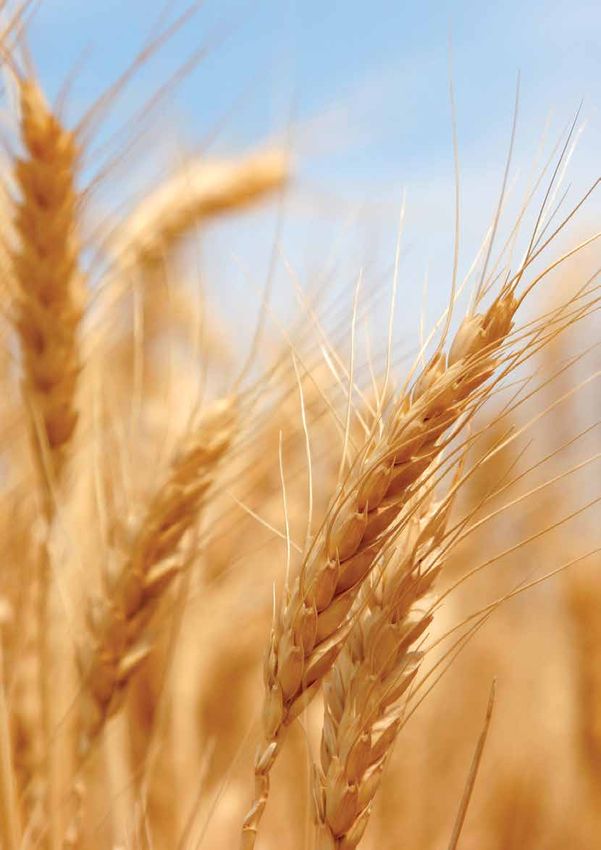
Cropping

    Winter cropping areas (on aggregate)
    have enjoyed their best start to the
    season in several years, buoying hopes
    of a turnaround in the cropping sector’s
    fortunes. As a result, grain markets
    are pricing in a much lower level of
    production risk, compared to recent
    years resulting in a softer price outlook
    year-on-year. The largest unknown looks
    to be how grain markets will deal with an
    expected reduction in China’s demand
    for Australian barley.
    Greg Kuchel, Rural Bank, Victoria

6                                 AUSTRALIAN AGRICULTURE MID-YEAR OUTLOOK 2020
Cropping
                 Supply                                                                      Price
                 After several dry years, a rebound in Australian                            Increased supply and softer demand look set
                 production back to at least average levels is                               to drive lower prices.
                 expected this year.

                 Demand                                                                      Outlook
                 Domestic demand is expected to soften in the                                Following the best start to the winter cropping
                 back half of this year.                                                     season in several years, an increase in production
                                                                                             and lower prices are expected.

 Cereals
 Supply                                                                          Price
 Winter cereal production in Australia is expected to return to average,         After successive years of poor production, a return to average
 if not above average production this year. At present, wheat production         conditions will see Australian wheat prices more closely align with world
 is expected to increase by 59 per cent, year-on-year and six percent            markets this coming season. The impact of this is local prices will show
 above five-year averages. Australian barley production is forecast to rise      a much smaller premium (if any) over offshore prices, adding downward
 two percent year-on-year, however, remain two percent below five-year           pressure to domestic values.
 averages.
                                                                                 Offshore wheat values are expected to remain within current ranges
 Favourable weather is forecast for spring. If this eventuates, it is possible   (between five and 25 per cent above the five-year average) between
 that current production estimates will be exceeded.                             now and the end of the year. This is largely attributable to seasonal
                                                                                 Northern Hemisphere harvest pressures.
 Looking offshore, another year of record wheat production is again
 forecast for the coming season, driven by Australian production. European       The combination of flat offshore values, and smaller domestic premiums
 Union (EU) wheat production is expected to decrease seven per cent              is expected to see Australian wheat prices fall ten to twenty per cent
 year-on-year due to dry conditions across most EU cropping regions.             over the coming six-month period.
 The all-important Black Sea area is expecting mixed fortunes. Production
                                                                                 Barley values on the other hand are expected to remain flat and are
 in Russia and Kazakhstan is tipped to increase by four and 15 per cent
                                                                                 already trading at a significant discount to wheat. Unless exports to
 respectively, whilst the Ukraine looking at a four per cent decline.
                                                                                 destinations other than China pick up markedly, should the market look
                                                                                 to close the gap between wheat and barley values, this is more likely to
 Demand
                                                                                 manifest through weaker domestic wheat prices than further support
 An expected uptick in world wheat end stocks indicates that global              for barley prices.
 supply is again expected to out strip demand this season.

 In terms of domestic feed demand, cattle on feed numbers continue to
 decline from record highs and improved seasonal conditions have already
 reduced demand for supplemental feeding.

 The announcement that China will place 80.5 per cent tariffs on
 Australian feed barley will price Australian barley out of what has
 become its most important export market.

 In order to find demand in alterative markets such as Saudi Arabia
 (the world’s largest barley importer) and Japan, Australian feed barley
 will need to price itself appropriately meaning lower farmgate prices,
 compared to recent seasons.

 All these factors point to softer overall demand for cereals over the
 coming period.

7                                                              AUSTRALIAN AGRICULTURE MID-YEAR OUTLOOK 2020
Cropping
Geelong APW1 wheat price forecast Port Adelaide feed barley price forecast
500 450
450 400
400 350
350
300
AUD/tonne
AUD/tonne
300
250
250
200
200
150
150
100
50
5 YEAR
DECILE 5.9 100
50
5 YEAR
DECILE 5.1
0 0
Dec 14
Jun 15
Dec 15
Jun 16
Dec 16
Jun 17
Dec 17
Jun 18
Dec 18
Jun 19
Dec 19
Jan 20
Dec 20
Dec 14
Jun 15
Dec 15
Jun 16
Dec 16
Jun 17
Dec 17
Jun 18
Dec 18
Jun 19
Dec 19
Jan 20
Dec 20
Monthly average Geelong APW1 wheat values forecast at Monthly average Port Adelaide feed barley values forecast
68 per cent confidence interval. at 68 per cent confidence interval.
Source: Profarmer Australia, Rural Bank Source: Profarmer Australia, Rural Bank
Kwinana canola price forecast Brisbane chickpea price forecast
700 1,400
650 1,200
600
1,000
550
AUD/tonne
AUD/tonne
800
500
600
450
400
400
350
5 YEAR
DECILE 8.1 200
5 YEAR
DECILE 3.9
300 0
Dec 14
Jun 15
Dec 15
Jun 16
Dec 16
Jun 17
Dec 17
Jun 18
Dec 18
Jun 19
Dec 19
Jun 20
Dec 20
Dec 14
Jun 15
Dec 15
Jun 16
Dec 16
Jun 17
Dec 17
Jun 18
Dec 18
Jun 19
Dec 19
Jan 20
Dec 20
Monthly average Kwinana non-GM canola values forecast at Monthly average Brisbane chickpea values forecast at
68 per cent confidence interval. 68 per cent confidence interval.
Source: Profarmer Australia, Rural Bank Source: Profarmer Australia, Rural Bank
Oilseeds Pulses
Australian canola production is expected to rebound, up 26 per cent Year-on-year, production is forecast to increase for faba beans up
year-on-year, with current production forecasts showing a minimal one 10 per cent, field peas 13 per cent, lentils 15 per cent and lupins seven
per cent variation from the five-year average. per cent, however the size of these increases will all be dwarfed by
chickpeas, with production set to more than triple.
In Australian canola’s largest export market, the European Union, dry
conditions are expected to see canola production come in 14 per cent With Queensland having had a drier start to the winter cropping season
below the five-year average. The world’s largest canola producer, Canada, than other states, chickpeas have been the preferred crop in many
are currently looking at production in line with the five-year average. rotations, given their taproot systems giving crops the ability to take
advantage of lower level soil moisture. A decline in planted area in
Australian canola prices have already come off the highs seen earlier
Canada and the US may open up some additional opportunities for
this year. Given the rebound in domestic production, we expect prices to
Australian chickpeas.
hover between flat and ten per cent lower over the coming six months.
The announcement that India will lower import tariffs on Australian
In terms of global oilseed markets more broadly, US soybean values
lentils from 33 per cent to 10 per cent will help new crop exports, with
continue to come under pressure as a result of ongoing tensions
prices having already picked up accordingly.
between the US and China. A sustained uplift in US / China soybean
trade is required for sustained support for soybean values to flow into Canadian planted area to lentils is steady to a touch higher, year-on-year,
other oilseed markets. and current forecasts point to an average to above average monsoon
season in the subcontinent. In the absence of a deterioration in conditions
in either of these areas, it will be difficult for lentil prices to move too far
beyond current levels.
8 AUSTRALIAN AGRICULTURE MID-YEAR OUTLOOK 2020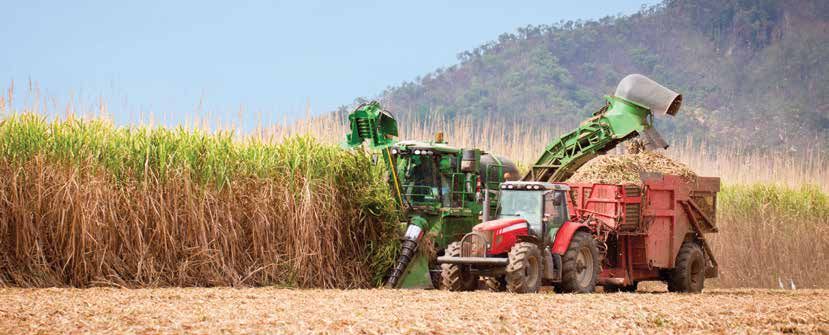
Dairy

    Local milk supply is likely to rise
    over the next six months driven
    by; improved seasonal conditions,
    cheaper feed costs, and robust
    milk prices. Global inventory levels
    will remain elevated as a result of
    COVID-19 interventions, this will keep
    negative pressure on finished product
    prices in the second half of 2020.
    Josie Zilm, Rural Bank, Victoria

9                                      AUSTRALIAN AGRICULTURE MID-YEAR OUTLOOK 2020
Dairy
Supply Price
Milk supply to increase by 4–5 per cent. Milk price to remain below last season and
international markets to remain weaker.
Demand Outlook
Cheese exports to increase however milk A lower cost of production will promote supply
powder is expected to decline. growth and aid profitability.
Supply Price
Australian milk production is forecast to increase four to five per cent over There is a sense of optimism and confidence around opening farm
the coming year driven by improved seasonal conditions, cheaper feed gate milk prices for the 2020–21 season, particularly in the context
costs and a focus on increasing herd numbers. of the past 12 months and the economic uncertainty facing markets.
Based on announcements from major processors the mid-point
Exceptional seasonal conditions in Victoria and Tasmania has led to
for the season will be approximately $6.20–6.60/kg MS, which in
vigorous pasture growth in the first half of 2020 this has put an emphasis
historical terms ranks at a decile 7.8. Early estimates of a closing
on increasing herd numbers which will ultimately lead to an increase in
price between $6.70–6.90/kg MS, suggesting step-ups could occur
milk supply in the second half of the year.
later in the season if market conditions improve.
Offshore, milk supply growth is expected to be flat in the European Union
In international markets both milk powder and cheddar prices are
and New Zealand. While in the United States an increase of 1.7 per cent
expected to remain under pressure as global stocks increase and
is forecast. Overall global milk supply is expected to be slightly higher
government intervention eases in the second half of the year which
which will keep pressure on prices.
is expected to increase supply on the world market.
Demand
Australian milk processors are competing for additional milk to enhance
factory efficiency this season. This has resulted in robust opening
prices. However, domestic demand for dairy products is expected to
remain flat driven by a relatively inelastic consumer base.
Offshore, the demand outlook for Australian products is mixed. Most
of the forecast additional milk supply is expected to be processed
into cheese for export into Asia to satisfy strong demand, cheese
exports are forecast to increase 9.4 per cent in 2020. In contrast skim
milk powder exports are forecast to decline 1.9 per cent driven by
COVID-19 supply chain disruptions in China.
Cheddar price forecast Skim milk powder price forecast
8,000 6,000
7,000
5,000
6,000
4,000
5,000
AUD/tonne
AUD/tonne
4,000 3,000
3,000
2,000
2,000 5 YEAR
DECILE 6.5 1,000
5 YEAR
DECILE 8.7
1,000
0 0
Dec 14
Jun 15
Dec 15
Jun 16
Dec 16
Jun 17
Dec 17
Jun 18
Dec 18
Jun 19
Dec 19
Jan 20
Dec 20
Dec 14
Jun 15
Dec 15
Jun 16
Dec 16
Jun 17
Dec 17
Jun 18
Dec 18
Jun 19
Dec 19
Jan 20
Dec 20
Monthly average global dairy trade (GDT) cheddar prices Monthly average GDT skim milk powder prices forecast at
forecast at 68 per cent confidence interval. 68 per cent confidence interval.
Source: GDT, Rural Bank and USDA
10 AUSTRALIAN AGRICULTURE MID-YEAR OUTLOOK 2020Horticulture
Favourable seasonal conditions are
expected to boost the supply of fruit and
vegetables over the next six months.
However, demand from the foodservices
industry is likely to remain subdued due
to COVID-19 restrictions. Domestic
prices are expected to decline on the
back of increased supply and softer
demand. Export demand remains robust
despite COVID-19 restrictions and
freight disruptions. Particularly for fruit,
driven by consumer demand for immune
boosting foods.
John Reilly, Rural Bank, Western Australia
11 AUSTRALIAN AGRICULTURE MID-YEAR OUTLOOK 2020Horticulture
Supply Price
Favourable seasonal conditions are likely to Higher supply will likely lead to softer prices in
lead to increased production in the second the second half of 2020.
half of 2020.
Demand Outlook
Foodservice demand to rebound slowly. There will be challenges to the foodservices
Export demand remains robust. industry and a period of softer prices.
Fruit
Hass avocado prices are expected to ease by 15–20 per cent in the Fruit price index forecast
second half of the year compared to the same time last year, reflecting 120
increased supply but also a decline in demand from the foodservice
sector. Supply is forecast to increase ten percent year-on-year as new 110
trees come into production. Export volume is expected to increase over
Index 100=2011–12
the next six months driven by increased supply and strong demand from 100
Hong Kong and Singapore.
90
Orange production is expected to be two per cent lower this season,
drought and high-water prices have contributed to a smaller crop of 80
high quality medium sized fruit. Domestic and export demand remains
strong as consumers turn to oranges for their immune boosting qualities 70
amid COVID-19. Export volumes are expected to remain stable with the
60
potential for higher prices.
Dec 14
Jun 15
Dec 15
Jun 16
Dec 16
Jun 17
Dec 17
Jun 18
Dec 18
Jun 19
Dec 19
Jan 20
Dec 20
In contrast, lime production is expected to increase this season as new
plantings come into production. However, farmers have left some fruit
on trees as the industry is impacted by decreased demand from the Monthly average fruit price index forecast at 68 per cent
foodservice sector due to COVID-19. Price is expected to remain around confidence interval.
30 per cent below the long-term average.
Apple production is expected to be slightly lower this season due to
drought and bushfires on the east coast. However, demand is expected
to remain steady driven by in-home consumption and health conscious
consumers. Domestic prices are expected to remain around 15 per Vegetable price index forecast
cent higher than 2019. India could be a growth market for Australian 140
apples this year due to the approval of in-transit cold treatment. India 130
imports approximately 250,000 tonnes of apples each year which in the
120
Index 100=2011–12
past have mainly come from China and the US. However, strained trade
relationships with both countries has led India to look at other apple 110
producing nations. 100
Vegetables 90
Favourable seasonal conditions on the east coast are expected to 80
prompt a high rate of sowing which could lead to an increase in supply 70
for a number of vegetables in the second half of 2020, putting pressure
60
on prices.
Dec 14
Jun 15
Dec 15
Jun 16
Dec 16
Jun 17
Dec 17
Jun 18
Dec 18
Jun 19
Dec 19
Jan 20
Dec 20
Broccoli and cauliflower prices are expected to ease in the coming
months as production on the east coast catches up to the supply
shortage driven by drought, bushfires and COVID-19. Monthly average vegetable price index forecast at 68 per
cent confidence interval.
Decreased demand for potatoes from the foodservice sector in Source: Australian Bureau of Statistics (ABS), Rural Bank and
Australia combined with the threat of cheap imports could lead to Ausmarket Consultants.
fewer plantings in the second half of the year. Potato producers are
facing contract uncertainty as processors take a cautious approach to
the recent announcement that the Australian market is in the sights
of European producers. A glut of french fries caused by COVID-19
shutdowns across Europe led governments to intervene, propping up
the industry with subsidies.
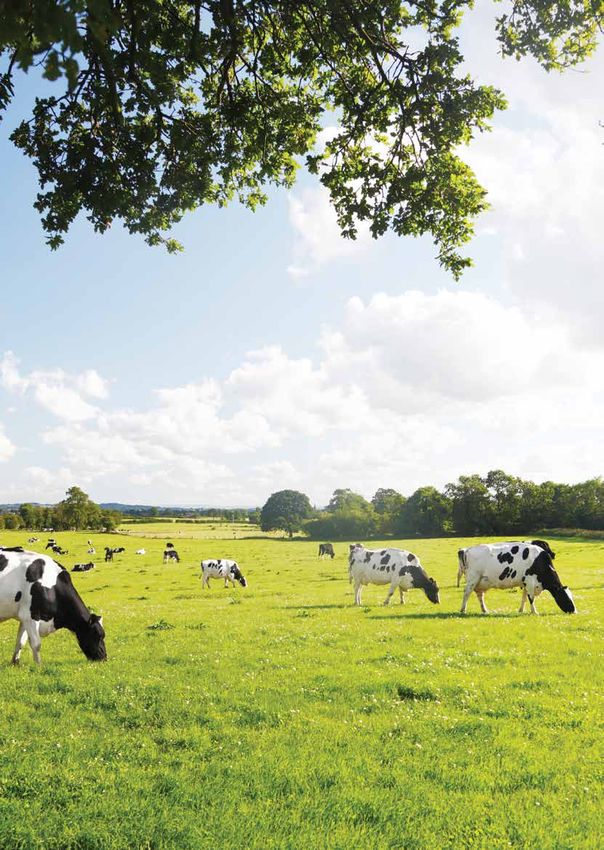
12 AUSTRALIAN AGRICULTURE MID-YEAR OUTLOOK 2020Sheep
Australian sheep producers are well
placed to benefit from sustained high
prices driven by below average supply
and relatively strong export demand,
despite headwinds from COVID-19.
Improved seasonal conditions in 2020
will continue to give confidence to
producers to rebuild breeding flocks
and expand production in coming years.
Tony Williams, Rural Bank, New South Wales
13 AUSTRALIAN AGRICULTURE MID-YEAR OUTLOOK 2020Sheep
Supply Price
Australian lamb production to remain Lamb and mutton prices to be supported above
steady year-on-year but below average. levels from 2019.
Demand Outlook
Strong restocker demand and improving, Producers to benefit from favourable seasonal
albeit subdued consumer demand. conditions and high prices.
Supply
Australian lamb production in the second half of 2020 is expected to Eastern States
track closely to the below average levels seen last year. Slaughter is Trade Lamb Indicator forecast
forecast to be 1.6 per cent lower than 2019 and 8.2 per cent below 1,000
the five-year average due to fewer ewes joined and expected retention 900
of some ewe lambs to replenish breeding flocks. The impact of lower 800
slaughter on production will be partially offset by good seasonal
700
conditions allowing lambs to be finished to heavier weights. Tight
600
mutton production is expected for the remainder of 2020 with a c/kg cwt
500
forecast 37 per cent decline compared to 2019 due to retention of
400
remaining breeding stock.
9.8
300 5 YEAR
Offshore, New Zealand sheepmeat production and exports are 200 DECILE
expected to continue trending lower, driven by a declining sheep flock. 100
This will continue to add to tight global supply and reduce competition
0
for Australian sheepmeat in export markets, particularly China.
Dec 14
Jun 15
Dec 15
Jun 16
Dec 16
Jun 17
Dec 17
Jun 18
Dec 18
Jun 19
Dec 19
Jan 20
Dec 20
Demand
Demand from restockers will be strong as producers seek to utilise
Monthly average ESTLI values forecast at 68 per cent
available feed in spring and rebuild depleted breeding flocks. This will confidence interval.
continue to drive strong competition for reduced supplies. Source: MLA, Rural Bank
Consumer demand for sheepmeat in Australia and key export markets
is expected to improve as COVID-19 restrictions ease and foodservice
demand recovers. However, demand will remain subdued as consumers
continue to modify their behaviour, especially for high-value foodservice.
Chinese demand is expected to remain firm due to a further advanced Value of Australian sheepmeat exports
recovery from COVID-19 and a large protein supply deficit resulting 350
from African Swine Fever. United States demand is expected to remain 2019
300
subdued due to the slow recovery of foodservice demand, a sector that 2020
accounts for more than half of Australian sheepmeat exports. Demand 250
in the Middle East is also expected to be weaker due to a slowdown in
AUD (millions)
foodservice channels but will also continue to be affected by inflated 200
prices due to increased air freight costs and reduced consumer 150
spending resulting from low oil prices. Improvements in demand from
both the United States and the Middle East will be important factors in 100
supporting sheepmeat prices. 50
Price 0
Lamb Mutton Lamb Mutton Lamb Mutton
The eastern states trade lamb indicator (ESTLI) is forecast to decline
US China MENA
from a winter peak but remain 5–10 per cent higher year-on-year.
Support for lamb prices above 2019 levels is expected to come from
stronger restocker demand and reduced international competition, January to April sheepmeat exports show year-on-year
offsetting weaker consumer demand. growth in export value to the US and China.
Source: Global Trade Atlas, Rural Bank
Tighter supply and improving export demand are expected to continue
supporting mutton prices close to record high levels. The national
mutton indicator price is forecast to average 650c/kg cwt for the
remainder of 2020.
14 AUSTRALIAN AGRICULTURE MID-YEAR OUTLOOK 2020Wool
The Australian wool market is
expected to remain under pressure
over the next six months. Global
supply is expected to outstrip demand
in the current economic environment,
with a significant reduction in
consumer sentiment, and in turn
demand, across the global market
expected to remain the key driver of
price weakness.
Mark Pain, Rural Bank, QLD and Northern Rivers NSW
15 AUSTRALIAN AGRICULTURE MID-YEAR OUTLOOK 2020Wool
Supply Price
Domestic wool supply is expected to Wool prices will remain under pressure, with
increase in the 2020/21 season. supply likely to far outstrip demand.
Demand Outlook
Demand is likely to remain low in the The Australian wool industry will face some
Australian wool market. significant challenges over the next six months.
Supply
Favourable conditions in many key Australian wool growing areas is Orders for the upcoming winter season have not materialised this year
expected to lead to growth in domestic wool production during the which means Australian wool is unlikely to see a significant recovery
2020/21 season. Improved conditions will see higher joining rates and in demand until the following northern hemisphere winter. A complete
allow sheep numbers to begin to rebuild off the lowest level on record. rebound in demand, therefore, is unlikely to occur until 12 months from
The national flock is expected to rise by three per cent over the next now, providing the global economy is in a state of recovery and orders
year from 63.5 million head. for the next northern hemisphere winter increase.
An increase in supply will be tempered by historically low wool prices. With the Australian market so exposed to China, and the cost of
As sheep meat prices are at historically high levels, a switch towards a processing increasing as the Chinese economy grows, Australia could
larger mix of meat producing sheep is likely. As a result, domestic wool begin to move some demand to other emerging export markets. India
production is expected to increase two per cent year-on-year but will is a market that is likely to grow their demand for Australian wool in the
remain 10 per cent below the five-year average. future, as some wool exports shift in a bid to diversify demand away
from one key market.
A declining market caused some wool produced in the 2019/20
season to be held back from auctions, this leaves an excess of supply
Price
from the current season that could enter the market in the next
6–12 months, particularly if values improve. The total season offering The Australian wool market is expected to remain under pressure for the
for 2020/21 is likely to increase, as a result of improved seasonal foreseeable future, with low global demand for wool to be the key driver
conditions and excess carry over supply. of price weakness over this period. The Eastern Market Indicator (EMI)
is expected to remain flat to 14 per cent lower over the next six months.
Demand With the likelihood that a higher proportion of Australia’s sheep flock
Wool has been heavily affected by COVID-19 and this looks set to move towards dual-purpose meat and wool genetics, fine wool may
continue. Processors remain hesitant to build up stocks in the current begin to attract a larger premium over the medium micron wool clips
economic environment and have been buying hand to mouth. Low during next season. This alone will not be enough for prices to rally
demand for clothing is already causing closures of manufacturing plants significantly as the broader market is likely to remain under significant
in the US and retail sales revenue will dive for some of the largest users pressure over the same period.
of Australian wool.
Eastern Market Indicator forecast Value of Australian wool exports
2,500 1,200
1,000
2,000 2019
2020
800
AUD (millions)
c/kg clean
1,500
600
1,000
400
500
5 YEAR
DECILE 1.0 200
0 0
Dec 14
Jun 15
Dec 15
Jun 16
Dec 16
Jun 17
Dec 17
Jun 18
Dec 18
Jun 19
Dec 19
Jan 20
Dec 20
China India Italy Czech South Others
Republic Korea
Monthly average EMI values forecast at 68 per cent January to April wool exports show year-on-year decline
confidence interval. in export value across all markets.
Source: Australian Wool Exchange (AWEX), Rural Bank Source: Global Trade Atlas, Rural Bank
16 AUSTRALIAN AGRICULTURE MID-YEAR OUTLOOK 2020About the research
The Australian agriculture mid-year outlook 2020 provides a
forecast for domestic and international supply, demand, and
price dynamics for agricultural products. Significant effort has
been taken to secure the most recent data available.
The price forecasts presented in this report have been
calculated using an Auto-Regressive Integrated Moving Average
model. The model projects a range of values based on trend,
volatility, cyclical and seasonal patterns in the historic data.
The forward estimates relate to the July–December 2020
period, future market conditions may cause actual prices to
move across and outside of the forecast range.
All prices represent Australian Dollars unless otherwise noted.
Glossary
ABS Australian Bureau of Statistics
ASF African Swine Fever
AWEX Australian Wool Exchange
AUD Australian Dollar
CPI Consumer Price Index
EMI Eastern Market Indicator
ESTLI Eastern States Trade Lamb Indicator
EYCI Eastern Young Cattle Indicator
GDP Gross Domestic Product
GDT Global Dairy Trade
MENA Middle East and North Africa
MLA Meat and Livestock Australia
MS Milk solids
RBA Reserve Bank of Australia
US United States
This report is intended to provide general information on a particular subject or subjects and is not an exhaustive treatment of such subject(s). The information herein is believed
to be reliable and has been obtained from public sources believed to be reliable. Rural Bank, a Division of Bendigo and Adelaide Bank Limited, ABN 11 068 049 178 AFSL/
Australian Credit Licence 237879, makes no representation as to or accepts any responsibility for the accuracy or completeness of information contained in this report. Any
opinions, estimates and projections in this report do not necessarily reflect the opinions of Rural Bank and are subject to change without notice. Rural Bank has no obligation to
update, modify or amend this report or to otherwise notify a recipient thereof in the event that any opinion, forecast or estimate set forth therein, changes or subsequently becomes
inaccurate. This report is provided for informational purposes only. The information contained in this report does not take into account your personal circumstances and should not
be relied upon without consulting your legal, financial, tax or other appropriate professional.
©
Copyright Bendigo and Adelaide Bank Ltd ABN 11 068 049 178 (1477773 –1477767) (06/20)
17 AUSTRALIAN AGRICULTURE MID-YEAR OUTLOOK 2020For report enquiries For more detailed and in depth insights or customised reports email: insights@ruralbank.com.au For banking enquiries Rural Bank products are available through Elders and Bendigo Bank branches. To find out more about Rural Bank’s range of specialist farm finance products and services contact your local Rural Bank Agribusiness Relationship Manager, call 1300 660 115 or visit ruralbank.com.au Subscribe Visit ruralbank.com.au/subscribe to receive future research and analysis to support you in making informed business decisions on your farm. www.ruralbank.com.au
You can also read