Yellow billed Cuckoo Survey Effort Along the Sacramento and Feather Rivers 2012
←
→
Page content transcription
If your browser does not render page correctly, please read the page content below
Yellow‐billed Cuckoo Survey Effort Along the
       Sacramento and Feather Rivers
                             2012

                            ©Adrienne Levoy

A progress report to the California Department of Fish and Game

                       Grant #1182002

            Mark D. Dettling and Nathaniel E. Seavy
                 PRBO Conservation Science
                   3820 Cypress Drive #11
                     Petaluma, CA 94954
                      PRBO Contribution #1915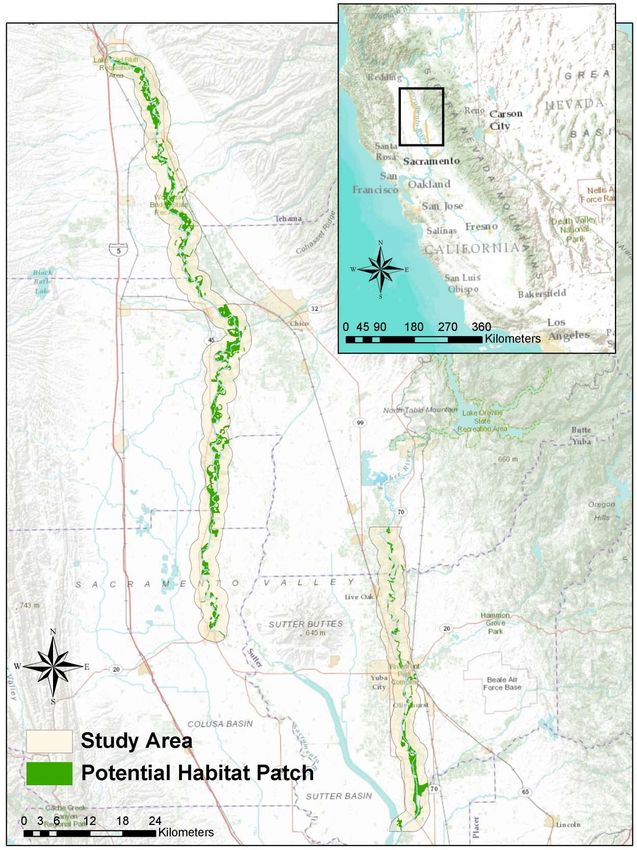
Table of Contents
INTRODUCTION .......................................................................................................................... 1
METHODS ..................................................................................................................................... 2
RESULTS ....................................................................................................................................... 8
DISCUSSION ............................................................................................................................... 15
ACKNOWLEDGEMENTS .......................................................................................................... 18
LITERATURE CITED ................................................................................................................. 19
APPENDIX A ............................................................................................................................... 21
APPENDIX B ............................................................................................................................... 23
APPENDIX C ............................................................................................................................... 24
APPENDIX D ............................................................................................................................... 25
INTRODUCTION
The western population of the Yellow-billed Cuckoo (Coccyzus americanus, “Cuckoo”),
considered a distinct population segment by the US Fish and Wildlife Service, is a candidate for
federal listing (US Fish and Wildlife Service 2001) and is currently listed as state endangered in
California. This Cuckoo has seen dramatic range retraction likely due to loss of riparian forests
(Laymon and Halterman 1987). The range of the species in the west is now restricted to
remaining isolated riparian forest fragments and in California to the Sacramento Valley, the Kern
River, and the lower Colorado River with individuals occasionally reported in other areas
(Laymon and Halterman 1987). The Sacramento Valley is believed to have one of the largest
Cuckoo populations in California (Halterman et al. 2001) and riparian vegetation there has
increased, due to restoration, by over 2000 ha since 1996 (Golet et al. 2008).

Large-scale Cuckoo surveys were conducted along the Sacramento River in 1972-73 (Gaines
1974, Gaines and Laymon 1984), 1977 (Gaines and Laymon 1984), 1987-90 (Laymon and
Halterman 1989, Halterman 1991), and 1999-2000 (Halterman et al. 2001). Although the effort
in each study varied, these surveys suggested a population of between 28-142 individuals.

On the Feather River, surveys were conducted in 1977 (Gaines and Laymon 1984), 1987
(Laymon and Halterman 1989), and 1999 (Halterman et al. 2001). Between zero and six
individual Cuckoos were found along the section of the Feather River from Oroville to Nicolaus.

In 2010 we conducted Cuckoo surveys to estimate the number of territories along the
Sacramento River (Dettling and Howell 2011). We detected 18 individuals and used a model to
estimate that 32-38 territories were occupied. Comparing the 2010 results to the previous surveys
is difficult due to the differences in effort and protocol, though we are confident our results
indicate a decline in the Cuckoo population (see Discussion in Dettling and Howell 2011).

Building on our 2010 survey effort, we surveyed for Yellow-billed Cuckoos along both the
Sacramento and Feather rivers during the summer of 2012 and will be surveying those areas
again in 2013. The primary goal of our survey was to estimate the number of Yellow-billed
Cuckoo territories in potential nesting habitat along the main stems of the Sacramento and
Feather rivers but information about nesting and habitat was also collected.

Here we report on our progress from the 2012 surveys.

                                                1
METHODS
Sampling Frame

Our 2012 survey for Yellow-billed Cuckoos in the Sacramento Valley focused on the main stems
of the Sacramento and Feather rivers. The sampling frame was defined by a 4 km wide strip of
land centered on the Sacramento (Red Bluff to Colusa; ca. 100 river miles) and Feather (Gridley
to Nicolaus; ca. 32 river miles) rivers (Fig. 1). The sampling frame is large enough to contain all
of the large tracts of riparian forest along the main stems of the rivers. Within this sampling
frame, we limited our survey effort to areas that we identified as potential nesting habitat
patches.

Defining Potential Habitat Patches

In California, Cuckoos are riparian obligates that will use relatively young forests (e.g., 4 years
old; Hammond 2011) as well as relatively mature stands (Gaines 1974), and may prefer areas
with both (see discussion in Greco et al. 2002). To define potential habitat, we used the Central
Valley Riparian Mapping Project vegetation layer (medium-scale layer; final version to be
available from bios.dfg.ca.gov) to identify and map all riparian forest and riparian scrub
(including restoration sites) within our Sacramento and Feather river sampling frame. The habitat
classifications used from this layer were “RWF - Riparian Evergreen and Deciduous Woodland”
and “RWS - Southwestern North America riparian wash/scrub.” Table 1 lists the characteristic
vegetation types for each classification.

Table 1 Vegetation types (from Sawyer et al. 2009) that characterize the riparian classifications chosen to
define potential Yellow-billed Cuckoo habitat. RWF=Riparian Evergreen and Deciduous Woodland,
RWS=Southwestern North American riparian wash/scrub.

   Classification                         RWF                                     RWS
   Vegetation types         Acer negundo alliance                Baccharis salicifolia alliance
                            Juglans hindsii stands               Cephalanthus occidentalis alliance
                            Platanus racemosa alliance           Rosa californica alliance
                            Populus fremontii alliance           Salix exigua alliance
                            Quercus lobata alliance              Salix lasiolepis alliance
                            Salix gooddingii alliance            Sambucus nigra alliance
                            Salix laevigata alliance

It is recognized that many fragments of riparian forest and scrub are likely too small to provide
habitat for Cuckoos (Gaines 1974, Gaines and Laymon 1984, Girvetz and Greco 2009). Some
areas with other land covers (e.g., grasslands) that are surrounded by or between patches of
riparian forest and scrub can be incorporated into Cuckoo territories and are not necessarily
barriers. Thus, potential habitat is best defined as patches of riparian forest and scrub with
sufficient area to support Cuckoos (Laymon and Halterman 1989).

                                                     2
We defined potential habitat for the Yellow-billed Cuckoo as areas of riparian forest and scrub
that were >100 m wide and >15 ha, but could include areas of other land cover types as long as
these gaps in the riparian vegetation were 15 ha, width>100 m, gap
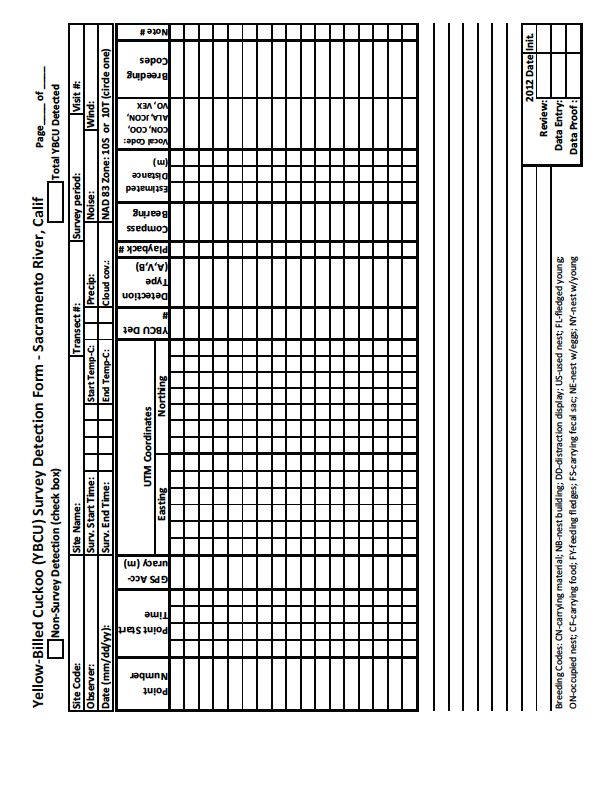
Figure 1 Map of 2012 Yellow-billed Cuckoo sampling frame and potential habitat patches along the
Sacramento and Feather rivers.

                                                  4
Sampling Potential Habitat Patches
Along the Sacramento and Feather rivers, we identified a total of 115 potential habitat patches
that covered a total of 10,186 ha. Due to logistical and financial constraints (number of
personnel, time, access, etc.), we were unable to survey this entire area. Instead, we generated a
sampling design that would allow us to survey a subsample of the area and use that subsample to
make inferences to the entire area.
Our sampling procedure was based on a 300 m grid overlaid on the habitat patches. The size of
the grid cells was smaller than the smallest patch, so each patch is covered by multiple cells, but
large enough that cells near each other could be chosen and non-overlapping survey transects
established.
From the sampling grid, we randomly selected transect starting points using a generalized
random-tessellation stratified (GRTS) sampling design (Stevens and Olsen 2003, 2004). The
GRTS sampling method is increasingly being adopted for large-scale environmental monitoring
programs, in part because it creates a spatially balanced random sample, while being flexible
enough to allow additional samples to be added or removed without compromising the spatial
balance of the overall sample (Stevens and Olsen 2003). We used the GRTS algorithm to select
40 transect starting points and 100 “oversample” locations for the Sacramento River and 10
transect starting points and 40 “oversample” locations for the Feather River. These oversamples
were used to replace random sites if they needed to be dropped due to access restrictions at a site
or other logistical constraints. A total of 54 transect starting points were chosen (44 on the
Sacramento River and 10 on the Feather River).
From each starting point, we established transects of points where surveys were conducted.
Transects started with a survey point in the GRTS chosen grid cell and continued with survey
points spaced every 100-200 m through the patch until the entire patch had been surveyed or the
surveyor ran out of time. If the patch was entirely covered with time to spare, and another patch
was within 500 m and on the same side of the river, the surveyor moved to that patch and
surveyed until they ran out of time.
FIELD METHODS
Yellow-billed Cuckoo Survey Protocol
At each transect, surveys were conducted using a playback protocol developed by Halterman et
al. (2011) and adopted by the Western Yellow-billed Cuckoo Working Group. The method is
outlined below.
o A recording of a Yellow-billed Cuckoo (provided by Halterman) consisting of a
contact call (series of “kuks” and “kowlps”) was broadcast using a digital music
player (iPod Nano) and portable speaker (Cass Creek Big Horn Speaker). The
5volume was set to produce ~70 decibels at 1 m, allowing the call to be heard 100
m away through vegetation.
o Call playback surveys were conducted at points spaced approximately every 100
m along transects, with five sets of calls (with one minute of silence in between)
played at each point.
o All of the transects were surveyed four times, with each visit separated by at least
12 days but no more than 20 days. The survey period was from 15 June to 16
August, corresponding with the height of breeding activity.
o Transects were established based on logistical feasibility (ability to move through
the site in a timely manner, able to complete in one morning), but where possible
were set to cover as much of the patch as possible weaving through the potential
habitat. Transects ranged from 8 to 34 points.
o When a Cuckoo was detected, we noted during which set of calls and stopped the
playback at that point. Points with a detection in one round were surveyed again
in subsequent rounds.
o After a Cuckoo detection the surveyor moved 300 m (skipping points) and
resumed the survey to avoid further disturbing the previously detected individual.
If that individual responded again, the surveyor moved further (300 m or more
depending on Cuckoo behavior) before resuming the survey.
We added two specifications to the protocol to aid in our planned statistical analysis.
o The same points were surveyed during each visit to a transect, as opposed to the
protocol which only requires the transects to be surveyed, not individual points.
o Starting points for transects were randomly chosen (see Sampling Potential
Habitat Patches above) instead of following previously established transects from
the 2010 surveys.
Survey data were recorded in the field on standardized data forms (Appendix B). We recorded
during which call playback the Cuckoo was detected, the distance, bearing, and response type
(visual or call). The call types are the coo call (a series of “coos”), the contact call (a series of
“kuks” and “kowlps”), and the alarm call (a sharp knock). Additional information about the
behavior (with special attention to behavior indicating breeding), location of the Cuckoo relative
to the vegetation, and time spent observing was also recorded.
Nest Searching Protocol
When a Cuckoo was detected, the surveyor attempted to locate the individual to observe its
behavior. The surveyor would spend up to 30 minutes looking for or watching the individual
during a scheduled survey. The location of the individual was marked with a GPS unit and notes
on behavior that may indicate nesting (e.g., carrying material or food) were taken. If the bird was
exhibiting nesting behavior, a follow-up visit occurred within 3 days to attempt to locate the nest.
6Nest searching guidelines from Martin and Geupel (1993) were followed to minimize
disturbance. Had a Cuckoo nest been located, it would have been monitored to determine the
fate.
Vegetation Survey Protocol
Vegetation data were collected at all survey points and additional locations where Cuckoos were
detected outside of the survey effort. To quantify vegetation at a point, we established an 11.3 m
radius plot, with the survey point as the center. The protocol captured forest structure and
composition, without requiring an excessive amount of time.
Within this circular plot, we visually estimated canopy height in three categories, high canopy
(95% of green canopy foliage is below this height), low canopy (95% of green canopy foliage is
above this height), and average canopy height (50% of green canopy foliage is above this
height). We also estimated percent canopy cover above 5 m and vegetative cover (%) in four
height categories (1.4-5 m, 5-15 m, 15-30 m, and >30 m). Additionally, for individual tree
species that covered greater than 5% of the plot, we estimated the maximum height and canopy
cover in the same four height categories. Low cover (%) was assessed in broad categories: leaf
litter/logs/bare, water, live woody, other, and nothing. The data form used can be found in
Appendix C.
Field Technician Training
Recognizing all Yellow-billed Cuckoo calls and distance estimation are extremely important,
therefore all survey personnel were trained for two weeks at the beginning of the season. A
presentation on the natural history of the Cuckoo (including visual and aural identification),
along with a description of the survey protocol, were given to the survey personnel. Several days
were spent in the field practicing distance estimation and the survey protocol before any surveys
were conducted. All training was led by staff with multiple years of experience conducting
Cuckoo surveys.
Data Entry and Archiving
Data was entered into an Access database daily and backed up on PRBO servers weekly. The
PRBO servers are also backed up regularly, ensuring that data will not be lost. All hard copies of
data forms were scanned and stored at PRBO headquarters in Petaluma, California, and the
scanned digital copies are stored on regularly backed-up PRBO servers.
7RESULTS
Yellow-billed Cuckoo Survey
We established 1388 survey points along 54 transects, with 44 transects along the Sacramento
River and 10 transects along the Feather River (Appendix D). Four rounds of surveys were
conducted at all of the transects with a small number of points skipped in particular rounds due
to wind, noise, avian predators, or a Cuckoo detection at a previous point. A fifth round of
surveys was completed at 8 of the transects, either because Cuckoos had been detected at these
transects either earlier in 2012 or during surveys conducted in 2010. The 2012 surveys were
conducted from June 15 to August 22 and required a total of 1120 person hours.
During our surveys, we had 9 Cuckoo detections along the Sacramento River and zero along the
Feather River (Table 2, Fig. 2). Two of these detections were on transects with a Cuckoo
detection in a previous round. These detections were at points separated by 590 and 1130 m from
the points of the first detection. All of the Cuckoo detections were south of Highway 32, which
splits our Sacramento River study area in half.
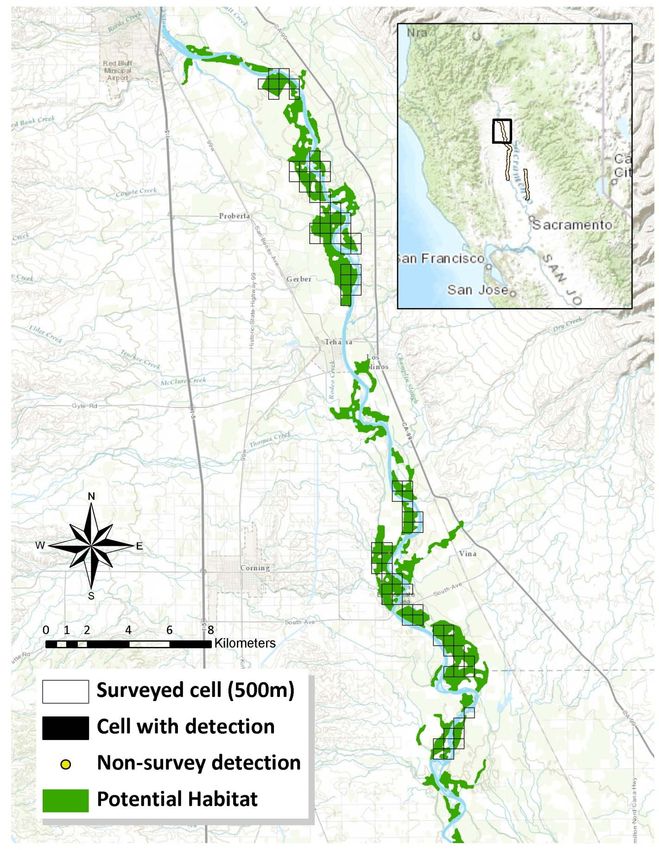
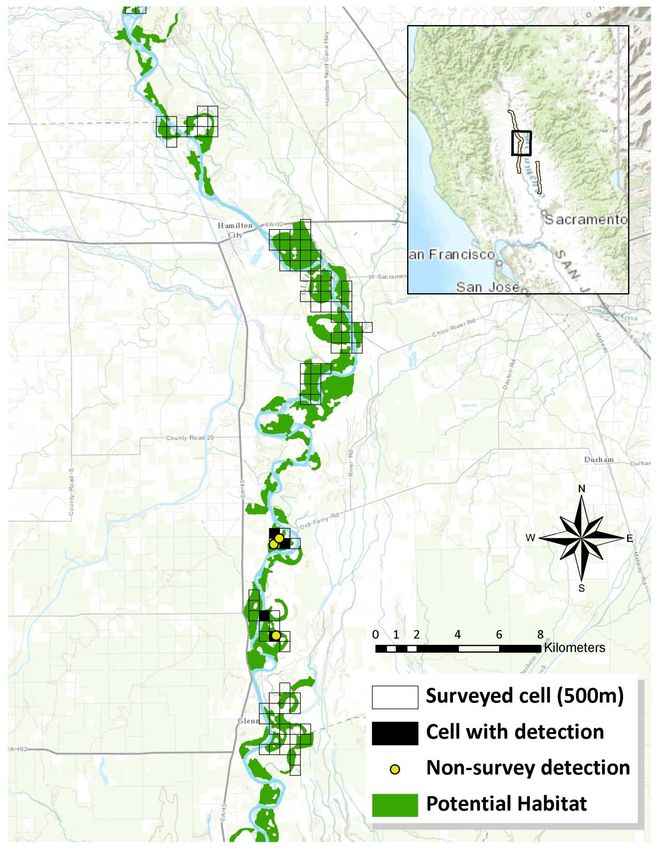
We summarized the area surveyed and detection locations (Fig. 2) using a 500 m grid, which is
25 ha, an area equal to the estimate for a mid-sized Cuckoo territory. These grid cells were
considered surveyed if they contained at least one survey point. The 500 m grid cells, rather than
the 300 m grid cells used in the sampling protocol, were used because they most closely matched
the territory size of Cuckoos. None of the survey detections fell within the same 500 m grid cell,
such that there were no grid cells with repeated detections during our surveys.
Table 2 Yellow-billed Cuckoo detections during 2012 surveys, along with date and location information,
listed in chronological order. GPS coordinates are UTM NAD83.
Location UTM Easting UTM Northing Date County Landowner
South Ord Unit 587263 4385292 6/18/2012 Glenn USFWS
Llano Seco Riparian Sanctuary Unit 586347 4381621 7/4/2012 Butte USFWS
Sac R. mile 159 East 584173 4355833 7/24/2012 Colusa Private
Beehive Unit 584883 4370080 7/27/2012 Glenn CA DFG
South Ord Unit 586940 4385800 8/5/2012 Glenn USFWS
Moulton Island 584125 4353037 8/6/2012 Colusa Private
Site 21 (Sac R. mile 166 West) 585377 4364044 8/8/2012 Glenn CA DFG
Packer Island Unit 585550 4366060 8/9/2012 Glenn USFWS
Llano Seco Riparian Sanctuary Unit 586911 4380654 8/20/2012 Butte USFWS
In addition to detections during the surveys, another eight Cuckoo detections occurred outside of
the survey effort (Table 3, Fig. 2). Six of these detections were on follow up visits to previously
detected birds, therefore were very likely the same individuals previously detected. The other
8two detections were made near survey transects while travelling to transect areas; one of these
detections was of two individuals.
Table 3 Yellow-billed Cuckoo detections during 2012 non-survey work, along with date and location
information, listed in chronological order. GPS coordinates are UTM NAD83.
Location UTM Easting UTM Northing Date County Landowner
1
South Ord Unit 586720 4385232 6/19/2012 Glenn USFWS
South Ord Unit1 586986 4385511 6/24/2012 Glenn USFWS
2
Moulton South Unit 584466 4351656 7/9/2012 Colusa CA DFG
1
Moulton South Unit 584523 4351763 7/24/2012 Colusa CA DFG
1
Llano Seco Riparian Sanctuary Unit 586829 4380484 7/28/2012 Butte USFWS
Sul Norte Unit 586208 4369314 7/30/2012 Glenn USFWS
Sul Norte Unit1 586234 4369326 7/31/2012 Glenn USFWS
1
Llano Seco Riparian Sanctuary Unit 586825 4380788 8/15/2012 Butte USFWS
1 Follow up visit to a previous detection site 2 Detection of two individuals
9Figure 2a Map of 2012 Yellow-billed Cuckoo surveys and detections in the northern section of the
Sacramento River study area. Each 500 m grid cell contains at least one survey point.
10Figure 2b Map of 2012 Yellow-billed Cuckoo surveys and detections in the middle section of the
Sacramento River study area. Each 500 m grid cell contains at least one survey point.
11Figure 2c Map of 2012 Yellow-billed Cuckoo surveys and detections in the southern section of the
Sacramento River study area. Each 500 m grid cell contains at least one survey point.
12Figure 2d Map of 2012 Yellow-billed Cuckoo surveys and detections in the Feather River study area.
Each 500 m grid cell contains at least one survey point.
13Nest Searching
After a cuckoo was detected, the surveyors attempted to observe the Cuckoo and note any
breeding activity (nest material carry, food carry, etc.). Follow-up visits were made to South Ord,
Llano Seco Riparian Sanctuary, Beehive (Sul Norte), and Site 21 (Table 3). All detections could
not be followed up on due to logistical or time constraints. In total, about 20 hours of follow up
time were spent trying to confirm breeding. No evidence of breeding was found.
Vegetation Surveys
Vegetation surveys were completed at all survey points (1388) and any locations where Yellow-
billed Cuckoos were detected either during formal surveys (17) or incidentally (5).
Sites where Cuckoos were detected had high canopy height and high degree of canopy cover,
especially in the 5-15 m height range (Table 4). At these sites, the trees most commonly present
included boxelder Acer negundo, California black walnut Juglans californica, and Fremont
cottonwood Populus fremontii (Table 5).
Table 4 Structural characteristics of 2012 Yellow-billed Cuckoo detection locations. High Canopy is
defined as the height where 95% of the tree cover is below. Low Canopy is defined as the height where
95% of the tree cover is above. Average Canopy Height is where 50% of tree cover is below or above.
Total Canopy Cover is the percent of vegetative cover above 5 m. Other cover estimates are the
percentage of vegetative cover in a particular height range.
Characteristic Average Range
High Canopy Height (m) 16.8 7‐27
Low Canopy Height (m) 2.5 0‐5
Average Canopy Height (m) 10.5 2‐20
Total Canopy Cover (%) 68.8 10‐100
Cover between 1.4‐5 m (%) 52.1 15‐80
Cover between 5‐15 m (%) 62.0 10‐98
Cover between 15‐30 m (%) 31.9 0‐100
Table 5 Tree species composition of 2012 Yellow-billed Cuckoo detection locations, listed in order of
presence at most locations. Percentage indicates how many detection locations (out of 22) that a tree
species was present, and does not indicate the degree of cover provided by that species.
Tree Species Percentage Present
Boxelder (Acer negundo) 68.2%
California black walnut (Juglans californica) 68.2%
Fremont cottonwood (Populus fremontii) 59.1%
Black willow (Salix gooddingii) 36.4%
Valley oak (Quercus lobata) 22.7%
14DISCUSSION
Yellow-billed Cuckoo Survey
Despite the high amount of effort and the large area surveyed, we detected 7-9 Cuckoos along
the Sacramento River and none along the Feather River, and another 3 Cuckoos along the
Sacramento River during non-survey work, for a total of 10-12 Cuckoos detected. All of the
detections, including the non-survey detections, were within areas we had identified as potential
Cuckoo habitat.
We detected Cuckoos in four areas where none were found in 2010 but where surveys had been
conducted (South Ord, Beehive, Sul Norte, and Moulton South). One of the 2012 detections was
in an area not surveyed in 2010 (Sacramento River mile 159), though the area across the river
was surveyed. Conversely, there were five locations where Cuckoos were detected in 2010, but
no detections on the 2012 surveys (LaBarranca, Rio Vista, Pine Creek, Phelan Island, and
Princeton East). There were two detections in 2010 in areas not surveyed in 2012 (East Ohm, and
Princeton South).
The total number of Cuckoos detected by our surveys is not an estimate of the total population
because 1) the secretive nature of Cuckoos means that not every individual will be detected even
when they are present, and 2) we only sampled a portion (~26%) of the potential habitat within
our sampling frame.
Our sampling protocol was developed to address these issues; repeated surveys at the same
locations can give us a detection history for each survey point. This set of detection histories
theoretically allows for analysis using an occupancy model which uses repeated detections to
estimate the probability of detection and then to estimate the proportion of areas (500 m grid
cells in our case) that are occupied (MacKenzie et al. 2005). However, we did not have any
points with repeat detections, complicating the application of occupancy modeling. With an
additional year of sampling, we will have more information to estimate occupancy and generate
population estimates for the Sacramento and Feather rivers.
By assuming that the probability of detection is one (all Cuckoos present are detected), we can
derive a naïve occupancy estimate. This type of estimate is called a naïve estimate since it
ignores that fact that some Cuckoos present will not be detected (MacKenzie et al. 2005). We
used the 500 m grid to derive a naïve occupancy rate of 0.029 (9 cells occupied out of 310 cells
surveyed) along the Sacramento River. There are 888 grid cells that contain at least a portion of
potential Cuckoo habitat, leading to a naïve occupancy estimate of 25.78 cells. The population
estimate would then be about 26 pairs (52 individuals) for the Sacramento River. This estimate is
on the low end because as the probability of detection decreases, the occupancy rate increases.
An estimate of the probability of detection is necessary for a more accurate population estimate.
15Despite the secretive nature of the Cuckoo and the amount of potentially suitable area surveyed
(26%), we were still surprised to have so few detections and no repeat detections. It seems
highly unlikely that we would have detected only 10-12 Cuckoos if the numbers were anywhere
close to the population objectives developed for the region; 150 pairs (300 individuals) along the
Sacramento River and 25 (50 individuals) pairs along the Feather River (Laymon 1998).
Nest Searching
We did not locate any nests or find evidence of breeding activity. We were unable to determine
whether any of the individual cuckoos detected were in breeding pairs. An anecdotal sighting
from Department of Fish and Game employee Henry Lomeli (not while working) of a Cuckoo
carrying a large insect, was the best evidence of breeding. The lack of evidence of pairs and
breeding activity does not mean that Cuckoos were not breeding in the area, as their secretive
nature makes confirming breeding difficult. A more focused and time-intensive effort would be
required to determine the breeding status.
Vegetation Survey
The summary of vegetation characteristics for Cuckoo detection locations did not reveal any
unexpected results. The use by Cuckoos of forested areas with vegetative structure from the
shrub to canopy layer and a large amount of canopy cover have been found in previous studies
(Halterman 1991, Halterman et al. 2001).
In our previous analyses (Dettling and Howell 2011), we were unable to find any statistically
significant relationships between habitat characteristics and Cuckoo occupancy. We speculated
that one reason for this was a small sample size of occupied areas. Another possible explanation
is that by choosing to survey areas we thought contained high quality habitat, we only surveyed
areas with very similar characteristics.
A couple other factors should be considered when evaluating habitat characteristics for Yellow-
billed Cuckoos. The first is that the call playback technique used for surveying often draws a
Cuckoo closer to the observer. We evaluate the habitat at the point of first detection, which may
not be where the bird spends most of its time. The second is the scale at which the habitat is
evaluated. Characteristics of an entire Cuckoo territory would be the most biologically relevant,
though would be time consuming to collect. Remote sensing data might be useful at these larger
scales.
Next steps
We recommend continuing surveys at least one more year. Halterman (1991) found year to year
fluctuations in numbers of Cuckoos over four years of surveying. Another year of surveys will
help us to understand the nature of the Yellow-billed Cuckoo population along the Sacramento
and Feather rivers.
16We will also consider what actions we can take in 2013 to provide the necessary data to develop
an accurate Cuckoo population estimate. The following actions are being considered:
More rigorous follow-up surveys (establish probability of detection)
Consider modifying survey protocol to increase chance of redetections (more surveys in
July, less area)
Use 2010 data to inform probability of detection to use with 2012-13 data
17ACKNOWLEDGEMENTS
From the California Department of Fish and Game, we would like to thank David Wright, Canh
Nguyen, and Henry Lomeli who helped with administrative, logistical and field work. For
permission to survey on their property we thank the California Department of Parks and
Recreation (Denise Rist and Jim Dempsey), the Sacramento River National Wildlife Refuge
(Kelly Moroney and Joe Silveira), and The Nature Conservancy (Ryan Luster and Greg Golet).
Jay Roberts, Michelle Gilbert, and Tom Gardali provided helpful recommendations while
developing the sampling design. We truly appreciate the hard work and dedication of our field
technicians, Billy Abbott, Simon Avery, Stephen Barlow, and Adrienne Levoy. Tom Gardali and
Michelle Gilbert commented on previous versions of this report. Our work was funded by the
California Department of Fish and Game (grant #1182002). We would like to acknowledge the
US Fish and Wildlife Service Traditional Section 6 – Threatened and Endangered Wildlife
Program for providing the funding to the California Department of Fish and Game. This is
PRBO contribution #1915.
18LITERATURE CITED
Dettling, M. D. and C.A. Howell. 2011. Status of the Yellow-billed Cuckoo along the
Sacramento River in 2010. Report to California Department of Fish and Game. PRBO
Contribution #1794.
Gaines D. 1974. Review of the status of the Yellow-billed Cuckoo in California: Sacramento
Valley populations. The Condor 76:204-209.
Gaines, D., and S. A. Laymon. 1984. Decline, status and preservation of the Yellow-billed
Cuckoo in California. Western Birds 15:49-80.
Girvetz, E. H., and S. E. Greco. 2009. Multi-scale predictive habitat suitability modeling based
on hierarchically delineated patches: an example for yellow-billed cuckoos nesting in
riparian forests, California, USA. Landscape Ecology 24:1315-1329.
Golet, G. H., T. Gardali, C. A. Howell, J. Hunt, R. A. Luster, W. Rainey, M. D. Roberts, J.
Silveira, H. Swagerty, and N. Williams. 2008. Wildlife Response to Riparian Restoration
on the Sacramento River. San Francisco Estuary and Watershed Science. Vol. 6, Issue 2
(June), Article 1.
Greco, S. E. 1999. Monitoring riparian landscape change and modeling habitat dynamics of the
Yellow-billed Cuckoo on the Sacramento River, California. Dissertation, University of
California, Davis. Ann Arbor: ProQuest/UMI. (Publication No. AAT 9948686).
Greco, S. E., R. E. Plant, and R. H. Barrett. 2002. Geographic modeling of temporal variability
in habitat quality of the yellow-billed cuckoo on the Sacramento River, miles 196–219,
California. In: Scott J. M., Jeglund P. J., Samson F., Haufler J., Morrison M., Raphael M.,
and Wall B. (eds) Predicting species occurrences: issues of accuracy and scale. Island
Press, Covelo, CA, USA.
Grinnell, J., and A. Miller. 1944. The distribution of the birds of California. Pacific Coast
Avifauna No. 26.
Halterman, M. D. 1991. Distribution and habitat use of the Yellow-billed Cuckoo on the
Sacramento River, 1987-1990. Master’s Thesis, Calif. State University, Chico.
Halterman, M. D. 2009. Sexual dimorphism, detection probability, home range, and parental care
in the Yellow-billed Cuckoo. Ph.D. Dissertation, University of Nevada, Reno.
Halterman, M. D., D. S. Gilmer, S. A. Laymon, and G. A. Falxa. 2001. Status of the Yellow-
billed Cuckoo in California: 1999-2000. Report to the USGS-BRD Dixon Field Station,
6924 Tremont Rd., Dixon, 95620.
Halterman, M. D., M. J. Johnson, and J. A. Holmes. 2011. A Natural History Summary and
Survey Protocol for the Western Yellow-billed Cuckoo Population. Draft May 2011.
Obtained from Murrelet Halterman, cuckoobuster@yahoo.com.
Hammond, J. E. 2011. It was built…did they come? Habitat characteristics of Yellow-billed
Cuckoo in restored riparian forests along the Sacramento River, California. M.S. Thesis,
California State University, Chico.
19Hughes, J. M. 1999. Yellow-billed cuckoo (Coccyzus americanus). In The Birds of North
America, No. 418 (A. Poole and F.Gill, eds.). The Birds of North America, Inc.,
Philadelphia, PA.
Laymon, S.A. and M.D. Halterman. 1987. Can the western subspecies of the yellow-billed
cuckoo be saved from extinction? Western Birds 18:19-25.
Laymon, S. A., and M. D. Halterman. 1989. A proposed habitat management plan for Yellow-
billed Cuckoos in California. USDA Forest Service Gen. Tech. Rep. PSW-110.
Laymon, S. A. 1998. Yellow-billed Cuckoo (Coccycus americanus). In The Riparian Bird
Conservation Plan:a strategy for reversing the decline of riparian-associated birds in
California. California Partners in Flight. http://www.prbo.org/calpif/htmldocs/riparian_v-
2.html
Martin, T. E., and G. R. Geupel. 1993. Nest-monitoring plots: Methods for locating nests and
monitoring success. Journal of Field Ornithology 64:507-519.
MacKenzie, D. I., J. D. Nichols, J. A. Royle, K. H. Pollock, J. E. Hines, and L. L. Bailey. 2005.
Occupancy estimation and modeling: inferring patterns and dynamics of species
occurance. Elsevier, San Diego, USA.
nd
Sawyer, J.O., T. Keeler-Wolf and J.M. Evens. 2009. A Manual of California Vegetation, 2
edition. California Native Plant Society Press, Sacramento, CA.
Stevens, D. L., and A. R. Olsen. 2003. Variance estimation for spatially balanced samples of
environmental resources. Environmetrics 14:593-610.
Stevens, D. L. and A. R. Olsen. 2004. Spatially balanced sampling of natural resources. Journal
of the American Statistical Association 99:262-278.
US Fish and Wildlife Service. 2001. Endangered and Threatened Wildlife and Plants; 12-month
Finding for a Petition to List the Yellow-billed Cuckoo (Coccyzus americanus) in the
Western Continental United States. Federal Register 66:38611-38626. Accessed from
http://ecos.fws.gov/docs/federal_register/fr3780.pdf
20APPENDIX A
PatchMorph inputs for the Sacramento River.
Run name = Sac2
Input landcover map = Sac_RWFRWS
Landcover map field = YBCU_HAB
Cell size = 10
Density Filter
Density filter =0
Density neighborhood =5
Density threshold = 0.25
Hard Barrier
Hard barrier =1
Hard barrier map = Sac_RWFRWS
Hard barrier map field = WATER
Habitat Suitability
Minimum suitability =0
Maximum suitability =1
Number of suit. categories = 2
Hierarchical Patch Delineation
Gap then Spur = True
Spur then Gap = False
Threshold Perception Values
Landcover gaps removed =1
Landcover gap--low = 100
Landcover gap--high = 100
# of hierarchical levels = 1
Iterate hierarchy = 0
Landcover spurs removed =1
Landcover spur--low = 100
Landcover spur--high = 100
# of hierarchical levels = 1
Iterate hierarchy = 0
Minimum area of patch =0
21APPENDIX A
PatchMorph inputs for the Feather River.
Run name = Fthr2
Input landcover map = Feather_RWFRWS
Landcover map field = YBCU_HAB
Cell size = 10
Density Filter
Density filter =0
Density neighborhood =5
Density threshold = 0.25
Hard Barrier
Hard barrier =1
Hard barrier map = Feather_RWFRWS
Hard barrier map field = WATER
Habitat Suitability
Minimum suitability =0
Maximum suitability =1
Number of suit. categories = 2
Hierarchical Patch Delineation
Gap then Spur = True
Spur then Gap = False
Threshold Perception Values
Landcover gaps removed =1
Landcover gap--low = 100
Landcover gap--high = 100
# of hierarchical levels = 1
Iterate hierarchy = 0
Landcover spurs removed =1
Landcover spur--low = 100
Landcover spur--high = 100
# of hierarchical levels = 1
Iterate hierarchy = 0
Minimum area of patch =0
22APPENDIX B
2012 Yellow-billed Cuckoo survey data form.
23APPENDIX C
2012 Yellow-billed Cuckoo vegetation survey form.
PRBO YBCU VEGETATION FORM
Site Code: ___________ Site Name:______________________ Transect #:______ Point #:______
Observer: _______________ Date(mm/dd/yyyy):___/___/2012 Time:_______
From Map - Distance to Water: _______ Distance to Sac. River: ___________ Edge? Y / N
High Canopy ht: 95% of green
canopy foliage is below this height
Low Canopy ht: 95% of green
canopy foliage is above this height
Average ht of canopy:
% Total Canopy Cover (above 5m):
Tree Cover Visual Estimates
Record the percent cover of ALL Max ht % Cover within 11.3m radius circle
live tree species within each of each by height strata (in 5% increments if >10%)
strata, as well as EACH tree tree
species within each strata species >1.4 - 5m >5-15m >15-30m >30m
ALL trees (% cover)
Record individual woody species
below
Low Cover Visual Estimates
0 to >50cm Up to three most
Visual Cover Estimates (%) 50 cm to 1.4 m common shrub
Leaf litter/Logs/Bare species:
Water
Other
Woody (live)
Nothing
Date Init
Review:
TOTAL 100% 100%
Data Entry:
Proof :
Notes: ______________________________________________________________________________
____________________________________________________________________________________
____________________________________________________________________________________
____________________________________________________________________________________
24APPENDIX D
2012 Yellow-billed Cuckoo Sacramento and Feather river survey locations and dates listed from north to south. CA DFG-California
Department of Fish and Game, CA DPR-California Department of Parks and Recreation, CA DWR-California Department of Water
Resources, GCID-Glenn-Colusa Irrigation District, TNC-The Nature Conservancy, USFWS-US Fish and Wildlife Service. 1 Two
dates indicate that the survey was suspended on first day and finished on the second day. 2 Surveys compromised by high winds.
Sacramento River Sites
Transect # River Side of Round Round Round Round Round
# Location Name Points Mile River Owner 11 2 3 4 5
058 LaBarranca Unit 28 240 West USFWS 29‐Jun 14‐Jul 27‐Jul 16‐Aug
014 Boat access 13 236.5 East Private 20‐Jun 10‐Jul 25‐Jul 7‐Aug
054 Mooney Unit 34 236 West USFWS 28‐Jun 13‐Jul 27‐Jul 11‐Aug
026 Ohm Unit 22 234 West USFWS 28‐Jun 13‐Jul 26‐Jul 10‐Aug
010 Ohm Unit 25 233 West USFWS 28‐Jun 13‐Jul 26‐Jul 10‐Aug
038 Boat access 17 232.5 East Private 20‐Jun 10‐Jul 25‐Jul 7‐Aug
022 Flynn Unit 26 231 West USFWS 27‐Jun 12‐Jul 26‐Jul 9‐Aug
003 Boat access 18 223 East Private 27‐Jun 12‐Jul 31‐Jul 15‐Aug
019 Boat access 24 222 West Private 27‐Jun 12‐Jul 31‐Jul 15‐Aug
051 Kopta Slough 28 220.5 West TNC 15‐Jun, 16‐Jun 2‐Jul 17‐Jul 1‐Aug
007 Kopta Slough 23 219 West TNC 15‐Jun, 16‐Jun 2‐Jul 18‐Jul 1‐Aug
035 Rio Vista Unit 26 218 East USFWS 18‐Jun 3‐Jul 18‐Jul 5‐Aug
045 Rio Vista Unit 31 216.5 East USFWS 18‐Jun 4‐Jul 18‐Jul 6‐Aug
002 Rio Vista Unit 26 215.5 East USFWS 18‐Jun 3‐Jul 19‐Jul 2‐Aug
013 Boat access 16 211.5 East Private 25‐Jun 11‐Jul 30‐Jul 14‐Aug
029 Foster Island Unit 33 210 West USFWS 25‐Jun 11‐Jul 30‐Jul 14‐Aug
034 Boat access 27 205.5 West GCID 25‐Jun 11‐Jul 30‐Jul 14‐Aug
018 Wilson's Landing Unit 31 204 East CA DFG 25‐Jun 11‐Jul 30‐Jul 14‐Aug
009 Pine Creek Unit 27 198.5 East USFWS 15‐Jun, 16‐Jun 2‐Jul 17‐Jul 1‐Aug 21‐Aug
041 Pine Creek Unit 27 198 West USFWS 15‐Jun, 16‐Jun 1‐Jul 15‐Jul 1‐Aug
077 Pine Creek North Unit 16 197 East CA DFG 29‐Jun 14‐Jul 28‐Jul 15‐Aug
25Transect # River Side of Round Round Round Round Round
# Location Name Points Mile River Owner 11 2 3 4 5
025 Pine Creek West Unit 25 195.5 West CA DFG 26‐Jun 10‐Jul 25‐Jul 8‐Aug
049 Pine Creek West Unit 24 195 West CA DFG 26‐Jun 7‐Jul 23‐Jul 9‐Aug
005 Capay Unit 30 194 West USFWS 28‐Jun 13‐Jul 27‐Jul 13‐Aug
017 Bidwell‐Sacramento River SP 28 194 East CA DPR 26‐Jun 11‐Jul 26‐Jul 8‐Aug
033 Phelan Island Unit 28 191.5 West USFWS 15‐Jun, 16‐Jun 1‐Jul 15‐Jul 1‐Aug
037 Phelan Island Unit 33 191 West USFWS 15‐Jun, 16‐Jun 3‐Jul 17‐Jul 1‐Aug 20‐Aug
020 South Ord Unit 27 183 West USFWS 18‐Jun 3‐Jul 18‐Jul 5‐Aug 22‐Aug
052 Jacinto Unit 20 180.5 West CA DFG 26‐Jun 9‐Jul 24‐Jul 6‐Aug
024 Llano Seco Riparian Sanctuary 31 179.5 East USFWS 19‐Jun 4‐Jul 23‐Jul 9‐Aug 20‐Aug
076 Llano Seco Riparian Sanctuary 34 176.5 East USFWS 29‐Jun 14‐Jul 28‐Jul 15‐Aug
040 Llano Seco Riparian Sanctuary 24 176 East CA DFG 28‐Jun 12‐Jul 26‐Jul 10‐Aug 22‐Aug
031 Oxbow Unit 29 175 East CA DFG 20‐Jun 10‐Jul 25‐Jul 8‐Aug
043 Hartley Island Unit 28 175 East USFWS 20‐Jun 10‐Jul 25‐Jul 7‐Aug
059 Beehive Unit 23 170 West CA DFG 29‐Jun 14‐Jul 27‐Jul 16‐Aug 22‐Aug
055 Codora Unit 30 168 West USFWS 27‐Jun 9‐Jul 24‐Jul 8‐Aug
011 Packer Unit 8 167 West USFWS 21‐Jun 11‐Jul 25‐Jul 11‐Aug
027 Packer Unit 31 167 West USFWS 19‐Jun 4‐Jul 23‐Jul 9‐Aug 20‐Aug
023 Site 21 25 165 West Glenn County 26‐Jun 7‐Jul 23‐Jul 8‐Aug 22‐Aug
039 Drumheller Unit 30 164.5 East USFWS 27‐Jun 12‐Jul 26‐Jul 12‐Aug
048 Princeton Southeast Unit 27 161.5 East CA DFG 20‐Jun 9‐Jul 24‐Jul 6‐Aug
032 Boat access 14 158.5 East Private 19‐Jun 9‐Jul 24‐Jul 6‐Aug
016 Moulton Island 10 157 East Private 19‐Jun 9‐Jul 24‐Jul 6‐Aug
028 Colusa‐Sacramento River SP 27 144.5 West CA DPR 18‐Jun 3‐Jul 18‐Jul 4‐Aug
26Feather River Sites
Transect # River Side of Round Round Round Round Round
# Location Name Points Mile River Owner 1 2 3 4 5
143 O'Connor Lakes Unit 28 NA West CA DFG 21‐Jun 5‐Jul2 19‐Jul 2‐Aug
159 Star Bend Unit 28 NA East CA DFG 22‐Jun 6‐Jul 20‐Jul 3‐Aug
2
150 Abbott Lake Unit 35 NA West CA DFG 21‐Jun 5‐Jul 19‐Jul 2‐Aug
153 Lake of the Woods Unit 27 NA East CA DFG 22‐Jun 6‐Jul 20‐Jul 3‐Aug
154 Lake of the Woods Unit 30 NA East CA DFG 22‐Jun 6‐Jul 20‐Jul 3‐Aug
157 Bobelaine Reserve 29 NA West Sac. Audubon 21‐Jun 5‐Jul2 19‐Jul 2‐Aug
2
161 Bobelaine Reserve 28 NA West Sac. Audubon 21‐Jun 5‐Jul 19‐Jul 2‐Aug
149 Bear Weir 32 NA East CA DWR 22‐Jun 6‐Jul 20‐Jul 3‐Aug
2
141 Nicolaus 17 NA East Private 21‐Jun 5‐Jul 19‐Jul 2‐Aug
145 Nelson Slough Unit 30 NA West CA DFG 22‐Jun 6‐Jul 20‐Jul 3‐Aug
27You can also read