Wetland restoration yields dynamic nitrate responses across the Upper Mississippi river basin
←
→
Page content transcription
If your browser does not render page correctly, please read the page content below
PAPER • OPEN ACCESS

Wetland restoration yields dynamic nitrate responses across the Upper
Mississippi river basin
To cite this article: Grey R Evenson et al 2021 Environ. Res. Commun. 3 095002

View the article online for updates and enhancements.

                              This content was downloaded from IP address 46.4.80.155 on 20/09/2021 at 05:33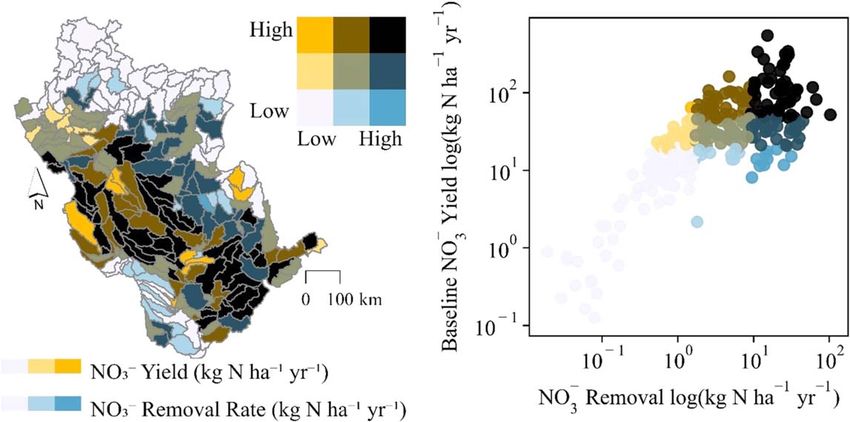
Environ. Res. Commun. 3 (2021) 095002 https://doi.org/10.1088/2515-7620/ac2125
PAPER
Wetland restoration yields dynamic nitrate responses across the
OPEN ACCESS
Upper Mississippi river basin
RECEIVED
22 July 2021
Grey R Evenson1,∗ , Heather E Golden1,∗ , Jay R Christensen1 , Charles R Lane2 , Adnan Rajib3 ,
REVISED
18 August 2021
Ellen D’Amico4 , David Tyler Mahoney5 , Elaheh White6 and Qiusheng Wu7
1
U.S. Environmental Protection Agency, Office of Research and Development, Center for Environmental Measurement and Modeling,
ACCEPTED FOR PUBLICATION
25 August 2021 Cincinnati, OH, United States of America
2
U.S. Environmental Protection Agency, Office of Research and Development, Center for Environmental Measurement and Modeling,
PUBLISHED
8 September 2021
Athens, GA, United States of America
3
Department of Environmental Engineering, Frank H. Dotterweich College of Engineering, Texas A&M University, Kingsville, TX, United
States of America
Original content from this 4
Pegasus Corporation c/o U.S. Environmental Protection Agency, Office of Research and Development, Cincinnati, OH, United States of
work may be used under
the terms of the Creative
America
5
Commons Attribution 4.0 Civil and Environmental Engineering Department, University of Louisville, Louisville, KY, United States of America
6
licence. Oak Ridge Institute for Science and Education c/o U.S. Environmental Protection Agency, Office of Research and Development,
Any further distribution of Cincinnati, OH, United States of America
7
this work must maintain Department of Geography, University of Tennessee, Knoxville, TN, United States of America
attribution to the ∗
Authors to whom any correspondence should be addressed.
author(s) and the title of
the work, journal citation E-mail: evenson.grey@epa.gov and golden.heather@epa.gov
and DOI.
Keywords: nitrogen, denitrification, prioritization, targeting, non-floodplain wetlands, geographically isolated wetlands
Supplementary material for this article is available online
Abstract
Wetland restoration is a primary management option for removing surplus nitrogen draining from
agricultural landscapes. However, wetland capacity to mitigate nitrogen losses at large river-basin
scales remains uncertain. This is largely due to a limited number of studies that address the cumulative
and dynamic effects of restored wetlands across the landscape on downstream nutrient conditions.
We analyzed wetland restoration impacts on modeled nitrate dynamics across 279 subbasins
comprising the ∼0.5 million km2 Upper Mississippi River Basin (UMRB), USA, which covers eight
states and houses ∼30 million people. Restoring ∼8,000 km2 of wetlands will reduce mean annual
nitrate loads to the UMRB outlet by 12%, a substantial improvement over existing conditions but
markedly less than widely cited estimates. Our lower wetland efficacy estimates are partly attributed to
improved representation of processes not considered by preceding empirical studies − namely the
potential for nitrate to bypass wetlands (i.e., via subsurface tile drainage) and be stored or transformed
within the river network itself. Our novel findings reveal that wetlands mitigate surplus nitrogen
basin-wide, yet they may not be as universally effective in tiled landscapes and because of river network
processing.
1. Introduction
Excess nutrient loads to landscapes from agricultural intensification and urbanization continue to cause chronic
global water quality issues. Surplus nitrogen (i.e., the difference between nitrogen fertilizer inputs and nitrogen
removed with harvested crops) in agricultural landscapes is a particular concern because nitrogen’s mobile
forms (e.g., nitrate) are readily transported to waterways, contributing to eutrophication, harmful algal blooms,
and human health impacts across freshwater and marine systems (Rabalais et al 2002, Diaz and Rosenberg 2008).
The∼0.5 million km2 Upper Mississippi River Basin, USA, is a prominent exemplar of how surplus nitrogen
continues to elicit annual hypoxic ‘dead zones’ at the basin’s outlet to the Gulf of Mexico (Turner et al 2008). The
largely agricultural basin’s degraded aquatic systems also reflect the consequences of large-scale and long-term
changes to land use and management (Turner and Rabalais 2003, Van Meter and Basu 2017).
© 2021 The Author(s). Published by IOP Publishing Ltd
Environ. Res. Commun. 3 (2021) 095002 G R Evenson et al
While ‘natural’ wetlands continue to be lost at high rates across the globe (Creed et al 2017), wetland
restoration and construction are primary management options for mediating degraded water quality. Decades
of studies demonstrate wetlands’ strong capacity to remove nitrogen (N) from stormwater and agricultural
runoff (Johnston 1991, Kadlec et al 2000, Kalcic et al 2018) via plant uptake, denitrification, and settling of
organic particulates (Seitzinger et al 2006, Van Cleemput et al 2007). Therefore, programs such as the US
Department of Agriculture’s (USDA) Wetland Reserve Easements (Morefield et al 2016) and the European Land
Conservation Network’s (ELCN) promotion of private land easements (Račinska and Vahtrus 2018) are
ubiquitous.
However, uncertainty prevails regarding the potential of wetlands to mitigate nutrient conditions across
large river basin scales (Fisher and Acreman 2004, Thorslund et al 2017, Hansen et al 2018, Golden et al 2019).
Restored wetlands show considerable potential for cumulatively removing N across landscapes, as demonstrated
by studies applying averaged empirical N removal rates from individual wetlands to landscape scales (Mitsch
et al 2001, Cheng and Basu 2017). This is particularly true if restoration is targeted in high N source areas (Cheng
et al 2020). These studies provide a solid foundation for understanding the capacity of wetland nitrate removal
across landscapes. Yet previous work assumes steady-state or stationary relationships between wetland N
removal and in-stream N concentrations – relationships that typically do not exist in watersheds, i.e., dynamic,
nonstationary systems.
A clear gap therefore remains in connecting dynamic landscape wetland N removal to in-stream responses,
particularly across large river basins. We pose a critical scientific question to fill this niche: What are the
quantifiable links between cumulative landscape-scale wetland N removal and changes in N-based water quality
across large river basins (Figure S1 (available online at stacks.iop.org/ERC/3/095002/mmedia)) – both at the
river basin outlet and at the scale of its contributing subbasins?This question remains unanswered, in part,
because – to our knowledge – no process-based model exists that explicitly integrates landscape wetland N
dynamics to assess the in-stream N response to wetland restoration across large spatial extents.
Our goal was therefore to simulate the potential of wetland restoration to reduce nitrate as N (NO- 3 –N,
hereafter NO- 3 ) yields, loads, and concentrations across 279 subbasins and the outlet of the ∼0.5 million km2
Upper Mississippi River Basin (UMRB), an agriculturally intensive basin that is the largest contributor of excess
nitrogen to the Gulf of Mexico hypoxic ‘dead zones’ (Crawford et al 2019). The basin’s poor water quality
conditions have been attributed to the use of synthetic fertilizers for agricultural production as well as the
historical loss of wetlands to agricultural development and urbanization. Additionally, a substantial and
increasing portion of the basin is artificially drained via tiles (i.e., subsurface drainage pipes), which remove
water from soils for increased agricultural production while facilitating the rapid transport of nitrate off the land
and into downstream waters (David and Gentry 2000, Tomer et al 2003, David et al 2010).
We specifically assessed how the location and relative magnitude of subbasin (or ‘local’) scale wetland
restoration across the UMRB affected NO- 3 yields, loads, and concentrations at the river basin outlet. We did this
by: (1) building and calibrating a river basin scale process-based model of the UMRB that explicitly accounts for
wetland hydrologic and nutrient cycling dynamics – and those throughout the river network, (2) simulating the
restoration of the wetlands outside of floodplains (i.e. non-floodplain wetlands), and (3) evaluating changes in
NO- 3 yields, loads, and concentrations between our baseline and restoration models – at both subbasin and river
basin outlets. Our approach provides new insights into how nitrate responds to wetland restoration across large
river basins because it explicitly simulates wetland water and nutrient cycling – unlike other stationary empirical
approaches or large river basin models (Golden et al 2019).
2. Methods
2.1. Baseline model development
We used the Soil and Water Assessment Tool (SWAT) model (version 659) to assess the effects of wetland
restoration on changes in NO- 3 yields, loads, and concentrations across the UMRB (Figure S2). SWAT is a
process-based watershed-scale hydrologic model commonly applied to simulate management impacts on
hydrologic flows and aquatic nutrients (Gassman et al 2007). The model discretizes a watershed into a series of
subbasins, which are composed of one or more hydrologic response units (HRUs), or areas of similar soil, slope,
and land use properties, and simulates a daily water and nutrient balance for each HRU (Neitsch et al 2011).
Transformation of nitrogen in the soil is controlled by partial differential equations that represent the nitrogen
cycle (e.g., N2 fixation, N plant uptake, denitrification, leaching, and volatilization; see Text S1 for further
details).
Each HRU’s simulated daily streamflow and nutrient loads then enter the river network, where nutrients are
stored and processed (i.e., removed permanently or cycled through the river system) and are routed
progressively downstream to the basin outlet (Neitsch et al 2011). In-stream transformation of nitrogen in the
2
Environ. Res. Commun. 3 (2021) 095002 G R Evenson et al
Figure 1. Spatial distribution and magnitudes of the primary inputs and outputs for the Upper Mississippi River Basin (UMRB)
SWAT model. For each of the model’s subbasins (n=279), the figure shows (A) the dominant land use type and the presence of tile
drainage; (B) baseline or ‘existing’ wetland area (min-max=0–940 km2) and potentially restorable wetland area (min-max=
q0–478 km2); (C) nitrogen (N) fertilizer (total synthetic+organic) applications (min-max=0–91 kg ha−1 yr−1) and initial soil
organic N (total N; min-max=23–44,000 kg ha−1 yr−1); (D) baseline predicted nitrate (NO- 3 ; min-max=0–103 kg N ha
−1 −1
yr )
and organic N yields (min-max=0–90 kg N ha−1 yr−1). The color gradients are binned by quantiles. Supplementary material
provides additional model input and calibration information.
model is governed by partial differential equations representing growth and decay of algae, biological oxidation
rates for different nitrogen species, water temperature, and settling of organic N with sediment (see Text S1).
We extended a recently developed wetland-integrated SWAT model for the URMB focused on river basin
hydrology (Rajib et al 2020), updating the published version to simulate the response of NO- 3 to river basin-scale
wetland restoration scenarios. Novel to this study, we substantially modified model inputs (Text S2; figure 1) and
agricultural management operations (Text S3), calibrated wetland N removal rates (see below and Text S6), and
calibrated nitrate loads at 19 sites across the UMRB (Text S4; Tables S2-S5). The model was constructed to
include 279 subbasins with a mean area of 1,600 km2 (SD=1,100 km2), each having a single HRU depicting the
subbasin’s dominant land use (figure 1(A)), soil, and slope.
Existing, or ‘baseline’, model wetlands (figure 1(B)) were identified as topographic depressions that
intersected non-floodplain wetlands within the National Wetlands Inventory (Lane and D’Amico 2016, Wu and
Lane 2016, US Fish & Wildlife Service 2018). From hereafter we refer to these non-floodplain wetlands as
‘wetlands’. Baseline wetlands covered ∼23,000 km2 of the basin (or ∼5% of UMRB area). Further information
regarding physical wetland representations in the model is provided in Text S5 and Table S1. The complete, new
model set-up resulted in baseline N inputs and outputs depicted in figures 1C and 1D.
Wetland NO- 3 removal was simulated at a daily time-step per each subbasin (see Text S6). For each day, the
subbasin’s wetlands received a constant fraction (specified as the fraction of land draining to the wetlands) of the
subbasin’s simulated daily flow and nutrient load, comprising surface, shallow subsurface and groundwater
contributions. Tile effluent could not be routed directly to wetlands in SWAT (similar to most existing large river
−1
basin models; see section 4.2). The wetland’s NO- 3 removal (kg day ) was then simulated as the product of the
−3
wetland’s daily simulated surface area (ha), the wetland’s daily simulated NO- -
3 concentration ([ NO3 ]; kg m ), a
user-specified and calibrated wetland N-removal constant (m yr−1), and a constant unit conversion factor
(Neitsch et al 2011). The model’s N-removal constant is intended to account for denitrification and plant uptake
of NO- 3 of the aggregated wetland within each subbasin (Ikenberry et al 2017). Spillage and a corresponding
-
[ NO3 ] from a subbasin’s wetland to the nearest stream reach occurred whenever the wetland’s daily simulated
storage exceeds the wetland’s maximum storage capacity.
3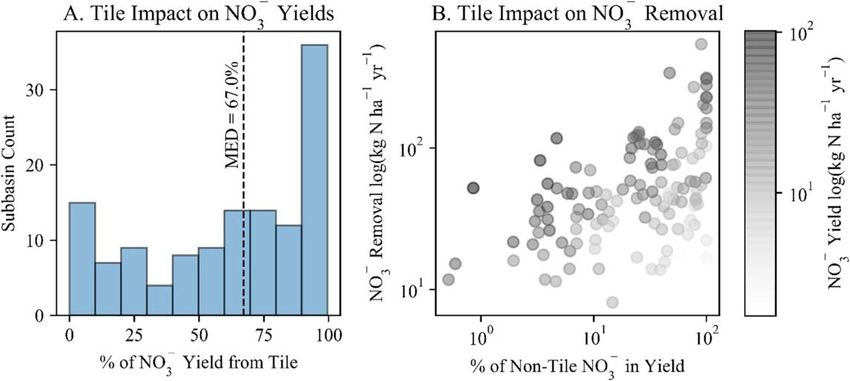
Environ. Res. Commun. 3 (2021) 095002 G R Evenson et al
2.2. Wetland restoration scenario analyses
We simulated change in NO- 3 concentrations, yields, and loads at the outlets of the 279 subbasins and the UMRB
in response to restoration of potentially restorable wetlands (Figure S3). Our restoration simulations considered
only wetlands outside of floodplains (i.e., non-floodplain wetlands) because of their proximity to nonpoint
pollution sources (Cheng et al 2020) and the capacity to classify their previous (historic) locations for restoration
based on topographic analyses. Potentially restorable wetlands (figure 1(B)) were defined as topographic
depressions (Wu and Lane 2016) that did not intersect current NWI non-floodplain wetlands, i.e., those not
included in the baseline model. The depressions were assumed to indicate locations that may have historically
functioned as wetlands but were drained or otherwise converted to support alternative land uses (primarily
agricultural production within the UMRB). Upland areas that did not contain depressions were not considered
as potential locations for wetland restoration. The potentially restorable wetlands totaled ∼8,000 km2 (or ∼2%
of UMRB area) and ranged from 0 to 12% of subbasin areas.
We first developed and simulated a single model scenario depicting complete restoration of the basin’s
potentially restorable wetlands. With this scenario, we assessed the maximum capacity of wetland restoration to
reduce NO- 3 levels at subbasin and river basin outlets. The scenario was constructed by revising the baseline
model’s wetland representation to include the summed physical attributes (i.e., storage capacity, surface area,
catchment area) of both the basin’s existing wetlands (used in the baseline calibrated model) and potentially
restorable wetlands. This scenario increased the wetland maximum surface area from 0 to 478 km2 across the
UMRB subbasins (mean=+28 km2). The additional maximum wetland storage capacity in the wetland
restoration scenario ranged from 0 to 2.4×10⁸ m3 (mean=1.6 · 107 m3), and the proportion of subbasins
draining to wetlands increased by 0 to 33% (mean=4%). The model scenario also depicted a corresponding
reduction in fertilizer application rates to account for the quantity of land that was assumed to be converted from
agricultural production to restored wetland (Text S7).
We additionally ran a suite of 279 model scenarios, each targeting complete restoration of a single subbasin’s
wetlands, in isolation. We hereafter term this approach subbasin ‘targeting’, i.e., targeting individual subbasins
one-at-a-time for wetland restoration. For each scenario, we revised the baseline model’s description of
wetlands in only the targeted subbasin to depict the summed physical attributes of the targeted subbasin’s
existing and potentially restorable wetlands (Table S1). In turn, we reduced the quantity of fertilizer applied in
only the targeted subbasin to account for the subbasin’s assumed conversion of land from agricultural
production to restored wetland (Text S7).
The model scenarios – depicting either basin-wide or subbasin-targeted restoration – were compared against
the baseline model, which incorporated representation of only existing or ‘baseline’ wetlands, to facilitate
assessment of restoration effects in three ways. First, we simulated the daily effect of the restored wetlands on
discharge (Q; mm yr−1), NO- 3 yields (kg N ha
−1 −1
yr ), and NO- −1
3 concentrations (mg N l ), which we averaged
to and presented as mean annual changes at the UMRB outlet and the UMRB subbasin outlets. Second, we
−1 −1
simulated the restored wetland NO- 3 removal rates (kg N ha yr ) within each subbasin, which we calculated
as the quotient of the mean annual NO3 load reduction from each subbasin’s wetlands (kg N yr−1) and the area
-
of restored wetlands (ha) in the subbasin. Lastly, we compared the magnitude of subbasin (or ‘local’) outlet NO- 3
load reductions (kt N yr−1) from wetland restoration to NO- −1
3 load reductions (kt N yr ) at the UMRB outlet.
3. Results
3.1. River basin-scale nitrate reductions
Simulated basin-wide wetland restoration (8,000 km2 of potentially restorable wetlands, or 2% of the UMRB
−1
area) reduced the mean annual river basin outlet NO- 3 load by 53 kt N yr , or by 12%. Approximately 93% of
this load reduction was directly attributed to restored wetland storage and removal of NO- 3 ; the remainder
resulted from the accompanying reduction in fertilizer applications atop converted land (see Text S8). Basin-
−1 −1
wide wetland restoration also reduced the mean annual NO- 3 yield at the river basin outlet by 1.2 kg N ha yr ,
−1 −1
with year-to-year yield reductions ranging from 0.77 to 1.66 kg N ha yr (figure 2(A)). Mean annual
discharge (Q) at the basin outlet decreased by 15 mm yr−1 (5%), with year-to-year reductions ranging from 10 to
18.4 mm yr−1 (figure 2(B)). Year-to-year reductions in nitrate concentrations, hereafter symbolized as [ NO- 3 ], at
the river basin outlet fluctuated between 0.16 and 0.38 mg N L−1 (figure 2(C)), and the basin’s mean annual
−1
[ NO- 3 ] declined by 0.25 mg N L (7%).
3.2. Subbasin-scale nitrate reductions
The effects of subbasin-targeted wetland restoration were varied. Restoration reduced NO- 3 yields at the 279
subbasin outlets by 0 to 10.6 kg N ha−1 yr−1 and Q by 0 to 135.6 mm yr−1 (figure 3(A)–(B)). While restoration
reduced [ NO- -
3 ] at a majority of subbasin outlets, it tended to increase [ NO3 ] in subbasins with higher baseline
4Environ. Res. Commun. 3 (2021) 095002 G R Evenson et al
Figure 2. Yearly basin-wide wetland restoration impacts on simulated (A) nitrate yields, (B) discharge (Q), and (C) nitrate
concentrations ([ NO- 3 ]) simulations at the UMRB outlet. The scatterplots showing simulated baseline (x-axes) and the difference (Δ)
between wetland restoration values and baseline values (y-axes) at the basin outlet, for each year in the simulation period (2008–2017;
n = 10).
Figure 3. Average annual wetland restoration impacts on simulated subbasin-scale (A) nitrate yields, (B) discharge (Q), and (C) nitrate
concentrations ([ NO- 3 ]). The point density plots show simulated baseline (x-axes) and the difference (Δ) between wetland restoration
values and baseline values (y-axes) across subbasins (n = 279). The color gradient for subfigures (A-C) show the number of subbasins
represented by each hexagon: darker colors represent high point densities; lighter colors represent low point densities.
−1
[ NO- -
3 ] simulations (figure 3(C)), i.e., of the 25 subbasins with mean annual [ NO3 ] 10 mg N L , 23 (92%)
had increased [ NO- -
3 ] following restoration. Changes in [ NO3 ] from wetland restoration ranged from −1.25 to
−1
9.1 mg N L across subbasin outlets.
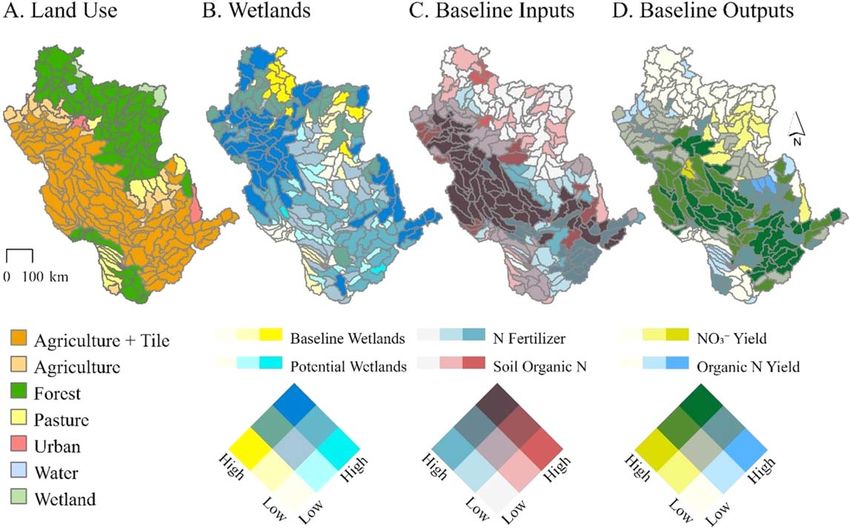
Subbasin-targeted restoration revealed spatial variations in wetland NO- 3 reductive capacity. Simulated
−1 −1
wetland NO- 3 removal rates ranged from 0.13 to 546 kg N ha yr across UMRB subbasins (mean=
50 kg N ha−1 yr−1). The restored wetlands removed NO- 3 at higher rates in subbasins with higher baseline
-
simulated NO3 yields, i.e. the basin’s critical source areas or ‘hotspots’ (Evenson et al 2021); figure 4. These
subbasins tended to be in the basin’s mid-section where agricultural activities and subsurface tile drainage are
prevalent (figure 1(A), (D)). In fact, all subbasins above the 75th percentile NO- 3 yields were simulated as tile
drained agriculture.
Subsurface tile drains limited the restored wetlands’ NO- 3 reductive capacity. Tile drains were an important
pathway for NO- 3 loss – or export – from tile drained subbasins; model structure prevented routing this effluent
directly to wetlands. The median percentage of total subbasin NO- 3 export via tiles was 67% (figure 5(A)). We
accordingly observed that restored wetland NO3 removal rates increased as the percentage of non-tile NO-
-
3 (i.e.,
NO- -
3 contributions from surface, shallow subsurface and groundwater flows) in the total NO3 yield became
larger (figure 5(B)).
3.3. Relating subbasin-scale nitrate reductions to the river basin outlet
We observed a clear linear relationship between wetland restoration-affected NO- 3 load reductions at the
subbasin outlets and those of the river basin outlet (figure 6). The relationship was strong at higher magnitude
load reductions at the subbasin scale (moving towards the upper-right corner of the figure 6 scatterplot).
However, approximately equivalent magnitude NO- 3 load reductions at the basin outlet were less likely to occur
if wetland restoration resulted in low-magnitude subbasin NO- 3 load reductions. Restoration-affected subbasin
5Environ. Res. Commun. 3 (2021) 095002 G R Evenson et al
−1 −1
Figure 4. Restored wetlands generally removed NO- 3 at higher average annual rates (min-max=0–547 kg N ha yr ) in subbasins
−1 −1
with higher average annual baseline NO- 3 yields (min-max=0–103 kg N ha yr ). The color scheme, binned by quantiles, is shared
between the scatterplot and map.
Figure 5. Tile drains were an important NO- -
3 loss pathway in tile drained subbasins (median percentage of total NO3 yield
contributed via tiles was 67% in these subbasins (A), and these drains effectively reduced wetland capacity to remove NO- 3 because tile
effluent did not enter the wetlands (B). In (B), NO- 3 was removed at higher rates (moving further from the origin on the y-axis) as the
percentage of non-tile NO- - -
3 (i.e., NO3 contributions from surface, shallow subsurface and groundwater flows) in the total NO3 yield
became larger (moving further from the origin on the x-axis), though this relationship was weaker for subbasins with lower magnitude
total NO-3 yields (see lighter colored points).
scale load reductions resulted in no change or even minor increases in NO- 3 loads at the basin outlet in 19, or 7%,
of the subbasins (see figure 6 points and subbasins outlined in black). These subbasins were mostly in the
northern portion of the basin, further from the basin outlet – affording long travel times through the river
network and thereby elevated potential for storage and transformation processes to occur (Text S1) – and with a
relatively high number of existing wetlands, as represented in the baseline model (figure 1).
4. Discussion
4.1. Implications for the science and management of wetland restoration
It is clear that wetlands can effectively remove nitrogen across landscapes (Johnston 1991, Cheng and
Basu 2017). However, apart from recent empirical approaches that assume stationary watershed conditions
(Hansen et al 2018, Cheng et al 2020), the cumulative effects of wetlands on downgradient aquatic nutrient
6Environ. Res. Commun. 3 (2021) 095002 G R Evenson et al
−1
Figure 6. Subbasin scale NO- -
3 load reductions (min-max=0–3.3 kt yr ) did not always result in NO3 load reductions of equivalent
magnitude at the basin outlet (min-max=−0.069–5.5 kt yr−1), particularly at lower NO- 3 reduction magnitudes. While linearly
correlated (see scatterplot), the relationship between subbasin and basin outlet NO- 3 load reductions only became strong at higher
magnitudes of NO- -
3 load reductions. Subbasins in which simulated restoration reduced subbasin scale NO3 loads but did not change
or increased NO- 3 loads at the basin outlet are outlined in black in both the scatterplot and map. The color scheme, binned by
quantiles, is shared between the scatterplot and map.
conditions remain largely elusive (Golden et al 2019). Watersheds are nonstationary systems, requiring dynamic,
process-based simulations to quantify the link between wetland restoration and watershed nutrient conditions,
particularly across large river basins. Using this process-based approach, we found that wetland restoration
across substantially reduces NO- 3 yields and loads (and to a lesser degree, concentrations) across the UMRB –
with caveats.
Restoration of 8,000 km2 of the URMB’s historic wetlands would lead to a 12% reduction in mean annual
-
NO3 loads at the river basin outlet. These benefits were achieved by an average 4% increase in subbasin area
draining to wetlands (i.e., the fraction of land draining to wetlands following restoration) and without additional
conservation practices (e.g., tile-effluent management, described more below). Our results suggest that higher
magnitude load reductions may be attained via minor increases in the quantity of land draining to wetlands. We
therefore underscore the capacity of wetlands to benefit water quality at river-basin scales (Golden et al 2019,
Cheng et al 2020), in the greater Mississippi River Basin specifically (Mitsch et al 2001), in portions of the UMRB
(Hansen et al 2018), and at smaller watershed-scales (Arheimer and Wittgren 2002, Czuba et al 2018).
Yet our results indicate that wetland restoration does not uniformly reduce NO- 3 in subbasins across this
large river basin. Additional or complementary management practices will be needed to meet N load reduction
targets set for the greater Mississippi River Basin – and likely other large river basins. Our simulated 53 kt yr−1
(12%) reduction in mean annual NO- 2
3 loads following restoration of 8,000 km of wetlands falls short of the
20% total nitrogen (TN) load reduction target set for the year 2025 (Hypoxia Task Force 2015) – noting that
NO- 3 comprised 86% of the baseline model mean annual TN load. These results also highlight a need for cost-
benefit analyses (à la Singh et al (2019) and Hansen et al (2021)) to inform restoration decision making processes.
Further, our simulations provide a low estimate of the extent to which wetland restoration reduces river
basin nitrogen loads at the outlet, compared to other recent studies. For example, Cheng et al (2020) predicted
targeted wetland restoration resulting in a 467 kt yr−1 N load reduction for the greater Mississippi River Basin –
meaning a 115 kt yr−1 decrease in N loads for the UMRB, assuming restoration of the same extent of potentially
restorable wetland area considered in our analysis (see Text S9 and Table S2). This is almost double our
simulated NO- 3 load reductions in response to wetland restoration across the UMRB. Based on our findings, we
suggest that wetland restoration should be implemented in concert with additional in-field conservation
practices (e.g., cover crops), edge-of-field practices that treat tile-effluent (e.g., constructed wetlands or
denitrifying bioreactors (Crumpton et al 2020)), or improved fertilizer management with reductions in fertilizer
inputs to the basin.
Our methodological approach may, in part, explain our lower NO- 3 reductions to wetland restoration
relative to previously published studies (Mitsch et al 2001, Cheng et al 2020). Cheng et al (2020), for example,
used the spatial distribution of wetlands and wetland nutrient removal rate estimates to calculate cumulative
wetland removal potential – and this removal was assumed to be directly realized at the basin outlet as a
7Environ. Res. Commun. 3 (2021) 095002 G R Evenson et al
steady-state basin condition. In contrast, our model simulated dynamic wetland NO- 3 removal, estimated via the
daily expansion and contraction of wetland surface area and daily changes in [ NO- 3 ].
Our results also suggest potentially muted downstream impacts of wetland restoration because of landscape
and in-stream N processing that is represented in the model (Text S1), highlighting the importance of
considering these processes when assessing river basin-scale effects of wetland restoration. For example, tile
drainage reduced wetland capacity to remove NO- 3 , figure 5; Text S3). Further, wetland restoration produced
dissimilar subbasin and river basin outlet load reductions if subbasins had low-magnitude NO- 3 decreases
(figure 6) – and these differences resulted from the model’s simulation of in-stream N processes and removal of
additional N (figure 6; Text S1).
While our findings demonstrate the benefits of targeted approaches to wetland restoration, we suggest a
careful focus on processes that may limit wetland capacity to receive surplus nitrogen. We found restoration was
more effective within the basin’s high N yield areas (figure 4), which lends credence to targeting approaches.
However, restoration targeting these high N yield subbasins was less effective in subbasins with elevated NO- 3
losses via tile drains (figure 5), enhanced by tile effluent not being routed to wetlands in the model. While
wetlands are sometimes restored or constructed specifically to receive tile effluent (Crumpton et al 2020), our
model reflects the UMRB as a whole: an expansively tiled landscape that promotes hydrologic connections and
unmitigated nutrient transport. Thus, our results support targeted restoration of wetlands in high nitrogen yield
or source areas but suggest that efforts may be less successful where tile-drains continue to bypass wetlands,
limiting wetland capacity to receive and remove NO- 3 from the landscape. Tile drainage should be considered in
addition to other landscape characteristics and processes - e.g., climate change (Bosch et al 2014), and nutrient
legacies (Van Meter et al 2018) - in prioritizing restoration efforts and projecting river-basin scale effects.
4.2. Opportunities for future research
River-basin scale simulations necessitate aggregating fine-scale processes that may affect restoration efficacy. For
example, we simulated wetland NO3–N removal as a function of a N-removal constant, depicting the aggregate
effect of wetland denitrification, settling, and plant-uptake processes per subbasin. Model simulations were
highly sensitive to the N removal constant (pEnviron. Res. Commun. 3 (2021) 095002 G R Evenson et al
tile drains and in-stream storage and processing of N) may reduce wetland capacity to capture and remove NO- 3
and affect change at the basin outlet – an important finding not yet revealed in previous studies. Specifically, our
model simulated dynamic, intervening processes (e.g., subsurface tile drains and in-stream storage and
processing of N) between the wetland and the subbasin, and river basin outlets. While it was outside the scope of
this work to discern the exact in-stream processes controlling NO- 3 dynamics, we highlight a need for additional
process-based river basin scale analyses of wetland impacts downstream nutrient conditions.
We show that wetland restoration can be an effective means of reducing NO- 3 loads to the lower Mississippi
and will likely mitigate the Gulf of Mexico hypoxia. However, management would benefit from investments in
other mitigation actions, based on our findings that wetland restoration alone in this highly modified and tiled
large river basin would not meet load reduction targets. Wetland restoration may therefore serve as an effective
pillar for overarching water quality mitigation plans that incorporate supplemental conservation actions (e.g.,
cover crops, tile-drainage mitigation, and strategic nutrient management).
Acknowledgments
This paper has been reviewed in accordance with the US Environmental Protection Agency’s peer and
administrative review policies and approved for publication. Mention of trade names or commercial products
does not constitute endorsement or recommendation for use. Statements in this publication reflect the authors’
professional views and opinions and should not be construed to represent any determination or policy of the US
Environmental Protection Agency. A.R. and Q.W. were funded through the Department of Defense (award
number FAIN # W912HZ2020050). We appreciate helpful suggestions from Brent Johnson and Robert Sabo.
Data availability statement
The data that support the findings of this study will be openly available following an embargo via the
Environmental Protection Agency Science Hub. Data will be available from 31 December 2021.
ORCID iDs
Grey R Evenson https://orcid.org/0000-0002-6035-1297
Heather E Golden https://orcid.org/0000-0001-5501-9444
Jay R Christensen https://orcid.org/0000-0003-4961-6132
Charles R Lane https://orcid.org/0000-0003-0066-8919
Adnan Rajib https://orcid.org/0000-0003-2302-1421
Ellen D’Amico https://orcid.org/0000-0002-3248-1000
David Tyler Mahoney https://orcid.org/0000-0003-0523-508X
Elaheh White https://orcid.org/0000-0003-1248-5247
Qiusheng Wu https://orcid.org/0000-0001-5437-4073
References
Arheimer B and Wittgren H B 2002 Modelling nitrogen removal in potential wetlands at the catchment scale Ecol. Eng. 19 63–80
Bosch N S, Evans M A, Scavia D and Allan J D 2014 Interacting effects of climate change and agricultural BMPs on nutrient runoff entering
lake Erie. J. Great Lakes Res. 40 581–9
Cheng F, Van Meter K, Byrnes D and Basu N 2020 Maximizing US nitrate removal through wetland protection and restoration Nature 588
625–30
Cheng F Y and Basu N B 2017 Biogeochemical hotspots: Role of small water bodies in landscape nutrient processing. Water Resour. Res. 53
5038–56
Crawford J T, Stets E G and Sprague L A 2019 Network controls on mean and variance of nitrate loads from the Mississippi river to the Gulf
of Mexico J. Environ. Qual. 48 1789–99
Creed I F, Lane C R, Serran J N, Alexander L C, Basu N B, Calhoun A J, Christensen J R, Cohen M J, Craft C and D’Amico E 2017 Enhancing
protection for vulnerable waters Nat. Geosci. 10 809–15
Crumpton W G, Stenback G A, Fisher S W, Stenback J Z and Green D I 2020 Water quality performance of wetlands receiving nonpoint‐
source nitrogen loads: Nitrate and total nitrogen removal efficiency and controlling factors. J. Environ. Qual. 49 735-744
Czuba J A, Hansen A T, Foufoula‐Georgiou E and Finlay J C 2018 Contextualizing wetlands within a river network to assess nitrate removal
and inform watershed management. Water Resour. Res. 54 1312–37
David M B, Drinkwater L E and McIsaac G F 2010 Sources of nitrate yields in the Mississippi river basin. J. Environ. Qual. 39 1657–67
David M B and Gentry L E 2000 Anthropogenic Inputs of Nitrogen and Phosphorus and Riverine Export for Illinois (USA: Wiley Online Library)
Diaz R J and Rosenberg R 2008 Spreading dead zones and consequences for marine ecosystems. Science 321 926–9
Evenson G R, Kalcic M, Wang Y-C, Robertson D, Scavia D, Martin J, Aloysius N, Apostel A, Boles C and Brooker M 2021 Uncertainty in
critical source area predictions from watershed-scale hydrologic models J. Environ. Manage. 279 111506
9Environ. Res. Commun. 3 (2021) 095002 G R Evenson et al
Fisher J and Acreman M 2004 Wetland nutrient removal: a review of the evidence. Hydrol. Earth Syst. Sci. 8 673–85
Gassman P W, Reyes M R, Green C H and Arnold J G 2007 The soil and water assessment tool: historical development, applications, and
future research directions. Trans. ASABE 50 1211–50
Golden H E, Rajib A, Lane C R, Christensen J R, Wu Q and Mengistu S 2019 Non-floodplain wetlands affect watershed nutrient dynamics: a
critical review. Environmental Science & Technology 53 7203–14
Hansen A T, Campbell T, Cho S J, Czuba J A, Dalzell B J, Dolph C L, Hawthorne P L, Rabotyagov S, Lang Z and Kumarasamy K 2021
Integrated assessment modeling reveals near-channel management as cost-effective to improve water quality in agricultural
watersheds Proc. Natl Acad. Sci. 118
Hansen A T, Dolph C L, Foufoula-Georgiou E and Finlay J C 2018 Contribution of wetlands to nitrate removal at the watershed scale. Nat.
Geosci. 11 127–32
Hypoxia Task Force 2015 Mississippi river/gulf of Mexico watershed nutrient task force: 2015 Report to Congress
Ikenberry C D, Crumpton W G, Arnold J G, Soupir M L and Gassman P W 2017 Evaluation of existing and modified wetland equations in
the SWAT model. JAWRA J. Am. Water Resour. Assoc. 53 1267–80
Johnston C A 1991 Sediment and nutrient retention by freshwater wetlands: effects on surface water quality. Critical Reviews in
Environmental Science and Technology 21 491–565
Kadlec R, Knight R, Vymazal J, Brix H, Cooper P and Haberl R 2000 Constructed Wetlands for Pollution Control: Processes, Performance,
Design and Operation (London, UK: IWA Publishing)
Kalcic M, Crumpton W, Liu X, D’Ambrosio J, Ward A and Witter J 2018 Assessment of beyond-the-field nutrient management practices for
agricultural crop systems with subsurface drainage. J. Soil Water Conserv. 73 62–74
Lane C R and D’Amico E 2016 Identification of putative geographically isolated wetlands of the conterminous United States. JAWRA J. Am.
Water Resour. Assoc. 52 705–22
Mitsch W J, Day J W, Gilliam J W, Groffman P M, Hey D L, Randall G W and Wang N 2001 Reducing nitrogen loading to the gulf of Mexico
from the Mississippi river basin: strategies to counter a persistent ecological problem: ecotechnology—the use of natural ecosystems
to solve environmental problems—should be a part of efforts to shrink the zone of hypoxia in the Gulf of Mexico. BioScience 51
373–88
Morefield P, LeDuc S D, Clark C M and Iovanna R 2016 Grasslands, wetlands, and agriculture: the fate of land expiring fromthe
Conservation Reserve Program in the Midwestern United States Environmental Research Letters 11 094005
Neitsch S L, Arnold J G, Kiniry J R and Williams J R 2011 Soil and Water Assessment Tool Theoretical Documentation Version 2009 Texas
Water Resources Institute
Rabalais N N, Turner R E and Wiseman W J Jr 2002 Gulf of Mexico hypoxia, aka ‘the dead zone’ Annual Review of ecology and Systematics 33
235–63
Račinska I and Vahtrus S 2018 The use of Conservation Easements in the European Union NABU Bundesverband
Rajib A, Golden H E, Lane C R and Wu Q 2020 Surface depression and wetland water storage improves major river basin hydrologic
predictions Water Resour. Res. 56 e2019WR026561
Seitzinger S, Harrison J A, Böhlke J, Bouwman A, Lowrance R, Peterson B, Tobias C and Drecht G V 2006 Denitrification across landscapes
and waterscapes: a synthesis Ecological Applications 16 2064–90
Singh N K, Gourevitch J D, Wemple B C, Watson K B, Rizzo D M, Polasky S and Ricketts T H 2019 Optimizing wetland restoration to
improve water quality at a regional scale Environ. Res. Lett. 14 064006
Thorslund J, Jarsjo J, Jaramillo F, Jawitz J W, Manzoni S, Basu N B, Chalov S R, Cohen M J, Creed I F and Goldenberg R 2017 Wetlands as
large-scale nature-based solutions: Status and challenges for research, engineering and management. Ecol. Eng. 108 489–97
Tomer M, Meek D, Jaynes D and Hatfield J 2003 Evaluation of Nitrate Nitrogen Fluxes from a Tile-Drained Watershed in Central Iowa
Journal of Environmental Quality 32 642–53
Turner R E and Rabalais N N 2003 Linking landscape and water quality in the Mississippi River basin for 200 years. Bioscience 53 563–72
Turner R E, Rabalais N N and Justic D 2008 Gulf of Mexico hypoxia: Alternate states and a legacy. Environmental Science & Technology 42
2323–7
US Fish & Wildlife Service 2018 National Wetlands Inventory
Van Cleemput O, Boeckx P, Lindgren P-E and Tonderski K 2007 Denitrification in wetlands Biology of the Nitrogen Cycle (Amsterdam:
Elsevier) 359–67
Van Meter K, Van Cappellen P and Basu N 2018 Legacy nitrogen may prevent achievement of water quality goals in the Gulf of Mexico.
Science 360 427–30
Van Meter K J and Basu N 2017 Time lags in watershed-scale nutrient transport: an exploration of dominant controls. Environ. Res. Lett. 12
084017
Wu Q and Lane C R 2016 Delineation and quantification of wetland depressions in the prairie pothole region of North Dakota Wetlands 36
215–27
Zedler J B 2003 Wetlands at your service: reducing impacts of agriculture at the watershed scale. Frontiers in Ecology and the Environment 1
65–72
10You can also read