FireSRnet: Geoscience-Driven Super-Resolution of Future Fire Risk from Climate Change
←
→
Page content transcription
If your browser does not render page correctly, please read the page content below
FireSRnet: Geoscience-Driven Super-Resolution of Future Fire
Risk from Climate Change
Tristan Ballard Gopal Erinjippurath
Sust Global Sust Global
tristan@sustglobal.com gopal@sustglobal.com
Abstract
With fires becoming increasingly frequent and severe across the
globe in recent years, understanding climate change’s role in fire
arXiv:2011.12353v1 [cs.LG] 24 Nov 2020
behavior is critical for quantifying current and future fire risk. How-
ever, global climate models typically simulate fire behavior at spatial
scales too coarse for local risk assessments. Therefore, we propose a
novel approach towards super-resolution (SR) enhancement of fire
risk exposure maps that incorporates not only 2000 to 2020 monthly
satellite observations of active fires but also local information on
land cover and temperature. Inspired by SR architectures, we pro-
pose an efficient deep learning model trained for SR on fire risk
exposure maps. We evaluate this model on resolution enhancement
and find it outperforms standard image interpolation techniques at
both 4x and 8x enhancement while having comparable performance
at 2x enhancement. We then demonstrate the generalizability of this
SR model over northern California and New South Wales, Australia.
We conclude with a discussion and application of our proposed
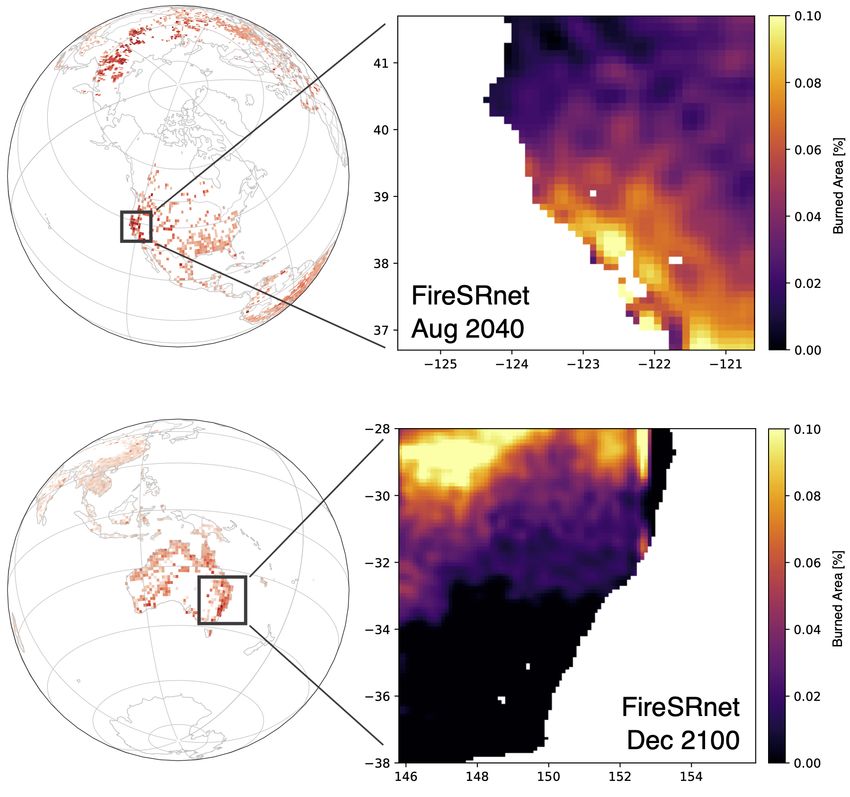
model to climate model simulations of fire risk in 2040 and 2100, Figure 1: Application of 4x (0.4° → 0.1°) SR FireSRnet to cli-
illustrating the potential for SR enhancement of fire risk maps from mate model simulations of fire exposure in two case study
the latest state-of-the-art climate models. regions: northern California, US (top) and New South Wales,
Australia (bottom).
One promising approach for resolution enhancement is image
super-resolution (SR), an area of model development gaining consid-
1 Introduction erable attention in the AI and computer vision research community
Fires have become increasingly frequent and severe in recent years in recent years [11–13]. While leading SR models can generate in-
with catastrophic impacts [1, 2]. For example, the 2019-2020 Aus- credibly photo-realistic images, research efforts typically focus on
tralian megafires burned 24m acres of vegetation habitat [3] and real world visual imagery rather than geospatial datasets. However,
caused $1.4b US in air quality health impacts [1]. In California, 5 of since 2017 two studies have aimed to bring recent advances in SR
the state’s top 6 largest fires have occurred in 2020 alone, including modeling to the challenge of resolution enhancement of precipi-
the first ever gigafire in modern history, defined as an individual fire tation data, including from climate models [14, 15]. Those studies
burning over 1m acres [4]. The 2020 California fires have already indicate an exciting potential for SR in the geosciences, but to date
burned over 4m acres, damaged or destroyed 10,000 structures, and we are unaware of any such explorations beyond those with global
caused 31 fatalities at the time of writing [5]. Accordingly, to what precipitation data.
extent climate change has already impacted these fires, and whether Here we propose FireSRnet, a novel SR architecture operating
it will increase the magnitude and locations of fire risk moving for- on a 3-channel geospatial dataset incorporating NASA satellite
ward, is becoming crucially relevant in a range of sectors around fire data, local temperature, and local land cover burnability. We
the globe [2, 6, 7]. compare FireSRnet performance at 2x, 4x, and 8x SR against a bench-
Climate models provide an effective set of tools for quantify- mark interpolation technique and validate model results with the
ing the impact of climate change on acute physical risks like fire recent fires in California and Australia. Finally, we showcase how
exposure [8]. These models help identify regions with high risk FireSRnet can leverage CMIP6 climate model simulations of burned
and quantify the benefits of carbon emission reductions [9]. How- area and temperature to enable more precise forward-looking esti-
ever, a major limitation of the climate models from the Coupled mates of fire exposure (Fig. 1).
Model Intercomparison Project phase 6 (CMIP6) is that they have
spatial resolutions ranging from 0.5° to 2.5°, complicating local or 2 Dataset creation
asset-level analytics [8, 10]. Enhancing spatial resolution on cli- Low-resolution (LR) geospatial data coded as input images to the
mate model fire exposure maps is therefore critical to making the SR model architecture (Fig. 2) are derived from high-resolution (HR)
exposure maps indicative of asset-level risk for both historical and images having 3 channels corresponding to maps of fire counts,
forward-looking time horizons. temperature deviation from mean conditions, and a burnable land
Tristan Ballard and Gopal Erinjippurath

index. We use monthly HR data at 0.1° (∼11 km) resolution from
March 2000 to August 2020 for both the continental US and Aus-
tralia. Due to data quality concerns, we do not include March to July
2020 and March to May 2020 for the US and Australia, respectively.
This results in a combined dataset of 240 images for the US and 243
images for Australia, each of size 256x584 pixels at HR.
2.1     NASA satellite fire counts
We use a monthly fire data product provided by the National Aero-
nautics and Space Administration (NASA) based on imagery from
                                                                         Figure 2: FireSRnet model architecture for 4x SR, inputting
NASA’s Terra and Aqua satellites [16]. NASA’s global fire data
                                                                         3 LR maps and outputting 1 SR map corresponding to fire
product indicates the number of fires within a given 0.1° pixel each
                                                                         exposure.
month and is available from March 2000 to present day.
                                                                         most consistent with current carbon emissions. The CMIP6 model
2.2     Temperature deviation                                            employed here has a spatial resolution of 1.4°, which is regridded
Because we expect temperature to be a key indicator of fire risk         to the required LR input resolution.
[17], we derived a monthly temperature deviation input channel
using temperature data for the US and Australia. For the US, we          3   FireSRnet architecture
use 4km resolution monthly temperature data provided by the
PRISM group [18]. For Australia, we use 5km resolution monthly           Multiple approaches have been developed in the last few years for
temperature data provided by the Australian Bureau of Meteorology        SR on color imagery [11–13]. While the majority of such efforts
[19]. We expect temperature deviations, calculated by differencing       focus on imagery of natural and man made objects, two recent
each monthly grid cell relative to its 2000-2019 mean temperature,       efforts have applied SR algorithms to geospatial data, in particular
to be more informative than raw temperature since fires exhibit          to precipitation estimates at 2x, 4x, 5x and 8x SR enhancement
significant seasonality [2, 17]. We then downsampled resulting           [14, 15].
temperature deviation maps to 0.1° using bilinear interpolation.             One important consideration for the design of our SR architec-
                                                                         ture is data availability. We use monthly data from 2000 to 2016 for
2.3     Burnable land index                                              training and model selection and 2017 to 2020 for out-of-sample
We developed a burnable land index input channel based on satellite-     quantitative and qualitative assessment of model performance. Due
derived land cover data with values ranging from 0 (low burnability)     to the relatively small training dataset, we prioritized simple and
to 1 (high burnability). The 300m resolution land cover dataset cre-     efficient, albeit still high performing, deep learning architectures.
ated by the European Space Agency’s Land Cover Climate Change                Inspired by the approach described in [26], we arrived at a fire
Initiative assigns each pixel to one of 38 land cover classes based on   super-resolution network (FireSRnet) deep learning architecture
2015 satellite imagery [20]. To make these land cover classes more       summarized in Figure 2 for 4x SR. The architecture interleaves 2D
scientifically relevant to the task of fire prediction, we binned each   upsampling layers and 2D convolutional layers with variable size
of the classes as either burnable (e.g. forest land cover types) or      filters. We use progressively smaller 2D filters of size 9x9, 5x5 and
non-burnable (e.g. wetland). This binning was identical for the US       3x3 sizes in the first, second and third 2D convolutional layers,
and Australia with the exception of grassland and shrubland classes,     respectively with interleaved 2D 2x upsampling layers. The last
which we classified as non-burnable and burnable for the US and          stage uses a 1x1 convolution to combine learnings from multiple
Australia, respectively, due to Australia having large bushfires that    features maps to a single image at the target resolution. For the 2D
are generally absent in the US for equivalent classes. We then down-     convolutional layers, we use ReLU activation with the same padding,
sampled the resulting binary map from 300m to 0.1° using bilinear        and for the upsampling layers we use bilinear interpolation. Owing
interpolation, resulting in burnable land index values ranging from      to the small number of layers in this network, we have a total of
0 to 1. We assume that the burnable land index is time-invariant         7.7K trainable parameters that can be readily trained from scratch.
across years evaluated in this study, in part because land use change        FireSRnet can be flexibly extended across different SR enhance-
at the spatial scales considered here has been relatively minimal        ment scales, and we have so far experimented with 2x, 4x and 8x SR
during the study period [21, 22].                                        (Figs. A1, A2). When going between SR scales, we use the same num-
                                                                         ber of convolutional layers and trainable parameters. Lastly, since
2.4     CMIP6 climate model simulations                                  the goal of SR on risk exposure maps is to preserve the accuracy
Climate models from leading international research centers are           and fidelity of fire exposure, we use mean squared error throughout
standardized through CMIP6 [8, 23]. Here we use the CMIP6 Cen-           as our loss function rather than a perceptual loss function.
tre National de Recherches Météorologiques Earth System Model                Encouragingly, the layer 1 weights post-training result in a com-
version 2.1 [24] simulations of monthly temperature and burned           bination of spot detectors, offset spot detectors, spot eliminators,
area. To calculate the temperature deviation index, we use both his-     and sharpening filters, indicative of essential functions at the early
torical temperature simulations spanning 2000 to 2015 and future         stages of the network to transform the LR inputs and enable down-
simulations spanning 2016 to 2100 from the “Fossil-fueled Develop-       stream feature maps that are indicative of discriminating features
ment” SSP5-RCP8.5 carbon emissions scenario [25], the scenario           for fire detection (Fig. A3).

Tackling Climate Change with Machine Learning workshop at NeurIPS 2020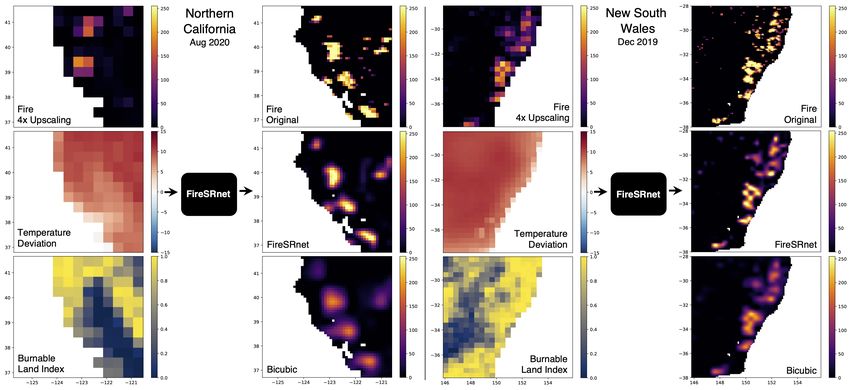
FireSRnet: Geoscience-Driven Super-Resolution of Future Fire Risk from Climate Change

Figure 3: Evaluation of 4x (0.4° → 0.1°) SR with out-of-sample fires in northern California (left) and New South Wales (right).
FireSRnet outperforms bicubic interpolation in both fire magnitudes and spatial distribution. Input maps are NASA satellite
fire counts [scaled 0-254], temperature deviation [°C], and burnable land index [ranging from low (0) to high (1) burnability].

4    Quantitative model evaluation                                                                      RMSE      R2        Precision    F1        Threat Score
For quantitative assessment of the performance of SR, we bench-                         FireSRnet-2x    0.0348    0.3810    0.9181       0.9567    0.9174
mark FireSRnet against bicubic interpolation by comparing the                           Bicubic-2x      0.0351    0.3687    0.9284       0.9625    0.9281
target HR image from which the LR input image was derived with                          FireSRnet-4x    0.0400    0.2434    0.9257       0.9479    0.9015
the output SR or HR image calculated by FireSRnet or bicubic in-                        Bicubic-4x      0.0433    0.181     0.8747       0.9320    0.8735
terpolation, respectively.                                                              FireSRnet-8x    0.0433    0.1218    0.8876       0.8998    0.8191
   We consider two aspects of model performance both relevant                           Bicubic-8x      0.0473    0.104     0.8181       0.8971    0.8147
to fire exposure modeling. First, since fire exposure is a continu-                     Table 1: Performance of FireSRnet for 2x, 4x and 8x SR as
ous value, we use R2 and RMSE to indicate how we track model                            compared to corresponding bicubic interpolation.
prediction of the exposure magnitude as compared to the original
HR exposure map. Second, we quantify the model’s skill as a fire
detector by converting both the HR target image and the predicted                       additional experiments for region specific models: 1) Retrained
output images into binary fire maps. With these binary maps, we                         on US data and validated out-of-sample on US data, and 2) Re-
considering classification error metrics of precision, F1 score, and                    trained on Australia data and validated out-of-sample Australia
threat score [15]. We identify precision in particular as a key indi-                   data. Preliminary performance results (Table A1) between these
cator of SR performance as it inversely correlates to false-positive                    two experiments and the full model provides evidence that the
detections. False-positive detections are the most common source                        model could be generalized to regions beyond the US and Australia.
of error when upsampling sparse LR exposure maps because upsam-
pling diffuses exposure magnitude erroneously to neighborhood                           5   Qualitative model evaluation
pixels.                                                                                 We conduct case studies in northern California and New South
   We find that FireSRnet outperforms bicubic interpolation for 4x                      Wales, visually comparing observed HR fire count maps with cor-
and 8x enhancement on all metrics (Table 1). For 2x enhancement,                        responding maps derived from FireSRnet and bicubic interpolation
FireSRnet outperforms bicubic interpolation for the metrics related                     (Fig. 3). Because the case studies correspond to fire events in 2019
to exposure magnitude, whereas bicubic interpolation outperforms                        and 2020, neither were included in the training of FireSRnet. We fo-
FireSRnet on all three classification metrics (Table 1). This indicates                 cus here on the 4x SR maps, though the 2x and 8x SR maps indicate
that for 2x fire exposure enhancement, the benefits of FireSRnet                        similar qualitative performance (not shown).
over an interpolation alternative are less pronounced.                                     We find that FireSRnet outperforms bicubic interpolation in
   Next, we are interested in quantifying how generalizable FireS-                      capturing both the magnitude and spatial distribution of the August
Rnet is to different global regions and thus different ecosystems,                      2020 California fires and the December 2019 New South Wales fires
climate conditions, and fire dynamics. To that end, we ran two                          (Fig. 3). FireSRnet accurately captures the magnitudes of fire counts,

Tackling Climate Change with Machine Learning workshop at NeurIPS 2020
Tristan Ballard and Gopal Erinjippurath

Figure 4: Application of 4x (0.4° → 0.1°) SR to CMIP6 simulations of fire exposure in northern California (left) and New South
Wales (right) for August 2040 and December 2100, respectively. Input image channels are CMIP6 burned area [%], CMIP6
temperature deviation [°C], and a burnable land index [ranging from low (0) to high (1) burnability] and output is an single
channel CMIP6 burned area SR image.

whereas bicubic interpolation underestimates the magnitudes. This            Quantitative assessment and verification of the output SR maps is,
suggests that bicubic interpolation underestimates fire exposure,         of course, not possible for 2040 and 2100; nevertheless, the SR maps
particularly in locations with the greatest fire activity. FireSRnet      appear qualitatively reasonable. Interestingly, the northern Cali-
also appears to better capture the boundaries of large fires in both      fornia SR image suggests heightened risk in the Napa and Sonoma
regions (Fig. 3), whereas bicubic interpolation results in overly         areas (38.2°, -122.5°) in 2040 (Fig. 4), an area experiencing fires as of
smoothed fire boundaries. The better delineation of fire boundaries       October 2020. Meanwhile, the New South Wales SR image suggests
by FireSRnet is indicative of the deep learning model learning edge       mostly low fire exposure in 2100, particularly towards the south.
behavior between fire and no fire pixels (Fig. A3).                          While the observed HR fire count data employed to train FireSR-
   Both FireSRnet and bicubic interpolation fail to capture fires with    net is not strictly equivalent to the CMIP6 burned area data product,
small spatial footprints (single 0.1° pixel size) since the signal from   we argue that the pre-trained FireSRnet is suitable in this applica-
these small fires tends to be lost when creating the downsampled          tion. First, NASA designed the fire count data for a range of research
inputs (Fig. 3).                                                          applications, including validating global fire models [16]. Second,
                                                                          qualitative assessment of the case study fire maps indicates that the
6    Super-resolution of future fire exposure                             NASA fire counts correspond well to burned area footprints (Fig 3),
     maps                                                                 and qualitative assessment of the SR results (Fig. 4) further supports
                                                                          the generalization of FireSRnet to future CMIP6 fire simulation.
One of the most promising applications of the FireSRnet modeling
framework (Fig. 2) is to enhance the resolution of fire exposure          7    Future directions
maps simulated by global climate models. Compared with enhanc-            We see multiple avenues for building on the FireSRnet modeling
ing CMIP6 maps through bicubic interpolation, FireSRnet incorpo-          approach in the future. First, we intend to incorporate additional
rates additional geoscience information on land cover and future          global regions including Siberia and the Amazon rainforest in our
temperature when conducting the upsampling, suggesting it can             model training and assessments. Second, because FireSRnet can flex-
more accurately upsample CMIP6 fire exposure maps.                        ibly integrate additional input channels, we could include drought
   Here we display the potential of these SR fire exposure maps by        maps in the framework. Third, the rare event nature of the data
applying the 4x SR FireSRnet, trained and validated on observed fire      suggests the potential of a zero-inflated, two-stage SR model [27].
data, to CMIP6 simulations of future burned area and temperature          Last, while we focus here on single image SR, we see opportuni-
in August 2040 and December 2100 for northern California and              ties for improved performance using multi-temporal SR, which has
New South Wales, respectively (Fig. 4). For the burnable land index,      been applied to satellite imagery in the past [28] but never, to our
we use the same 2015-derived input map for all years rather than          knowledge, to fire exposure maps.
modeling changes in land cover decades into the future.

Tackling Climate Change with Machine Learning workshop at NeurIPS 2020
FireSRnet: Geoscience-Driven Super-Resolution of Future Fire Risk from Climate Change
References [23] Brian C O’Neill, Claudia Tebaldi, Detlef P Van Vuuren, Veronika Eyring, Pierre
Friedlingstein, George Hurtt, Reto Knutti, Elmar Kriegler, Jean-Francois Lamar-
que, Jason Lowe, et al. The scenario model intercomparison project (scenariomip)
[1] Fay H Johnston, Nicolas Borchers-Arriagada, Geoffrey G Morgan, Bin Jalaludin, for cmip6. 2016.
Andrew J Palmer, Grant J Williamson, and David MJS Bowman. Unprecedented [24] Roland Séférian, Pierre Nabat, Martine Michou, David Saint-Martin, Aurore
health costs of smoke-related pm 2.5 from the 2019–20 australian megafires. Voldoire, Jeanne Colin, Bertrand Decharme, Christine Delire, Sarah Berthet,
Nature Sustainability, pages 1–6, 2020. Matthieu Chevallier, et al. Evaluation of cnrm earth system model, cnrm-esm2-1:
[2] Michael Goss, Daniel L Swain, John T Abatzoglou, Ali Sarhadi, Crystal A Kolden, Role of earth system processes in present-day and future climate. Journal of
A Park Williams, and Noah S Diffenbaugh. Climate change is increasing the Advances in Modeling Earth Systems, 11(12):4182–4227, 2019.
likelihood of extreme autumn wildfire conditions across california. Environmental [25] Keywan Riahi, Detlef P Van Vuuren, Elmar Kriegler, Jae Edmonds, Brian C
Research Letters, 15(9):094016, 2020. O’neill, Shinichiro Fujimori, Nico Bauer, Katherine Calvin, Rob Dellink, Oliver
[3] Michelle Ward, Ayesha IT Tulloch, James Q Radford, Brooke A Williams, April E Fricko, et al. The shared socioeconomic pathways and their energy, land use,
Reside, Stewart L Macdonald, Helen J Mayfield, Martine Maron, Hugh P Possing- and greenhouse gas emissions implications: an overview. Global Environmental
ham, Samantha J Vine, et al. Impact of 2019–2020 mega-fires on australian fauna Change, 42:153–168, 2017.
habitat. Nature Ecology & Evolution, 4(10):1321–1326, 2020. [26] Chao Dong, Chen Change Loy, Kaiming He, and Xiaoou Tang. Learning a deep
[4] CalFire: Top 20 Largest California Wildfires. Accessed 2020-10-06. https://www. convolutional network for image super-resolution. In European conference on
fire.ca.gov/media/11416/top20_acres.pdf. computer vision, pages 184–199. Springer, 2014.
[5] CalFire: 2020 Incident Archive. Accessed 2020-10-06. https://www.fire.ca.gov/ [27] Jeremy Diaz and Maxwell B Joseph. Predicting property damage from tornadoes
incidents/2020/. with zero-inflated neural networks. Weather and Climate Extremes, 25:100216,
[6] Benjamin M Sanderson and Rosie A Fisher. A fiery wake-up call for climate 2019.
science. Nature Climate Change, 10(3):175–177, 2020. [28] Michel Deudon, Alfredo Kalaitzis, Israel Goytom, Md Rifat Arefin, Zhichao Lin,
[7] Renaud Barbero, John T Abatzoglou, Narasimhan K Larkin, Crystal A Kolden, and Kris Sankaran, Vincent Michalski, Samira E Kahou, Julien Cornebise, and Yoshua
Brian Stocks. Climate change presents increased potential for very large fires in Bengio. Highres-net: Recursive fusion for multi-frame super-resolution of satel-
the contiguous united states. International Journal of Wildland Fire, 24(7):892–899, lite imagery. arXiv preprint arXiv:2002.06460, 2020.
2015.
[8] Veronika Eyring, Sandrine Bony, Gerald A Meehl, Catherine A Senior, Bjorn
Stevens, Ronald J Stouffer, and Karl E Taylor. Overview of the coupled model
intercomparison project phase 6 (cmip6) experimental design and organization.
Geoscientific Model Development, 9(5):1937–1958, 2016.
[9] Gitta Lasslop, Stijn Hantson, Victor Brovkin, Fang Li, David Lawrence, Sam Rabin,
and Elena Shevliakova. Future fires in the coupled model intercomparison project
(cmip) phase 6. In EGU General Assembly Conference Abstracts, page 22513, 2020.
[10] Stijn Hantson, Almut Arneth, Sandy P Harrison, Doug I Kelley, I Colin Prentice,
Sam S Rabin, Sally Archibald, Florent Mouillot, Steve R Arnold, Paulo Artaxo, et al.
The status and challenge of global fire modelling. Biogeosciences, 13(11):3359–
3375, 2016.
[11] Xintao Wang, Ke Yu, Shixiang Wu, Jinjin Gu, Yihao Liu, Chao Dong, Yu Qiao, and
Chen Change Loy. Esrgan: Enhanced super-resolution generative adversarial
networks. In Proceedings of the European Conference on Computer Vision (ECCV),
pages 0–0, 2018.
[12] Yulun Zhang, Yapeng Tian, Yu Kong, Bineng Zhong, and Yun Fu. Residual dense
network for image super-resolution. In Proceedings of the IEEE conference on
computer vision and pattern recognition, pages 2472–2481, 2018.
[13] Christian Ledig, Lucas Theis, Ferenc Huszár, Jose Caballero, Andrew Cunning-
ham, Alejandro Acosta, Andrew Aitken, Alykhan Tejani, Johannes Totz, Zehan
Wang, et al. Photo-realistic single image super-resolution using a generative
adversarial network. In Proceedings of the IEEE conference on computer vision and
pattern recognition, pages 4681–4690, 2017.
[14] Dong Wang, Wei Cao, Jian Li, and Jieping Ye. Deepsd: Supply-demand prediction
for online car-hailing services using deep neural networks. In 2017 IEEE 33rd
international conference on data engineering (ICDE), pages 243–254. IEEE, 2017.
[15] Jianxin Cheng, Qiuming Kuang, Chenkai Shen, Jin Liu, Xicheng Tan, and Wang
Liu. Reslap: Generating high-resolution climate prediction through image super-
resolution. IEEE Access, 8:39623–39634, 2020.
[16] NASA Earth Observations Team, NASA Goddard Space Flight Center: MODIS
Active fires. https://neo.sci.gsfc.nasa.gov/view.php?datasetId=MOD14A1_M_
FIRE&year=2020.
[17] Rachael H Nolan, Matthias M Boer, Luke Collins, Víctor Resco de Dios, Hamish
Clarke, Meaghan Jenkins, Belinda Kenny, and Ross A Bradstock. Causes and
consequences of eastern australia’s 2019–20 season of mega-fires. Global change
biology, 26(3):1039–1041, 2020.
[18] PRISM Climate Group, Oregon State University. Accessed 2020-10-06. http:
//prism.oregonstate.edu.
[19] David A Jones, William Wang, and Robert Fawcett. High-quality spatial climate
data-sets for australia. Australian Meteorological and Oceanographic Journal,
58(4):233, 2009.
[20] Wei Li, Natasha MacBean, Philippe Ciais, Pierre Defourny, Céline Lamarche,
Sophie Bontemps, Richard A Houghton, and Shushi Peng. Gross and net land
cover changes in the main plant functional types derived from the annual esa cci
land cover maps (1992–2015). 2018.
[21] JA Fry, MJ Coan, Collin G Homer, Debra K Meyer, and JD Wickham. Completion
of the national land cover database (nlcd) 1992–2001 land cover change retrofit
product. US Geological Survey open-file report, 1379:18, 2008.
[22] Collin Homer, Jon Dewitz, Limin Yang, Suming Jin, Patrick Danielson, George
Xian, John Coulston, Nathaniel Herold, James Wickham, and Kevin Megown.
Completion of the 2011 national land cover database for the conterminous united
states–representing a decade of land cover change information. Photogrammetric
Engineering & Remote Sensing, 81(5):345–354, 2015.
Tackling Climate Change with Machine Learning workshop at NeurIPS 2020Tristan Ballard and Gopal Erinjippurath 8 Appendix Tackling Climate Change with Machine Learning workshop at NeurIPS 2020
FireSRnet: Geoscience-Driven Super-Resolution of Future Fire Risk from Climate Change

Figure A1: FireSRnet model architecture for 2x SR, inputting 3 LR maps and outputting 1 SR map corresponding to fire expo-
sure.

Figure A2: FireSRnet model architecture for 8x SR, inputting 3 LR maps and outputting 1 SR map corresponding to fire expo-
sure.

Tackling Climate Change with Machine Learning workshop at NeurIPS 2020
Tristan Ballard and Gopal Erinjippurath

                                      Figure A3: FireSRnet Layer 1 weights from the 16 2D conv1 filters.

Tackling Climate Change with Machine Learning workshop at NeurIPS 2020
FireSRnet: Geoscience-Driven Super-Resolution of Future Fire Risk from Climate Change
Model/Metric RMSE R2 Precision F1 Threat Score
FireSRnet (US) 0.0390 0.2215 0.9157 0.9397 0.8870
FireSRnet (AUS) 0.0423 0.1938 0.9307 0.9445 0.8951
FireSRnet (US_AUS) 0.0398 0.2434 0.9257 0.9479 0.9015
Table A1: Performance of FireSRnet for 4x SR on out of sample inference when trained on fire risk exposure maps from specific
regions: US only, AUS only, US and AUS combined. The US_AUS metrics are identical to those in the third row of Table 1.
Tackling Climate Change with Machine Learning workshop at NeurIPS 2020You can also read