DEPARTMENT OF INFORMATICS - Analysis of Level Design Graphs Marcel Zurawka - Wiki TUM
←
→
Page content transcription
If your browser does not render page correctly, please read the page content below
DEPARTMENT OF INFORMATICS
        TECHNISCHE UNIVERSITÄT MÜNCHEN

Bachelor’s Thesis in Informatics: Games Engineering

 Analysis of Level Design Graphs

               Marcel Zurawka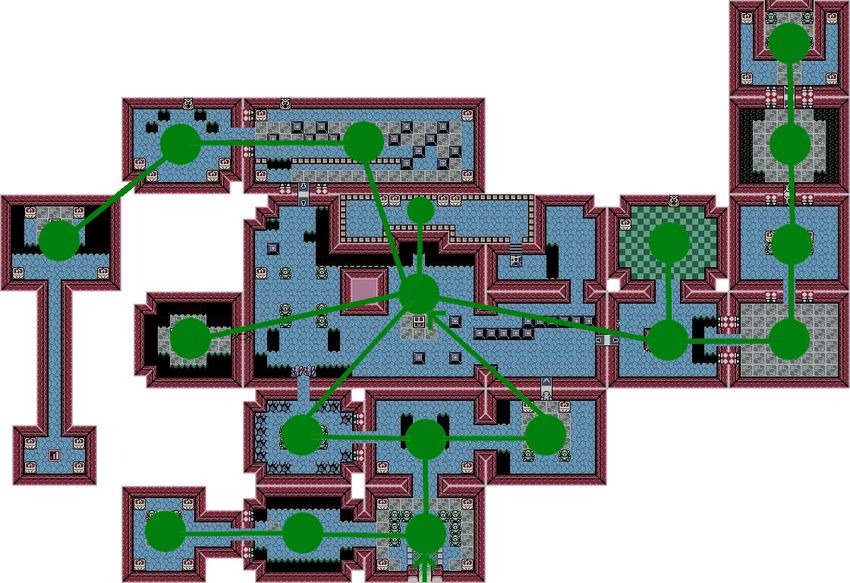
DEPARTMENT OF INFORMATICS
        TECHNISCHE UNIVERSITÄT MÜNCHEN

Bachelor’s Thesis in Informatics: Games Engineering

 Analysis of Level Design Graphs

Analyse von Level Design Graphen

       Author:            Marcel Zurawka
       Supervisor:        Prof. Gudrun Klinker, Ph.D.
       Advisor:           Daniel Dyrda, M.Sc.
       Submission Date:   15.04.2020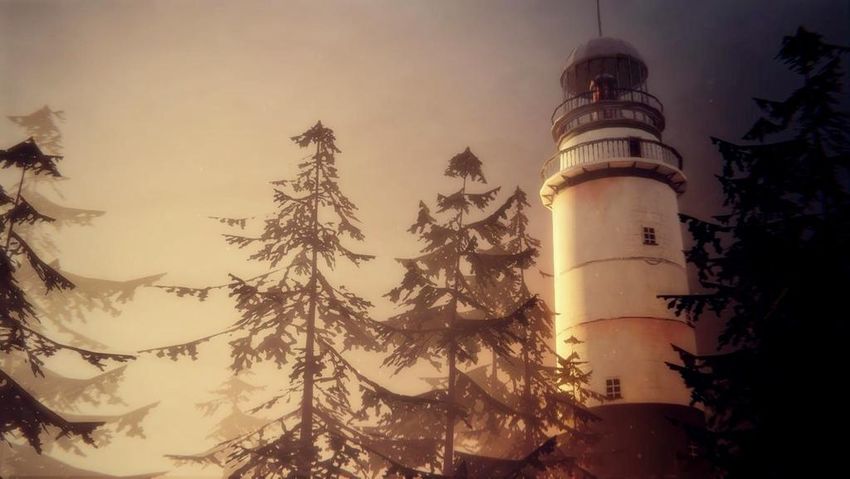
I confirm that this bachelor’s thesis in informatics: games engineering is my own work
and I have documented all sources and material used.

Munich, 15.04.2020                               Marcel Zurawka
Acknowledgments

  Thanks to the Forschungsgruppe Augmented Reality at the Technical University of
Munich for giving me the opportunity to write this thesis. Thanks to all the people
working there especially Prof. Gudrun Klinker, Ph.D. and Daniel Dydra, M.Sc. for
supervising me throughout this journey.

A special thanks to Lars for reading this thesis and motivating me throughout the
writing. Without you, I wouldn’t have done it.
Abstract
The thesis states that many game companies have a problem with game design require-
ments. The main problem of these requirements are that they are not tested enough
and not well communicated. We think that most people communicate these verbally or
by writing them down and giving small sketches to explain them better. This thesis
will also introduce an abstract model which can help to overcome these problems. The
model will abstract games by using graphs and applying rules to them. It also consists
of an automated testing system which will apply these rule sets on the graphs or on a
connection between multiple graphs. This model is applicable for most genres and will
introduce a less error prone workflow for game designers and their team.

                                          iv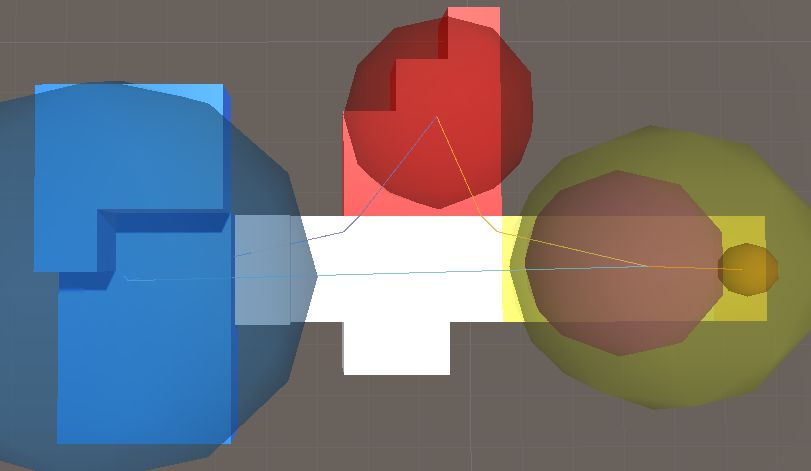
Contents
Acknowledgments                                                                                                                                     iii

Abstract                                                                                                                                            iv

1   Introduction                                                                                                                                     1

2   Game Development                                                                                                                                 2
    2.1 Art Department . . . . . .      .   .   .   .   .   .   .   .   .   .   .   .   .   .   .   .   .   .   .   .   .   .   .   .   .   .   .    2
    2.2 Programming Department          .   .   .   .   .   .   .   .   .   .   .   .   .   .   .   .   .   .   .   .   .   .   .   .   .   .   .    3
    2.3 Game Design Department          .   .   .   .   .   .   .   .   .   .   .   .   .   .   .   .   .   .   .   .   .   .   .   .   .   .   .    3
    2.4 Quality Assurance . . . .       .   .   .   .   .   .   .   .   .   .   .   .   .   .   .   .   .   .   .   .   .   .   .   .   .   .   .    4

3   Graphs                                                                                                                                           5
    3.1 Visualization of Graphs . . . . . . . . . . . . . . . . . . . . . . . . . . . .                                                              5
    3.2 Definitions . . . . . . . . . . . . . . . . . . . . . . . . . . . . . . . . . . . .                                                          5
        3.2.1 Degree . . . . . . . . . . . . . . . . . . . . . . . . . . . . . . . . . .                                                             6

4   Related Work                                                                                                                                     8
    4.1 Puzzle Dependency Charts . . . .                    .   .   .   .   .   .   .   .   .   .   .   .   .   .   .   .   .   .   .   .   .   .    8
    4.2 Character Controllers . . . . . . . .               .   .   .   .   .   .   .   .   .   .   .   .   .   .   .   .   .   .   .   .   .   .    9
    4.3 Game Elements . . . . . . . . . . .                 .   .   .   .   .   .   .   .   .   .   .   .   .   .   .   .   .   .   .   .   .   .   10
    4.4 Navigation Meshes . . . . . . . . .                 .   .   .   .   .   .   .   .   .   .   .   .   .   .   .   .   .   .   .   .   .   .   10
    4.5 Economy Simulation . . . . . . . .                  .   .   .   .   .   .   .   .   .   .   .   .   .   .   .   .   .   .   .   .   .   .   11
    4.6 Hyper State Space Graph Analysis                    .   .   .   .   .   .   .   .   .   .   .   .   .   .   .   .   .   .   .   .   .   .   11

5   Problem Statement                                                                                                                               13

6   Game Requirements Model                                                                                                                         14
    6.1 Layers . . . . . . . . . . . . . . . . . .              .   .   .   .   .   .   .   .   .   .   .   .   .   .   .   .   .   .   .   .   .   14
        6.1.1 Spatial . . . . . . . . . . . . .                 .   .   .   .   .   .   .   .   .   .   .   .   .   .   .   .   .   .   .   .   .   15
        6.1.2 Logic . . . . . . . . . . . . . .                 .   .   .   .   .   .   .   .   .   .   .   .   .   .   .   .   .   .   .   .   .   18
        6.1.3 Story . . . . . . . . . . . . . .                 .   .   .   .   .   .   .   .   .   .   .   .   .   .   .   .   .   .   .   .   .   20
    6.2 Connection between multiple layers                      .   .   .   .   .   .   .   .   .   .   .   .   .   .   .   .   .   .   .   .   .   21
        6.2.1 Spatial & Logic . . . . . . . .                   .   .   .   .   .   .   .   .   .   .   .   .   .   .   .   .   .   .   .   .   .   21

                                                        v
Contents
6.2.2 Story & Spatial . . . . . . . . . . . . . . . . . . . . . . . . . . . . . 23
6.2.3 Story & Logic . . . . . . . . . . . . . . . . . . . . . . . . . . . . . . 24
6.3 Constraints . . . . . . . . . . . . . . . . . . . . . . . . . . . . . . . . . . . . 24
6.4 Automated Testing . . . . . . . . . . . . . . . . . . . . . . . . . . . . . . . 25
6.5 Interaction . . . . . . . . . . . . . . . . . . . . . . . . . . . . . . . . . . . . 26
6.5.1 Game Design . . . . . . . . . . . . . . . . . . . . . . . . . . . . . . 26
6.5.2 Programming . . . . . . . . . . . . . . . . . . . . . . . . . . . . . . 26
6.5.3 Art . . . . . . . . . . . . . . . . . . . . . . . . . . . . . . . . . . . . 27
6.5.4 Quality Assurance . . . . . . . . . . . . . . . . . . . . . . . . . . . 27
6.6 Use case . . . . . . . . . . . . . . . . . . . . . . . . . . . . . . . . . . . . . 27
7 Outlook 29
List of Figures 30
Bibliography 31
vi1 Introduction
Developing games is a huge task nowadays. The games get bigger and the teams
working on them too. A lot of problems can come up with the increasing size of the
team. We think that one of these problems is the communication process between
game designers and the rest of their team. Game designers create game features and
communicate them to the corresponding departments in their team. We estimate that
they do this mostly with verbal communication or by writing it down in text or making
sketches for it. In the process of the communication and after it, a lot of mistakes
can happen. These mistakes can affect the overall quality of the finished game. By
creating a tool for game designers and their team we want to ensure the quality and the
functionality of features designed by them. This tool consist of a model which contains
game data like spatial and logical data, but also applies design rules on this data.
This applying of rules will happen throughout the whole development and will give
the people working with it almost instant feedback on their actions based on the game
designers requirements.
12 Game Development
Many different departments contribute to game development. Every department has a
specific role in the creation process. Assembling every piece created by them will then
create the final result, the game.
2.1 Art Department
The art department includes different roles, these are normally Technical Artist, Environ-
ment Artist, Modelling and Texturing. Every role in it has it’s specific tools, requirements
and workflows to get to the final product.
Technical Artist The Technical Artist in a company is the interface between art, pro-
gramming and game design. They typically bring the art work in the game and bring
it to live by combining the tech from the programming department and taking in mind
the requirements by game design what to build.
Environment Artist They create the environment in a game by placing the assets,
made by modellers, in the game engine at the right place. They do this until the visual
statement of the game is shown in game.
Modelling Modellers don’t work in the game engine, but instead use their own tools
like Blender, Maya or 3DS MAX. These tools allow them to create objects which then
get placed by technical artists or environment artist in the game. These objects can be
everything that can be imagined, from chairs to houses or horses and characters.
Texturing People doing texturing give objects their visual representation. While
modellers define the form of an object, textures define the visual look of it. They can
make chairs look like they consist of wood or plastic. They create the surface for these
objects.
22 Game Development
2.2 Programming Department
This department handles the logic of game. It’s often split into Tools, Front-end and
Back-end.
Tools Tools programmer help all other departments with building tools to make their
workflows better and faster. They can create tools for art for example. If they are
restricted to placing one object at a time, tools programmer can develop a tool to place
ten objects at the same time under special conditions like distance between them.
Front-end Often games are split into front- and back-end. In multiplayer games
front-end developers will handle the client users interact with. They will move your
characters if you should be able to move them. They will also make him hit enemies,
give enemies health points and let them die if they should.
Back-end In multiplayer games back-end developers ensure that the client can talk to
the server and ensure that the server works as intended. This includes a friend system
or realtime multiplayer. In non multiplayer games back-end often doesn’t exists and
there are only front-end developers.
2.3 Game Design Department
The game design department defines how the game should be played by the user and
what the user should be able to do. It defines in which world everything takes place,
how the game should feel and how it should look. It sometimes also writes the story.
They often only differentiate roles in Level Designer and Game Designer.
Level Design Level designers ensure that levels reach different requirements like
difficulty, play time and also define what obstacles are in the level and where.
Game Design Game design has a multitude of roles. They create a visual concept for
the game and gives it to the art department to ensure that they create art based on this
vision. They define rules in which the game takes place. They define features like a
social system or leveling systems.
32 Game Development
2.4 Quality Assurance
While some are on-site most often the Quality Assurance department is outsourced.
The job of a quality assurance tester is to test requirements of the game and checks
whether the functionality of a feature is given. They work closely together with game
design to get the requirements for specific features, which need to be tested and with
programming and art to spot mistakes and check if the flaws spotted were intended
behaviour or bugs. They report these bugs back to the their respective departments.
Having these testers is often crucial to sustain a certain quality in the game during the
long development process.
43 Graphs
Figure 3.1: A simple graph
3.1 Visualization of Graphs
Graphs are normally visualized by representing every node as a circle or square and
an directed edge is an arrow while bidirectional edges will be represented as a line
without arrows.
3.2 Definitions
A graph consists of nodes and edges. A node is a data container which can hold
different information. Every node in the graph can be connected with an edge to
another node. An edge can be bidirectional, which means you can travel between
these nodes in both directions. Unidirectional edges restrict you to only travel in one
direction.
Figure 3.1 shows an example with four nodes (blue, orange, red and purple). The blue
node has two edges, one directed to purple and one bidirectional towards red.
53 Graphs
3.2.1 Degree
The degree of a node is equal to the number of outgoing and incoming edges.
In figure 3.1 the blue node has a degree of three, it has one outgoing edge towards
purple and because it also has a bidirectional edge to red it counts as two, one from
blue to red and one from red to blue.
In-Degree
The number of edges going in a node is called in-degree, because as stated above, edges
can be directed.
Examples from figure 3.1 are blue with an in-degree of one, red towards blue. Another
one would be purple which has an in-degree of two.
Out-Degree
The number of edges going out of a node is called out-degree.
The out degree of blue in figure 3.1 is two, one from blue to red and one from blue to
purple.
Subgraphs
Figure 3.2: A graph with a subgraph green
Sub graphs exist in every graph. They define themselves by having a subset of
vertices and edges of the other graph.
In figure 3.2 the green circle shows a subgraph of the whole graph. It contains the
nodes purple and orange and the edge form orange to purple and nothing else.
63 Graphs
Connected graphs
In a connected graph every node can be reached from any other node. This is possible
through a number of edges. In figure 3.1 the graph shown there is connected. You can
reach every other node from any of the four nodes.
Centrality
Centrality answers the question which node is the most important one in a graph in
type of flow. Flow in this case means when going from one node to another it uses
multiple other nodes and edges to reach the other node. Every node in this chain is
relevant for reaching the other node. This type of centrality is also called "betweenness
centrality" and describes the number of shortest paths, of all pair of nodes, going
through a node.
Connectivity
Connectivity describes the minimum required nodes and edges to remove that a graph
is no longer connected. Removing in figure 3.1 the edge from blue to red, will break
the rule that every node can be reached from any other node. Blue is no longer in reach
for any other node.
74 Related Work
Often to visualize and analyze different parts of a game, graphs are used in game
design. But they are not restricted to game design only.
4.1 Puzzle Dependency Charts
Figure 4.1: A puzzle dependency chart of "The Day of the Tentacle" [Wei]
These types of charts were introduced by the game designer Ron Gilbert [Wei16].
They show you how branched your puzzles are, or if there are dead ends for example.
84 Related Work
Branching means, how many possibilities the player has at a given time. Too few might
be boring to the player in an adventure game, while too many might confuse him. If
you now track the player while playing your game, these graphs can allow you to see
at any time how many things the player can do and how far he progressed through
your puzzles.
4.2 Character Controllers
Another type of usage of graphs in games is to use them as a character controller. This
means that the player uses this to traverses through the game. Examples are Deponia,
Old Man’s Journey or Monument Valley. Deponia is a point n click adventure in which the
player traverses through clicking on the screen. The game then uses a navigation mesh
let the character walk to that position. Monument Valley uses a similar approach. These
types of character controllers are generally very efficient, because they don’t include
physics calculations.
Figure 4.2: Monument Valley Gameplay Graph [Won15]
94 Related Work
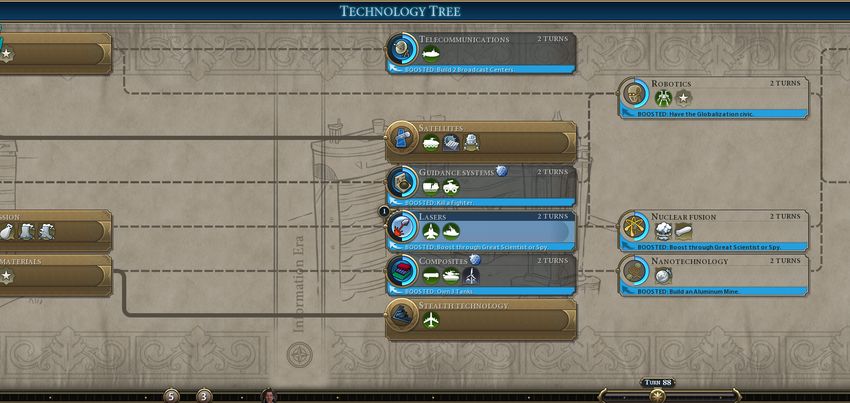
4.3 Game Elements
Some games utilize graphs as game elements. Strategy games like Age of Empires or
Civilization have technology trees. These trees are a progression system for the player
in the game. They can advance their technology in different sections like economics
and military in Age of Empires or science and civics in Civilization. These trees are often
visualized as a graph.
Figure 4.3: Civilization 6 Technology tree
4.4 Navigation Meshes
Navigation Meshes are a graph construct which displays the spacial connectivity of
an area. This is used in games to display a route to a specific point using pathfinding
algorithms. Also most of the AI units in games use a navigation mesh to traverse in the
game world. These meshes are often generated by using the different colliders in the
game. The navigation meshes are mostly static and not normally used in fully dynamic
environments. The mesh seen in 4.4 has two separated graphs. An agent on this mesh
couldn’t reach the outer right part, because these two graphs aren’t connected.
104 Related Work
Figure 4.4: A navigation mesh generated in Unity
4.5 Economy Simulation
The economy simulation tool Machinations uses a graph based approach to simulate an
economy in a game. The users can use this tool to create a simulation for their game
and then simulate it in the tool it self. This allows them to see if the game gets for
example unbalanced or not playable if the player has no resources at some point. Every
node is a pool of resources and an edge is a directed connection between these pools.
The connections can trigger at some points to push or pull resources from one pool to
another.
4.6 Hyper State Space Graph Analysis
In [Mic19] Michael Cook and Azalea Raad deal with automated game analysis. They
define a hyperstate space graphs for better visualization of a game’s state. They created
this as a basis of AI researchers which can simplify their work. They also want this to
be used for game design analysis.
114 Related Work
Figure 4.5: Economy graph of [Ern12]
125 Problem Statement
Requirements engineering is a big part in the software industry for a long time now.
Jussi Kasurinen, Andrey Maglyas and Kari Smolander research in their paper "Is
requirements engineering useless in game development?" How game companies already
use requirements engineering and interviewed multiple people working in these.
They describe game development as "characterized by a high level of creativity when
compared to other fields of software development" [KMS14]. While they focus on
the overall process of requirements engineering, we will go deeper in the direction of
how are requirements tested or how is it ensured that these are met. Requirements
engineering is the process of defining, documenting and maintaining requirements
[KS98].
A crucial part of the creation of a product is often communication between departments.
This communication is really hard because writing everything down as it was told
is inefficient and mistake prone. Design Requirements get often only communicated
verbally and then afterwards checked by the quality assurance if these are met. This is
very time consuming and often also error prone because testing these requirements
gets done by hand.
Assuming that most of game developers struggle with these problems, we introduce
our system to give them a tool for better communication, testing and tracking of game
design requirements and user behaviour.
136 Game Requirements Model
We created his model to allow different game departments to communicate require-
ments better and see mistakes faster in their game.
Jung-Yong Park and Jong-Hee Park already try to reduce misinformation between game
designer and programmer. They create a graph based model called "event-state-action
graph" which allows them to analyze games based on the actions the user takes and
the events happening in the game. They want to reduce dead ends in novel games
[PP10]. While they propose the system for a specific genre our model focuses more on
the widely use in all genres.
The requirements by the game designers need to be communicated to every other
department. The art department has to create the right models for their game. If it’s a
futuristic game, the characters should also look like futuristic characters. Programming
has to implement all the things game design wants. If the characters should be able to
run, programmers will implement a way to increase the speed of the character while the
art department creates a run animation for the character model. This communication
of different requirements is often hard. Based on our problem statement the most
common technique to communicate these requirements or the design is by talking
with people. Less often they write these requirements down for others to read and
neither they create testing tools to ensure that these are met. Problems can occur like
breaking the navigation mesh which is a requirement by game design because they
designed which areas are accessible or not for the player. By breaking these areas, the
user might feel confused if he can’t walk there. Often these companies rely on their
quality assurance department, to find these mistakes.
Our model consists of layers and constraints. Layers are containing our game data
while constraints are rules that can be applied on the data. Afterwards we can use this
for automated testing and interacting with the model.
6.1 Layers
We define layers as parts of the game represented as a graph. This includes story,
spatial and logic layers. The user can also create other layers on demand. This will
allow him to adjust the system to almost every genre of games. The layers contain these
three different types of graphs, but can also be extended by programmers for their own
146 Game Requirements Model
type implementation.
While Joris Dormans in his paper Adventures in Level Design: Generating Missions and
Spaces for Action Adventure Games [Dor10] used two types of graphs to represent a level
to generate it, we take three graphs to represent a wider variety of game genres. He
created his generation model mostly for action-adventure games because the levels in
these games are often not rule-driven and depend more on as in their words "well-
designed levels".
6.1.1 Spatial
The spatial layer will show the game world and it’s interconnection. The graph of
this layer is a graph with subgraphs marked as circles as Edgar-Philipp Stoffel already
used this in his doctor thesis for helping with indoor navigation [Sto09]. A node in
our graph represents a place in the game. A house for example can be a node. This
house can now lay inside a town which we will represent as another node. Different
to Stoffel’s representation our graph has two types of connections, the first one is a
Visibility-Connection this connection allows the player to see the place represented by
the other node from his current node. The second type is a Traversable-Connection this
connection is a sub-type of the Visibility-Connection. It can be traversed and seen by the
player. Creating such a graph allows the users to analyze different aspects of it:
• If the graph is connected. If nodes are not connected through a traversable
or visibility connection, then this node can also be removed or needs to be
reconsidered at least.
• Centralization of a node. If nodes are centralized, the chances are higher that this
node will be visited more often by the player.
• Connectivity of the graph. Calculating the edge connectivity of a graph gives you
the number of removable edges until the graph is no longer connected. This can
be used to see how many alternative routes the player can take and where these
are.
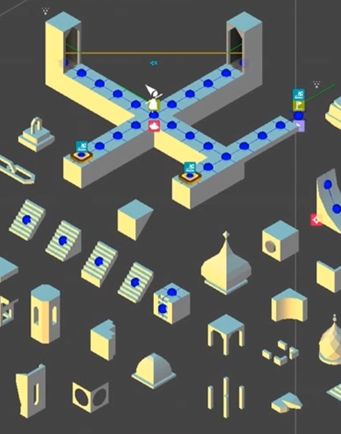
In figure 6.1 you can see how this graph can be visualized in Unity. The nodes are
simple GameObjects which can be dragged around and have an area size. Every node
has connections which the user can adjust. Because a navigation mesh is generated for
this scene, the paths from one node to another is also shown.
The corresponding graph in our model would look like figure 6.2. The places blue
and red are connected with each other, which means the user can walk from blue to
red and from red to to blue. The yellow place is an area but consists of the purple and
156 Game Requirements Model
Figure 6.1: A spatial graph represented in the game engine Unity
Figure 6.2: A graph representation for figure 6.1
orange node, it’s a subgraph in our graph. In the yellow area are two places, visualized
in orange and purple. Because red and blue have a connection to the yellow area. Both
166 Game Requirements Model
red and blue are connected to the purple node which means the player can access the
yellow area. From there he can travel to orange node or backwards.
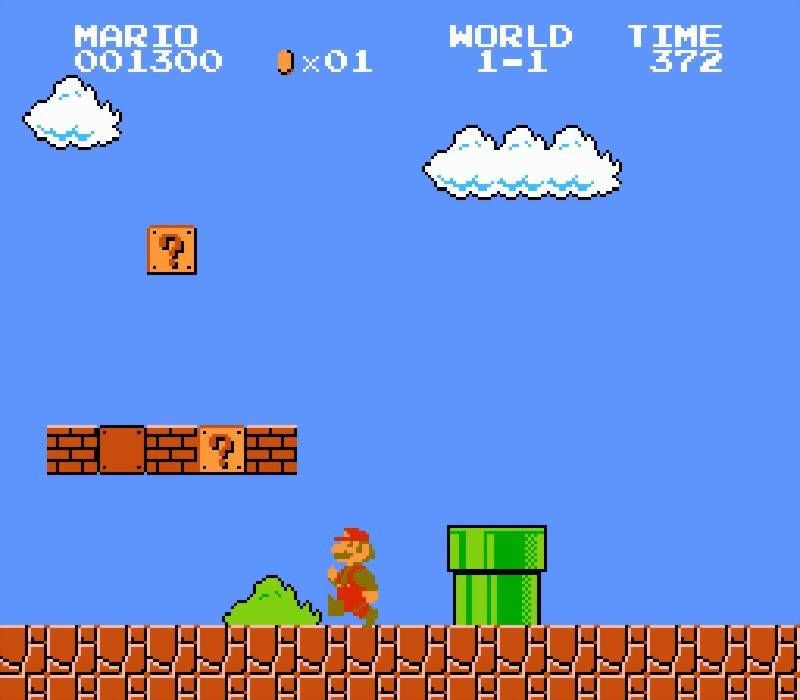
Figure 6.3: A level in Super Mario Bros. [Mog]
Generation These graphs can be generated partially, one reason for this is that no
program can know how many layers of abstraction you want in your hierarchy. This
means it could be enough for you to have one node for a whole city while others want
every house of that city being a node. For the connections in contrast some generation
can be done. If the game for example uses a navigation mesh for player movement it can
uses this for generating all traversable-connections. While for the visibility-connections
it might be harder based on the type of game. For example if the player has the full
control of the camera in a 3D game, you could shoot a ray from every node to the other
starting from the players height. If it hits the other node, the player is able to see it. A
game of this type could be Life Is Strange in which the player plays a 3D character with
a fully controlled camera in figure 6.4 the user can see the lighthouse by turning the
camera towards it. For 2D games it’s easier because most of them rely on the distance
176 Game Requirements Model
Figure 6.4: The lighthouse in Life Is Strange [jvb]
of the camera to the player. If the camera is distance based and moves with the player
all the time, we can check if the other node is in this screen based on the current node
of the player. Examples here are early The Legend of Zelda games or games like Super
Mario Bros. in which the player can never see further than his current screen seen in
figure 6.3.
6.1.2 Logic
The logical layer shows a graph of the key-lock puzzles in a game. In classic adventure
or puzzle games a lot of things can be modeled as these. A key-lock puzzle consists
normally of two parts, the key (diamond in fig. 6.5) and the lock (square in fig. 6.5).
The key can be found or obtained by the player, this can be a real key, knowledge or
abilities. He can then go to the lock and open it with the given key. Key lock puzzles
can be represented as these types, with examples from The Legend of Zelda series:
• 1:1, one key fits only for one specific lock. The nightmare key in The Legend of
Zelda is a key to get to the boss room for that level. It only fits the lock in the
same level. (Blue diamonds and square fig. 6.5)
• 1:N, one key fits many locks. This is often used by giving the players character
new abilities or items which allow the player to traverse to new areas of the map.
(Orange diamonds and square fig. 6.5)
• N:N, multiple key fit many locks. The normal keys in The Legend of Zelda is a key
186 Game Requirements Model
Figure 6.5: Logic graph of the dungeon Tail Cave in The Legend of Zelda: Link’s Awakening
which drops from specific monsters or can be found in chests around the level.
The player can open multiple doors with any of these keys. (Red diamonds and
square fig. 6.5)
• N:1, multiple keys fit a single lock. These types of puzzles are not included in
The Legend of Zelda but can occur in some other puzzle games, but are very rare.
Note while some type of keys, mostly normal keys are consumables. They get used up
after using them in video games. Instead abilities like jumping, running or grappling
hooks have often unlimited usage and allow the player to reuse them.
Mark Brown created a key-lock graph for a lot of dungeons in the The Legend of Zelda
series and release his outcomes in a Youtube series called Boss Keys [Bro15]. He also uses
196 Game Requirements Model
them to analyze different aspects of the games. This includes branching of puzzles,
meaning that the player has multiple orders to choose from like which keys he obtains
first or which locks he opens first. This also increases the complexity of the puzzles,
because the player sometimes need to backtrack to earlier found locks. Another part
which could be analyzed with this layer, is the solvability of the puzzle. This allows the
user to see if it’s even possible for the player to solve it.
6.1.3 Story
Figure 6.6: Simple story flow chart [Mon09]
Stories are often displayed as a flow chart like Emanuel Montero did in his blog post
206 Game Requirements Model
"Story Flowchart Diagrams" [Mon09] in which he describes simply how a story flow
could be built up. These flow charts can be visualized as graphs with directed and
conditional edges. They give the creators the information of the flow of their story. This
information can contain how linear their story is. This can be measured by counting
the branches of the flow chart. Every node from which the player can not traverse
further, because no outgoing edges exists for that node are story end points. If games
don’t have multiple ends of their story, narrative users need to take care that only one
of these end points exist. In our model we use the story as it is in the game when it’s
done. This means every dialog and every story point is included in our story graph.
Serdar Sali and Michael Mateas in their paper "Situating Quests: Design Patterns for
Quest and Level Design in Role-Playing Games" used such a graph as in figure 6.6 to
analyze the "story beats" per playthrough for a player. This allowed them to see which
type of input in a story driven game gives the player the best experience, number of
story beats. [Smi+11]
6.2 Connection between multiple layers
By connecting multiple layers in our model, we create a visualized solution for users
to analyze their game. This solution can reveal easy design mistakes or reveal the
ignorance of design rules, but also helps with performance analysis or usability features.
Every two graphs can be connected differently, logic and spatial graphs can be connected
by mapping the logic nodes on their spatial relative. While logic and story could be
mapped by putting the logic nodes on their respective story nodes. If the user has their
own layers defined, they need to specify manually which layer has another mapping
layer.
6.2.1 Spatial & Logic
Connecting a spatial and logic graph can reveal flaws very quickly. While a normal
designer can often analyze some requirements relatively easy, for example as shown in
figure 6.8 you can easily check if every lock has a key that can be reached by the player
without getting into a dead-lock situation. A dead-lock situation exists if the player
can’t do anything anymore and is stuck in progressing in the game. This can happen
by moving keys behind their respective door or by having fewer keys than doors. If the
designers put fewer keys than doors into the game and the player needs at least one
key to traverse further in the game and they decide to have an option for the player
to use their keys on dead-ends, paths which won’t progress the game, then the player
can get stuck if he uses the keys on the wrong doors. This leads normally to a very
frustrating experience for the player because he has to reload from the last checkpoint
216 Game Requirements Model
Figure 6.7: The spatial graph of the dungeon Tail Cave in The Legend of Zelda: Link’s
Awakening
Figure 6.8: Spatial fig. 6.7 combined with logic fig. 6.5
226 Game Requirements Model
or even worse he needs to reset the game.
Often already simple cases like this get complex very fast. By increasing the number
of objectives at a level it gets messy. With a graph based approach, we can easily
check requirements like dead-locks. Because we know at every moment which node
is accessible and what needs to be done to progress in the game we can check every
opportunity the player can take. We will ignore the explicit calculation of the dead-locks
here.
In figure 6.8 we can also see where the player will probably spend most of his time at
the level. By looking at the distribution of keys and locks we can see that the central
node is the most important. First, it has a degree of six, which is the highest in the
graph and second by having five locks and two keys in reach. The average degree of a
node in this level is two.
A graph based approach to visualize these concepts of a level allows us to utilize the
computation power of computers and also applying complex formulas to validate our
concepts.
6.2.2 Story & Spatial
Figure 6.9: Mission and space in the Forest Temple level of The Legend of Zelda: The
Twilight Princess [Dor10]
Joris Dormans created a mission graph and mapped this on the spatial map of a
236 Game Requirements Model
Zelda level as seen in figure 6.9.
While we talk about a story graph, his mission graph matches our story graph perfectly.
It describes the story flow and user action flow of a level. He used a real map of the
dungeon but also says he represented the spatial positions as a graph to then map the
mission nodes on his visualization [Dor10]. While he used his graphs for the generation
of Zelda like levels, we use these connections for analysis purposes.
6.2.3 Story & Logic
While story contains the flow of user actions, logic contains the connection between
logical game elements. If we combine story and logic graphs we get a description
of what the user has to do to continue his progress in the game. We can use this to
estimate playtime if we track the duration for each user-action in the story graph and
estimating a time for each logical component based on it’s complexity.
6.3 Constraints
The model supports constraints which can be defined by the user. These will be checked
in the on going development of their game. Constraints can contain information which
graph or nodes have to meet different requirements. Specialized constraints can be
defined by programmers so designers can use them.
Basic types of constraints can be:
• A node with a certain degree has [not] to be in a level.
• For every key in a level there has to be a lock.
• 50% of all nodes should have two outgoing edges of a story node, allowing the
player to progress the story in a more branching way.
• Every spatial node has to have at least a single Traversable-Connection.
• No key can be on the same spatial node as another key.
• Every door has to have a key on a adjacent spatial node.
With these examples, you will see that every rule is based on requirements on a graph.
Every property of a graph can be used in the rule defining process. Every rule can also
take advantage of multiple graphs at once and define rules based on the connection
between graphs.
These requirements are already used in other tools like the puzzle dependency chart
246 Game Requirements Model
shown in 4.1. As stated in [Gil14] checks if a story is expanding, higher out-degree of a
node than in-degree or contracting, lower out-degree than in-degree, are already done
and help the writers to write a better story.
6.4 Automated Testing
Figure 6.10: The navigation mesh in figure 6.1 broken because of a misplaced wall
Automated testing allows the user of a system to get validation of their progress
without involving more people. By utilizing our model with all the layers and their
connection and the defined rules the user can easily check if every requirement is met
at any stage of the project. This should be integrated into the engine of the user and
should also run on every finished build of the product. The rules should be able to be
categorized to enable and disabling them on demand of the user. This will allow a real-
time validation of all the rules of the selected categories. The user will get visualized
in the editor of his engine what’s missing or what is breaking the requirements. For
example in figure 6.2 a game designer defined that these areas have to be connected,
the environment artist now places a pink wall at the left end of the yellow area and
breaks the navigation mesh as you can see in figure 6.10. The system will then remind
the user that these areas have to be connected based on the graph defined by their
game designer and will show him what exactly broke. In this case, the yellow area is
no longer connected to the red and blue one.
Focusing on utilizing this system helps the project team to relieve their quality assurance
256 Game Requirements Model
and help them focus on the important tasks. It will probably also help newer people
on the project because it might take their fear of breaking things in a project and give
all the users much faster feedback on their actions than waiting for Quality Assurance
to find their flaws. As Ron Gilbert already stated "Gary and I didn’t have Puzzle
Dependency Charts for Maniac Mansion, and in a lot of ways it shows. The game is full
of dead end puzzles and the flow is uneven and gets bottlenecked too much." [Gil14].
With automated testing, these "bottlenecks" can be found easily and it helps to create
better experiences for players.
6.5 Interaction
This tool is available for all departments in a game company. These include art, game
design, programming and quality assurance. Every department can use this tool for
their advantage. This interaction should happen in the game engine it self.
6.5.1 Game Design
Game Design will use a graphical overlay in the scene view of their engine. This will
allow them to:
• Visualize multiple layers at once
This allows them to see if everything they’ve set up is there and if everything
they’ve made makes sense.
• Visualize multiple layers mapped on a single one
• Create nodes and connections in a layer
• Define different connections
6.5.2 Programming
The programming department can use the model to gain then access to the graph data
in runtime or in the editor. They can also define trigger points for the player to track
the live progress on the graph when he plays it.
Accessing the nodes of the graphs allows programmer to include them in the game
itself. They can use the spatial nodes for example for adaptive loading of areas. Every
node can trigger a loading point of the game. Because by looking at the traversable
and visibility connections you can easily see what should be loaded if the player is on a
given node.
266 Game Requirements Model
6.5.3 Art
While art mostly not interact with the game engine it self, technical artists or environ-
ment artist will still implement the created assets. This means they place the objects in
the world, add sound to it or connect some game logic to it. They will also get feedback
by our system if they break requirements with their newly introduced assets and
changes. Possible things they can break are navigation meshes. This can be crucial for
the game because if the player movement or enemy movement relies on the navigation
mesh, then the user will get a bad experience because he can’t go towards an area
because it’s blocked. It can also happen that the enemy can’t walk to specific spots
which it should as intended. Artists can also use the tool to gather information about
the centrality of the place they are currently working on. They can then decide on how
much time they want to spend in a place where the player for example will come by
five times based on the story. They can then reduce or increase the level of detail.
6.5.4 Quality Assurance
The quality assurance department will get an easier workflow in case of bug testing
and checking if it’s really a bug. They can also utilize the runtime tracking to check if
everything is triggered as intended. Bug testing will be easier because simple mistakes
like breaking the navigation mesh, which are unclear with the plain eye, are discovered
in before.
6.6 Use case
The use case for this system could be any game. As also stated in [Aar12] by using a
structure of a graph it makes it independent of the type of game. In their system they
use a graph structure to analyze a level in the creation process. It checks for solvability
and gives the user a graph structure of possible user behaviour. While our system is
also extensible by programmers it can match a wide genre of games.
Metroidvania & Adventure Games A good use cases for our system can be metroid-
vania or adventure games. They profit of an interconnected world and have strict
requirements in case of solvability or interconnectivity, the system can ensure that these
things are implemented and the requirements met.
Puzzle Games Puzzle games profit mostly of the logic graph in combination with the
spatial graph if the game has a world to play in. They can ensure their puzzles are
solvable and that the learning curve matches the description of the game designers.
276 Game Requirements Model
The learning curve could be measured by the distribution of puzzles on the spatial
graph.
Racing games Racing games can profit from our system by using the spacial graph,
they normally lack of logical and of story components. They can use the spatial graph
to track user behaviour in special places, these can be checkpoints or edges the user
could fall off. Our system can then evaluate in which distance the checkpoints should
be set. A custom system building up on the spatial graph could also analyze how
different a racing track is compared to the others in the game.
Role-Playing Games RPG’s can take the story, spatial and sometimes logical graph
to their advantage. They could map their complete story on the world map to see if
places don’t ever get visited by a player. Another option would be to have custom
parsing of the quest and dialog system. They could check if the player has visited a
place mentioned in the quest or dialog already.
287 Outlook
The next steps for this model can be the implementation and refinement of the different
aspects. While we don’t have a generic runtime tracking system directly included in our
model. It might be useful to use a system like that. This should allow all departments
to enable tracking of different things runtime. This could be the player’s position on
the graph or other different things. It might also be useful to utilize state-charts for
this type of problem, they allow an easier modeling approach for a state-machine and
could be used to construct this runtime state-machine [Har87].
It’s also important to reduce the amount of effort for the user to use such a system. This
means researching into the generation of spatial, story and logical graphs for games
might be a good option to reduce the commitment needed for introducing such a
system. Another next step could also be the test of the system in a real world company
which develops games. They should have the department structure mentioned.
While communication of requirements is the focus point of our model, we have to take
in mind that testing requirements in the context of the game, is already a possible
solution of communicating these requirements.
29List of Figures
3.1 A simple graph . . . . . . . . . . . . . . . . . . . . . . . . . . . . . . . . . 5
3.2 A graph with a subgraph green . . . . . . . . . . . . . . . . . . . . . . . . 6
4.1 A puzzle dependency chart of "The Day of the Tentacle" [Wei] . . . . . . 8
4.2 Monument Valley Gameplay Graph [Won15] . . . . . . . . . . . . . . . . . 9
4.3 Civilization 6 Technology tree . . . . . . . . . . . . . . . . . . . . . . . . . 10
4.4 A navigation mesh generated in Unity . . . . . . . . . . . . . . . . . . . . 11
4.5 Economy graph of [Ern12] . . . . . . . . . . . . . . . . . . . . . . . . . . . 12
6.1 A spatial graph represented in the game engine Unity . . . . . . . . . . 16
6.2 A graph representation for figure 6.1 . . . . . . . . . . . . . . . . . . . . . 16
6.3 A level in Super Mario Bros. [Mog] . . . . . . . . . . . . . . . . . . . . . . 17
6.4 The lighthouse in Life Is Strange [jvb] . . . . . . . . . . . . . . . . . . . . . 18
6.5 Logic graph of the dungeon Tail Cave in The Legend of Zelda: Link’s Awakening 19
6.6 Simple story flow chart [Mon09] . . . . . . . . . . . . . . . . . . . . . . . 20
6.7 The spatial graph of the dungeon Tail Cave in The Legend of Zelda: Link’s
Awakening . . . . . . . . . . . . . . . . . . . . . . . . . . . . . . . . . . . . 22
6.8 Spatial fig. 6.7 combined with logic fig. 6.5 . . . . . . . . . . . . . . . . . 22
6.9 Mission and space in the Forest Temple level of The Legend of Zelda: The
Twilight Princess [Dor10] . . . . . . . . . . . . . . . . . . . . . . . . . . . . 23
6.10 The navigation mesh in figure 6.1 broken because of a misplaced wall . 25
30Bibliography
[Aar12] Z. P. Aaron Bauer. “RRT-Based Game Level Analysis, Visualization, and
Visual Refinement.” In: (2012).
[Bro15] M. Brow. Boss Keys. https://www.youtube.com/watch?v=ouO1R6vFDBo&
list=PLc38fcMFcV_ul4D6OChdWhsNsYY3NA5B2. [Online; accessed 15-February-
2020]. 2015.
[Dor10] J. Dormans. “Adventures in Level Design: Generating Missions and Spaces
for Action Adventure Games.” In: ACM Press, 2010. doi: 10.1145/1814256.
1814257.
[Ern12] J. D. Ernest Adams. The Designer’s Notebook: Machinations, A New Way to
Design Game Mechanics. https : / / www . gamasutra . com / view / feature /
176033 / the _ designers _ notebook _ .php. [Online; accessed 15-February-
2020]. 2012.
[Gil14] R. Gilbert. Puzzle Dependency Charts. https://grumpygamer.com/puzzle_
dependency_charts. [Online; accessed 2-February-2020]. 2014.
[Har87] D. Harel. “Statecharts: a visual formalism for complex systems.” In: Science
of Computer Programming 8.3 (1987), pp. 231–274. issn: 0167-6423. doi: 10.
1016/0167-6423(87)90035-9.
[jvb] jvbuenconcejo. Life Is Strange: Lighthouse. https://www.deviantart.com/
jvbuenconcejo/art/Life- Is- Strange- Lighthouse- 534994780. [Online;
accessed 6-April-2020].
[KMS14] J. Kasurinen, A. Maglyas, and K. Smolander. “Is Requirements Engineering
Useless in Game Development?” In: Springer International Publishing, 2014,
pp. 1–16. isbn: 0302-9743. doi: 10.1007/978-3-319-05843-6_1.
[KS98] G. Kotonya and I. Sommerville. “Requirements Engineering: Processes and
Techniques.” In: John Wiley & Sons, 1998. isbn: ISBN 978-0-471-97208-2.
[Mic19] A. R. Michael Cook. “Hyperstate Space Graphs for Automated Game Anal-
ysis.” In: (2019).
31Bibliography
[Mog] S. Mog. Super Mario Brothers – Screenshot. https://gamefaqs.gamespot.com/
famicomds/578277-super-mario-brothers/images/25. [Online; accessed
6-April-2020].
[Mon09] E. Montero. Story Flowchart Diagrams. https://www.gamasutra.com/blogs/
EmanuelMontero/20091106/85856/Story_Flowchart_Diagrams.php. [On-
line; accessed 8-February-2020]. 2009.
[PP10] J.-Y. Park and J.-H. Park. A graph-based representation of game scenarios; method-
ology for minimizing anomalies in computer game. Vol. 26. 6-8. 2010, pp. 595–605.
doi: 10.1007/s00371-010-0482-6.
[Smi+11] G. Smith, R. Anderson, B. Kopleck, Z. Lindblad, L. Scott, A. Wardell, J.
Whitehead, and M. Mateas. “Situating Quests: Design Patterns for Quest
and Level Design in Role-Playing Games.” In: Springer Berlin Heidelberg,
2011, pp. 284–289. isbn: 0302-9743. doi: 10.1007/978-3-642-25289-1_40.
[Sto09] E.-P. Stoffel. “Hierarchical Graphs as Organisational Principle and Spatial
Model Applied to Pedestrian Indoor Navigation.” In: (2009).
[Wei] J. Weinberg. THE DAY OF THE TENTACLE: DEPENDENCY GRAPH ANAL-
YSIS. http://thewebsiteisdown.com/twidblog/day- of- the- tentacle-
dependency-graph/. [Online; accessed 07-April-2020].
[Wei16] J. Weinberg. Puzzle Dependency Graph Primer. https://www.gamasutra.com/
blogs / JoshuaWeinberg / 20160502 / 270103 / Puzzle _ Dependency _ Graph _
Primer.php. Journal Article. [Online; accessed 21-March-2020]. 2016.
[Won15] K. Wong. The Art of Monument Valley. https://www.youtube.com/watch?
v=i0X8-5PpYVg&feature=youtu.be&t=1339. [Online; accessed 15-February-
2020]. 2015.
32You can also read