Earnings Presentation - Second Quarter 2021 August 9, 2021
←
→
Page content transcription
If your browser does not render page correctly, please read the page content below

Second Quarter 2021
Earnings Presentation

August 9, 2021

Forward-Looking Statements
In this presentation, Scientific Games Corporation (“Scientific Games,” “SGMS” or the “Company”) makes “forward-looking statements” within the meaning of the U.S. Private Securities Litigation Reform Act of 1995. Forward-looking statements describe
future expectations, plans, results or strategies and can often be identified by the use of terminology such as “may,” “will,” “estimate,” “intend,” “plan,” “continue,” “believe,” “expect,” “anticipate,” “target,” “should,” “could,” “potential,” “opportunity,” “goal,” or
similar terminology. These statements are based upon management’s current expectations, assumptions and estimates and are not guarantees of timing, future results or performance. Therefore, you should not rely on any of these forward-looking
statements as predictions of future events. Actual results may differ materially from those contemplated in these statements due to a variety of risks and uncertainties and other factors, including, among other things: the impact of the COVID-19 pandemic
and any resulting unfavorable social, political, economic and financial conditions, including the temporary and potentially recurring closure of casinos and lottery operations on a jurisdiction-by-jurisdiction basis; risks relating to our continuing strategic
review and proposed acquisition of public SciPlay equity, including lack of assurance that the review will result in the consummation of any transaction, on any particular timetable or at all, that the review will yield additional value or that the review will not
adversely impact our business, financial results, results of operations, cash flows or stock price; slow growth of new gaming jurisdictions, slow addition of casinos in existing jurisdictions and declines in the replacement cycle of gaming machines; risks
relating to foreign operations, including anti-corruption laws, fluctuations in currency rates, restrictions on the payment of dividends from earnings, restrictions on the import of products and financial instability, including the potential impact to our business
resulting from the continuing uncertainty following the U.K.’s withdrawal from the European Union; difficulty predicting what impact, if any, new tariffs imposed by and other trade actions taken by the U.S. and foreign jurisdictions could have on our
business; U.S. and international economic and industry conditions; level of our indebtedness, higher interest rates, availability or adequacy of cash flows and liquidity to satisfy indebtedness, other obligations or future cash needs; the discontinuation or
replacement of LIBOR, which may adversely affect interest rates; inability to reduce or refinance our indebtedness; restrictions and covenants in debt agreements, including those that could result in acceleration of the maturity of our indebtedness;
competition; inability to win, retain or renew, or unfavorable revisions of, existing contracts, and the inability to enter into new contracts; the impact of U.K. legislation approving the reduction of fixed-odds betting terminals maximum stakes limit on LBO
operators, including the related closure of certain LBO shops; inability to adapt to, and offer products that keep pace with, evolving technology, including any failure of our investment of significant resources in our R&D efforts; changes in demand for our
products and services; inability to benefit from, and risks associated with, strategic equity investments and relationships; inability to achieve some or all of the anticipated benefits of SciPlay being a standalone public company; dependence on suppliers
and manufacturers; SciPlay’s dependence on certain key providers; ownership changes and consolidation in the gaming industry; fluctuations in our results due to seasonality and other factors; security and integrity of our products and systems, including
the impact of any security breaches or cyber-attacks; protection of our intellectual property, inability to license third-party intellectual property and the intellectual property rights of others; reliance on or failures in information technology and other systems;
litigation and other liabilities relating to our business, including litigation and liabilities relating to our contracts and licenses, our products and systems, our employees (including labor disputes), intellectual property, environmental laws and our strategic
relationships; reliance on technological blocking systems; challenges or disruptions relating to the completion of the domestic migration to our enterprise resource planning system; laws and government regulations, both foreign and domestic, including
those relating to gaming, data privacy and security, including with respect to the collection, storage, use, transmission and protection of personal information and other consumer data, and environmental laws, and those laws and regulations that affect
companies conducting business on the internet, including online gambling; legislative interpretation and enforcement, regulatory perception and regulatory risks with respect to gaming, especially internet wagering, social gaming and sports wagering;
changes in tax laws or tax rulings, or the examination of our tax positions; opposition to legalized gaming or the expansion thereof and potential restrictions on internet wagering; significant opposition in some jurisdictions to interactive social gaming,
including social casino gaming and how such opposition could lead these jurisdictions to adopt legislation or impose a regulatory framework to govern interactive social gaming or social casino gaming specifically, and how this could result in a prohibition
on interactive social gaming or social casino gaming altogether, restrict our ability to advertise our games, or substantially increase our costs to comply with these regulations; expectations of shift to regulated online gaming or sports wagering; inability to
develop successful products and services and capitalize on trends and changes in our industries, including the expansion of internet and other forms of interactive gaming; the continuing evolution of the scope of data privacy and security regulations, and
our belief that the adoption of increasingly restrictive regulations in this area is likely within the U.S. and other jurisdictions; incurrence of restructuring costs; goodwill impairment charges including changes in estimates or judgments related to our
impairment analysis of goodwill or other intangible assets; stock price volatility; failure to maintain adequate internal control over financial reporting; dependence on key executives; natural events that disrupt our operations, or those of our customers,
suppliers or regulators; possibility that the 2018 renewal of the Lotterie Nazionali S.r.l. concession to operate the Italian instant games lottery is not final (pending appeal against existing court rulings relating to third-party protest against the renewal of the
concession); and expectations of growth in total consumer spending on social casino gaming.
Additional information regarding risks and uncertainties and other factors that could cause actual results to differ materially from those contemplated in forward-looking statements is included from time to time in our filings with the Securities and Exchange
Commission (“SEC”), including the Company’s current reports on Form 8-K and quarterly reports on Form 10-Q and its latest Annual Report on Form 10-K filed with the SEC for the year ended December 31, 2020 on March 1, 2021 (including under the
headings “Forward Looking Statements” and “Risk Factors”). Forward-looking statements speak only as of the date they are made and, except for our ongoing obligations under the U.S. federal securities laws, we undertake no and expressly disclaim any
obligation to publicly update any forward-looking statements whether as a result of new information, future events or otherwise.
Additional Notes
This presentation may contain references to industry market data and certain industry forecasts. Industry market data and industry forecasts are obtained from publicly available information and industry publications. Industry publications generally state
that the information contained therein has been obtained from sources believed to be reliable, but that the accuracy and completeness of that information is not guaranteed. Although we believe industry information to be accurate, it is not independently
verified by us and we do not make any representation as to the accuracy of that information. In general, we believe there is less publicly available information concerning the international gaming, lottery, social and digital gaming industries than the same
industries in the U.S.
Due to rounding, certain numbers presented herein may not precisely agree or add up on a cumulative basis to the totals previously reported.
Strong Growth and Momentum as We Execute on Our Vision

                                              Rapidly Executing on our Vision and Strategic Pillars
                                               • Optimizing portfolio through intended Lottery and Sports Betting divestitures
                                               • Well along in the strategic alternatives process
                                               • Investing in content and digital with Koukoi, Lightning Box and new Las Vegas iGaming studio

                                              Continued Strong Momentum Across our Businesses
                                                                                           (1)
                                               • Consolidated revenue up 63%, AEBITDA highest in the Company’s history
                                               • Gaming delivered strong sequential growth, North American Game Ops revenue exceeded 2019 levels
                                               • Lottery posted another record quarter, signed major renewals and new deals
                                                                                                                (2)
                                               • SciPlay delivered sequential growth; ramping in casual with SPA & Koukoi acquisition
                                               • iGaming achieved record results & 25% U.S. share, up from 23% at 1Q
                                               • Sports accelerated expansion with 8 U.S. sportsbooks launches in 2Q, acquired SportCast
                                                                                                      (1)
                                              Focused on Driving FCF and Significantly De-levering
                                                                                    (1)
                                               • Reduced Net Debt Leverage Ratio by nearly 1/3rd to 7.2x, from 10.5x at the beginning of the year
                                                                (1)
                                               • Delivered FCF of $133M in 2Q, highest in recent history, and $213M year-to-date
                                               • Paid down $150M of debt in 2Q, additional $150M post-quarter end
                                               • Strong interest in Lottery and Sports, confident in path to significantly de-levering

(1) Denotes a non-GAAP financial measure and is reconciled to the most directly comparable GAAP measure in the tables in the appendix.
(2) Solitaire Pets TM Adventure.                                                                                                         ©2021 Scientific Games. All Rights Reserved |   3
Operational Progress

                  ©2021 Scientific Games. All Rights Reserved |   4
Gaming
    Making Gains in Key Profit Pools
                     Gaming Operations                                                 Game Sales
•   4th consecutive quarter of growth in our North American   •   North American Sales accelerated, driving improvement in
    premium ops installed base, now above 2019 levels             share with proven titles on Kascada™; shipped 3,221 units in
                                                                  2Q, +66% sequentially
                     2Q21

                  +11%
    2Q20

•   North American Gaming operations revenue                  •   Grew Australian ship share fueled
    exceeded 2019 levels                                          by continued success of Kraken Unleashed ™
                                 $118M
                         $115M

                         2Q19     2Q21

                                                                                         ©2021 Scientific Games. All Rights Reserved |   5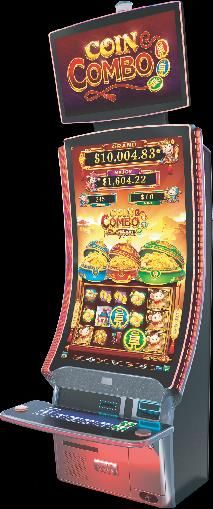
Gaming
Gaining Traction with Global Product Roadmap

                 Kascada™                                                 Mural™
Most Successful Launch in Our Recent History                  Robust Pipeline of Orders
                     • Most successful launch in our                               • Soft launch in major U.S.
                       recent history, shipped 1,000                                 markets; 3Q full launch
                       units in less than half the time of
                       the J43                                                     • Healthy library of games;
                                                                                     early performance very
                     • Driver of share in key profit                                 promising
                       pools
                                                                                   • Launched with Willy
                     • Executing on robust sales                                     Wonka Dreamers of
                       pipeline in Gaming Operations                                 Dreams™ & 88 Fortunes®
                       & Game Sales                                                  Emperor’s Coins™

                     • Launched with key franchises                                • Initial placements in
                       Coin Combo™, MONOPOLY                                         California, Nevada,
                       Money Grab® and Dancing                                       Oklahoma, Florida &
                       Drums Prosperity™                                             Michigan casinos

        Strong pipeline of regular cabinet and game launches planned for 2022 and 2023

                                                                     ©2021 Scientific Games. All Rights Reserved |   6
Lottery
Record Quarter with Key Wins & Renewals
          Instant Game Sales & SGEP*
                                                    Contract Wins & Extensions
            Partnerships Accelerate

   •    Record revenue and AEBITDA with         •    Announced winner of 10-year instant
        strong sequential growth off 1Q              game partnership and systems
                                                     technology contracts in Pennsylvania
   •    Record YTD U.S. instant games                – top 10 U.S. lottery for total sales
        sales +21% YoY and +30% vs. 2019
                                                •    Extended New Hampshire Lottery
   •    European instant games sales up              instant games contract six years and
        double digits YTD for 9 of our top           upgraded to SGEP partnership – top 10
        10 lottery customers – Italy JV +20%         lottery worldwide for instant game sales
   •    U.S. SGEP retail sales +17.6% YTD       •    Internationally, new contracts and
                                                     contract extensions totaling 13 years
   •    Now 14 U.S. SGEP partnerships and
                                                     in Bosnia, Denmark, Georgia, Poland
        over 20 globally
                                                     and Portugal
   •    Hit all time highs in average selling
        price of SG games in U.S.

*Scientific Games Enhanced Partnership
                                                    ©2021 Scientific Games. All Rights Reserved |   7
Lottery
Revolutionizing the Global Lottery Business

     Advancing Lottery Retail With Innovation   Expanding Global Digital Lottery Business

 •    Integrated SCiQ® technology into          •   Provider to 21 iLotteries worldwide
      PlayCentral® self-service vending
      machines, enabling real-time tracking           •   Pennsylvania iLottery sales hit
                                                          $2 billion in just over 3 years with
 •    SCiQ in markets across 14                           94 live games – fastest growing
      jurisdictions                                       iLottery program in U.S.
 •    Installed more than 600 PlayCentral             •   Atlantic Lottery (Canada) achieved
      self-service terminals in 1H21                      50% YoY growth in GGR in Q2
                                                          following addition of iCasino content
                                                          to iLottery

                                                •   Launched new digital instant games
                                                    program for Rheinland-Pfalz (Germany)

                                                •   1 in 4 U.S. lotteries use an SG-developed
                                                    mobile app – 21 total apps launched

                                                      ©2021 Scientific Games. All Rights Reserved |   8
SciPlay
       Second Highest Revenue Quarter Driven by Record Payer Metrics

          Payer Conversion
              Rate (%)                                                             AMRPPU (1)                            ARPDAU (2)
                                                                                                                                                                      Key highlights

                                                            $101.13                                                 $0.72              $0.72            •     Delivered sequential growth,
                                                                                                                                                              building off strong 2020
              8.5%                              8.5%                       $96.29                  $96.29   $0.67              $0.67
                                   8.1%                                                   $92.80                                                        •     Continued to enhance
                                                                                                                                                              monetization across all key
                                                                                                                                                              metrics through payer focus and
  6.8%                                                                                                                                                        live-ops strategy

                                                                                                                                                        •     Achieved record payer metrics
                                                                                                                                                              including payer conversion of
       170bps                            40bps                          -5%                   +4%               +7%                +7%                        8.5% and ARPDAU(2) of $0.72

                                                                                                                                                        •     AMRPPU(1) of $96.29, second
                                                                                                                                                              highest ever

 2Q20          2Q21                1Q21         2Q21             2Q20         2Q21         1Q21     2Q21    2Q20     2Q21      1Q21     2Q21

         YoY                             QoQ                            YoY                   QoQ                  YoY             QoQ

(1) Average Monthly Revenue Per Paying User, (2) Average Revenue Per Daily Active User.
                                                                                                                                       ©2021 Scientific Games. All Rights Reserved |   9
SciPlay
Building Casual Pipeline and Adding Proven Talent
                                                                          Key Highlights

                                                    •   Solitaire Pets Adventure TM initial KPIs
                                                        promising
                                                          •      Solidifying retention metrics and
                                                                 optimizing monetization
                                                          •      Expanding user acquisition testing
                                                          •      Progressing to worldwide launch
                                                    •   Koukoi acquisition jumpstarts Project X
                                                        team
                                                          •      New casual game to be launched in
                                                                 2H22

                                                          •      Proven game developer with a depth
                                                                 of experience in casual games
                                                          •      Critical mix of technical and creative
                                                                 expertise
                                                          •      Incredible cultural alignment

                                                              ©2021 Scientific Games. All Rights Reserved |   10
Digital
Delivered Record Quarter with Fast Growing Sports and iGaming Footprint
IOWA INDIANA
MICHIGAN Key Highlights
NEW YORK STATE
• Momentum continues in Digital with
record revenue and AEBITDA
PENNSYLVANIA
• U.S. iGaming revenue +106% YoY, U.S.
share to 25% in the states we are live in;
West Virginia launched July 27th
• Record quarter in Sports; powered
over 100 million bets at the European
NEW JERSEY Soccer Championships
• U.S. Sports Betting revenue +205%
YoY, 27 sportsbooks now live with 8 new
deployments in 2Q
NEVADA
• Launched 5 sportsbooks with
COLORADO FanDuel and 2 with Wynn
ARIZONA LOUISIANA
ILLINOIS • Now live with FanDuel in all 10
WEST VIRGINIA VIRGINIA
states with further go-lives planned
MISSISSIPPI TENNESSEE in 3Q
• Sportsbooks now live in 12 U.S. states
with several more in the pipeline
Sportsbooks deployed Sportsbooks planned iGaming & Sportsbooks deployed
©2021 Scientific Games. All Rights Reserved | 11iGaming
Expanding Original Content Capabilities
U.K. Studio
Key Highlights
Digital-native and land-
Canada Studio based content
• Expanding studio production
Global digital-native content capacity
• Launched new Las Vegas
iGaming studio
India Studio
Co-developing digital -native • Acquired Lightning Box, top
content with 3rd party studios performing studio in the U.S.
market
Lightning Box • Original land-based content driving
differentiation and performance
Global digital-native content
• 88 Fortunes® #1 in the U.S.(1)
Las Vegas Studio
• Jin Ji Bao Xi ® most successful
Land-based franchises game since initial launch in MI
and digital-native
• Rainbow Riches™ top
performing game in the U.K.
Australia Studio
• MONOPOLY -themed games
perform well across all
Game engine design regions
(1) Eilers Online Game Performance Report – July ’21.
©2021 Scientific Games. All Rights Reserved | 12iGaming Platform
A Must Have Platform Connecting Operators and Studios
Powering the best iGaming player OUR STUDIOS
experiences across the globe
iGaming
Platform Las Vegas
Canada
India
150+ Customers
Australia &
U.K. Lightning Box
3.5bn Game Rounds
Per Month WORLDWIDE PARTNER STUDIOS
3,000+ Games Live
50 Studio Partners
13
©2021 Scientific Games. All Rights Reserved | 13Financial Results
©2021 Scientific Games. All Rights Reserved | 14Consolidated Financial Results
Strong Growth and Momentum Across our Businesses
$ in millions
Key Highlights
Consolidated Consolidated
(1)
Revenue AEBITDA • Consolidated revenue up 63%,
AEBITDA(1) highest in the
$880 $880 Company’s history
$729 $383 $383 • Strong double-digit growth
sequentially driven by momentum
in all businesses
$539 $270 • Gaming rebound driven by product
roadmap and record GGR
$121 • Delivered record Lottery and Digital
+63% +21%
revenue and AEBITDA
+217% +42% • SciPlay achieved 2nd highest
revenue quarter ever
2Q20 2Q21 1Q21 2Q21 2Q20 2Q21 1Q21 2Q21 • 2Q21 Revenue and AEBITDA(1)
Sequential Sequential benefited from $38M U.K.FOBT
YoY Growth YoY Growth
Growth Growth recovery(2)
(1) Denotes a non-GAAP financial measure and is reconciled to the most directly comparable GAAP measure in the tables in the appendix.
(2) The FOBT recovery is related to a 2020 U.K. court ruling, associated with overcharging of value-added tax for previous services rendered to gaming operators that ©2021 Scientific Games. All Rights Reserved | 15
consequently reduced our net gaming revenue related to these customers and arrangements.Leverage and Interest Expense
Reduced Net Debt Leverage Ratio(1) by Nearly 1/3rd in 6 Months
Net Debt Available
Key Highlights
Leverage Ratio(1) Liquidity(2) Interest Expense
(billions) (millions) (millions)
• Focus on cost and balance sheet
management enabling continued
progress on debt reduction
10.5x $1,435
• Lowered net debt leverage ratio(1) by
9.6x nearly 1/3rd to 7.2x in 6 months, a
$943
$124 reduction of 3.3 turns from peak
7.2x $119
• Paid down $150M of debt in 2Q,
WACD
additional $150M post quarter end
Net Debt Net Debt Net Debt WACD
$ 8.4 $ 8.3 $ 8.2 4.8% 5.0%
• Paid down over $500M of debt
since October
• Improved available liquidity to end 2Q
at $1.4B
4Q20 1Q21 2Q21 2Q20 2Q21 2Q20 2Q21
(1) Denotes a non-GAAP financial measure and is reconciled to the most directly comparable GAAP measure in the tables in the appendix.
(2) Available liquidity is calculated as cash and cash equivalents plus remaining revolver capacity including the SciPlay Revolver. ©2021 Scientific Games. All Rights Reserved | 16(1)
Free Cash Flow
Focus on Expense Controls and FCF Conversion(1)
$ in millions
2Q21 2Q20 B/(W) 1H21 1H20 B/(W) Key Highlights
Consolidated
AEBITDA
(1)
$ 383 $ 121 217% $ 653 $ 321 103% • Generated $133M in FCF(1) in 2Q and
$213M YTD, driven by more than tripling of
AEBITDA(1)
Capital Expenditures (53) (39) (36)% (103) (92) (12)%
• FCF conversion(1) of 34.7% in 2Q and
Cash Interest (106) (114) 7% (229) (224) (2)% 32.6% YTD, included 720 bps and 410 bps
of FOBT benefit respectively
Cash Taxes (6) (1) Nm (13) (7) (86)% • Continued capital investment discipline,
aligning with demand
Changes in Working
Capital, net (83) 30 Nm (61) 50 Nm • Impact on working capital primarily driven by
lower accounts payable balances in the
current year period
Other (2) - Nm (34) 4 Nm
(1)
Free Cash Flow $ 133 $ (3) Nm $ 213 $ 52 310%
(1), (2)
FCF Conversion 34.7% -2.5% Nm 32.6% 16.2% 1640bps
(1) Denotes a non-GAAP financial measure and is reconciled to the most directly comparable GAAP measure in the tables in the appendix. (2) FCF conversion is calculated as free
cash flow as a percentage of Consolidated AEBITDA. (3) Free Cash Flow for the three and six months ended June 30, 2021 benefited from $38 million and $44 million, respectively, ©2021 Scientific Games. All Rights Reserved | 17
due to the U.K. FOBT recovery received from certain U.K. customers.
nm – not meaningfulStrong Growth and Momentum as We Execute on Our Vision
Quickly Executing on Our Vision and Strategic Pillars
Continued Strong Momentum Across our Businesses
Focused on Driving FCF(1) and Significantly De-levering
Unlocking Significant Value as We Build a Leading Global Game Company
(1) Denotes a non-GAAP financial measure and is reconciled to the most directly comparable GAAP measure in the tables in the appendix.
©2021 Scientific Games. All Rights Reserved | 18Appendix
©2021 Scientific Games. All Rights Reserved | 19Non-GAAP Financial Measures
The Company's management uses the following non-GAAP financial measures in conjunction with GAAP financial measures: Consolidated Free Cash Flow
AEBITDA, free cash flow, free cash flow conversion, EBITDA from equity investments, and net debt and net debt leverage ratio (each, as described Free cash flow, as used herein, represents net cash provided by operating activities less total capital expenditures (which includes lottery, gaming
more fully below). These non-GAAP financial measures are presented as supplemental disclosures. They should not be considered in isolation of, and digital systems expenditures and other intangible assets and software expenditures), less payments on license obligations, less contributions to
as a substitute for, or superior to, the financial information prepared in accordance with GAAP, and should be read in conjunction with the equity method investments plus distributions of capital from equity investments, and adjusted for changes in restricted cash impacting working
Company's financial statements filed with the SEC. The non-GAAP financial measures used by the Company may differ from similarly titled capital. Free cash flow is a non-GAAP financial measure that is presented as a supplemental disclosure for illustrative purposes only and is
measures presented by other companies. reconciled to net cash provided by operating activities, the most directly comparable GAAP measure, in a schedule herein. In the third quarter of
2020, we recast free cash flow to adjust our previously used measure, free cash flow, to exclude changes in restricted cash, substantially associated
Specifically, the Company's management uses Consolidated AEBITDA to, among other things: (i) monitor and evaluate the performance of the
with the recent expansion of iLottery operations, that are impacting working capital, and align such calculation with the revised management view
consolidated Company's business operations; (ii) facilitate management's internal and external comparisons of the Company's consolidated
and definition of such non-GAAP financial measure. Such restricted cash is excluded because it is not available to fund debt repayments or other
historical operating performance; and (iii) analyze and evaluate financial and strategic planning decisions regarding future operating investments and
initiatives and therefore management believes this calculation better aligns with the reason management uses this non-GAAP information.
operating budgets.
In addition, the Company's management uses Consolidated AEBITDA to facilitate management's external comparisons of the Company's Free Cash Flow Conversion
consolidated results to the historical operating performance of other companies that may have different capital structures and debt levels. Free cash flow conversion, as used herein, represents the ratio by which Consolidated AEBITDA (as defined on this page) is converted into Free
Cash Flow (as defined above). Free cash flow conversion is a non-GAAP financial measure that is presented as a supplemental disclosure for
The Company's management uses EBITDA from equity investments to monitor and evaluate the performance of the Company's equity investments. illustrative purposes only and is reconciled to net cash flow conversion, the most directly comparable GAAP measure, in a schedule herein.
The Company's management uses net debt and net debt leverage ratio in monitoring and evaluating the Company's overall liquidity, financial
flexibility and leverage. EBITDA from Equity Investments
The Company's management believes that each of these non-GAAP financial measures are useful as they provide management and investors with EBITDA from equity investments, as used herein, represents our share of earnings (loss) (whether or not distributed to us) plus income tax expense,
information regarding the Company's financial condition and operating performance that is an integral part of management's reporting and planning depreciation and amortization expense (inclusive of amortization of payments made to customers for LNS), interest (income) expense, net, and
processes. In particular, the Company's management believes that Consolidated AEBITDA is helpful because this non-GAAP financial measure other non-cash and unusual items from our joint ventures and minority investees. EBITDA from equity investments is a non-GAAP financial measure
eliminates the effects of restructuring, transaction, integration or other items that management believes is less indicative of the Company's ongoing that is presented as supplemental disclosure for illustrative purposes only and is reconciled to earnings from equity investments, the most directly
underlying operating performance and are better evaluated separately. Moreover, management believes EBITDA from equity investments is useful comparable GAAP measure, in a schedule herein.
to investors because the Company's Lottery business is conducted through a number of equity investments, and this measure eliminates financial
items from the equity investees' earnings that management believes has less bearing on the equity investees' performance. Management believes Net Debt and Net Debt Leverage Ratio
that free cash flow provides useful information regarding the Company's liquidity and its ability to service debt and fund investments. Management Net debt is defined as total principal face value of debt outstanding, the most directly comparable GAAP measure, less cash and cash equivalents.
also believes that free cash flow is useful for investors because it provides them with an important perspective on the cash available for debt Principal face value of debt outstanding includes the face value of debt issued under Senior Secured Credit Facilities, Senior Notes and
repayment and other strategic measures, after making necessary capital investments in property and equipment, necessary license payments to Subordinated Notes, which are all described in Note 15 of the Company's Annual Report on Form 10-K for the year ended December 31, 2020, but it
support the Company’s ongoing business operations, adjustments for changes in restricted cash impacting working capital and taking into account does not include long term obligations under financing leases or $6 million in proceeds received in 2019 from transactions completed in 2018 which
cash flows relating to the Company’s equity investments. are presented as debt. In addition, principal face value of debt outstanding with respect to the 2026 Secured Euro Notes and 2026 Unsecured Euro
Notes are translated at the constant foreign exchange rate at issuance of these notes as those amounts remain payable at the original issuance
Consolidated AEBITDA amounts in Euro. Net debt leverage ratio, as used herein, represents net debt divided by Consolidated AEBTIDA (as defined herein).
Consolidated AEBITDA, as used herein, is a non-GAAP financial measure that is presented as supplemental disclosure and is reconciled to net
income (loss) as the most directly comparable GAAP measure, as set forth in the schedule titled “Reconciliation of Net Income (Loss) Attributable to
SGC to Consolidated AEBITDA.” Consolidated AEBITDA should not be considered in isolation of, as a substitute for, or superior to, the consolidated
financial information prepared in accordance with GAAP, and should be read in conjunction with the Company's financial statements filed with the
SEC. Consolidated AEBITDA may differ from similarly titled measures presented by other companies.
Consolidated AEBITDA is reconciled to consolidated net income (loss) and includes net income (loss) attributable to SGC with the following
adjustments: (1) net income attributable to noncontrolling interest, (2) restructuring and other, which includes charges or expenses attributable to: (i)
employee severance; (ii) management restructuring and related costs; (iii) restructuring and integration; (iv) cost savings initiatives; (v) major
litigation; and (vi) acquisition costs and other unusual items; (3) depreciation and amortization expense and impairment charges and goodwill
impairments; (4) change in fair value of investments and remeasurement of debt; (5) interest expense; (6) income tax expense; (7) stock-based
compensation; (8) loss on debt financing transactions; and (9) other income (expense), net. In addition to the preceding adjustments, we exclude
earnings (loss) from equity method investments and add (without duplication) our pro rata share of EBITDA of our equity investments, which
represents our share of earnings (whether or not distributed to us) before income tax expense, depreciation and amortization expense, and interest
expense, net of our joint ventures and minority investees, which is included in our calculation of Consolidated AEBITDA to align with the provisions of
our long-term debt arrangements. AEBITDA is presented exclusively as our segment measure of profit or loss.
©2021 Scientific Games. All Rights Reserved | 20SGMS Reconciliation of Net Income (Loss)
Attributable to SGC to Consolidated AEBITDA
Three months Twelve months Twelve months ended
Three months ended June 30, Six months ended June 30, ended March 31, Twelve months ended June 30, ended March 31, December 31,
2021 2020 2021 2020 2021 2021 2020 2021 2020
Net income (loss) attributable to SGC $ 109 $ (203) $ 94 $ (362) $ (15) $ (113) $ (393) $ (425) $ (569)
Net income attributable to noncontrolling interest 4 5 10 9 6 22 21 23 21
Net income (loss) 113 (198) 104 (353) (9) (91) (372) (402) (548)
Restructuring and other 32 16 53 38 21 82 53 66 67
Depreciation, amortization and impairments 123 140 246 278 123 522 590 539 554
Goodwill impairment - - - 54 - - 54 - 54
Other (income) expense, net (70) 1 (68) 5 2 (63) 14 8 10
Interest expense 119 124 240 248 121 495 536 500 503
Income tax expense 8 2 11 6 3 9 5 3 4
Stock-based compensation 41 14 64 24 23 101 37 74 61
Loss on debt financing transactions - - - - - 1 40 1 1
Loss (gain) on remeasurement of debt 7 12 (18) 2 (25) 31 (5) 36 51
(1)
EBITDA from equity investments 24 7 44 14 20 67 46 50 37
(Earnings) loss from equity investments (14) 3 (23) 5 (9) (22) (6) (5) 6
Consolidated AEBITDA $ 383 $ 121 $ 653 $ 321 270 $ 1,132 $ 992 $ 870 $ 800
$
Note: U.S. Dollars in millions.
(1) EBITDA from equity investments is a non-GAAP financial measure reconciled to Earnings (loss) from equity investments on slide 25. ©2021 Scientific Games. All Rights Reserved | 21SGMS Reconciliation of Principal Face Value of Debt
Outstanding to Net Debt Leverage Ratio
As of
June 30, 2021 June 30, 2020 March 31, 2021 December 31, 2020
(1)
Consolidated AEBITDA $ 1,132 $ 992 $ 870 $ 800
Total debt $ 9,019 $ 9,153 $ 9,166 $ 9,303
Add: Unamortized debt discount/premium and deferred financing costs, net 94 106 99 104
Add: Impact of exchange rate(2) 29 67 38 7
Less: Debt not requiring cash repayment and other (6) (7) (6) (7)
Principal face value of debt outstanding 9,136 9,319 9,297 9,407
Less: Cash and cash equivalents 932 790 967 1,016
Net debt $ 8,204 $ 8,529 $ 8,330 $ 8,391
Net debt leverage ratio 7.2 8.6 9.6 10.5
Euro to USD exchange rate at reporting date 1.19 1.12 1.17 1.22
Euro to USD exchange rate at issuance 1.24 1.24 1.24 1.24
Note: U.S. Dollars in millions
(1) Refer to the reconciliation of Consolidated AEBITDA included in the table titled "Reconciliation of Net Income (Loss) Attributable to SGC to Consolidated AEBITDA" ended for the periods presented on slide 21. ©2021 Scientific Games. All Rights Reserved | 22
(2) Exchange rate impact is the impact of translating our outstanding 2026 Secured Euro Notes and 2026 Unsecured Euro Notes translated at constant foreign exchange rate at issuance of these notes as compared
to the current exchange rate.SGMS Reconciliation of Net Cash Provided by
Operating Activities to Free Cash Flow
Three Months Ended June 30, Six Months Ended June 30,
2021 2020 2021 2020
Net cash provided by operating activities $ 149 $ 52 $ 272 $ 172
Less: Capital expenditures (53) (39) (103) (92)
Less: Distributions from equity method investments, net of additions 16 (1) 7 (1)
Less: Payments on license obligations (16) (7) (29) (15)
Add (less): Change in restricted cash impacting working capital 37 (8) 66 (12)
Free cash flow $ 133 $ (3) $ 213 $ 52
Note: U.S. Dollars in millions
©2021 Scientific Games. All Rights Reserved | 23SGMS Reconciliation of Free Cash Flow Conversion
Three months ended Six months ended
June 30, June 30,
2021 2020 2021 2020
Free Cash Flow (1) $ 133 $ (3) $ 213 $ 52
Consolidated AEBITDA (2)
383 121 653 321
Free Cash Flow Conversion (3) 34.7% (2.5%) 32.6% 16.2%
(1) Refer to the reconciliation of Free Cash Flows to Net Cash Provided by Operating Activities on slide 23.
(2) Refer to the reconciliation of Consolidated AEBITDA included in the table titled "Reconciliation of Net Income (Loss) Attributable to SGC to Consolidated AEBITDA" for the periods presented on slide 21. ©2021 Scientific Games. All Rights Reserved | 24
(3) Free cash flow conversion, as used herein, represents the ratio by which Consolidated AEBITDA is converted into Free Cash Flow.SGMS Reconciliation of Earnings (Loss) from Equity
Investments to EBITDA from Equity Investments
Three months Twelve months Twelve months ended
Three months ended June 30, Six months ended June 30, ended March 31, Twelve months ended June 30, ended March 31, December 31,
2021 2020 2021 2020 2021 2021 2020 2021 2020
Earnings (loss) from equity investments $ 14 $ (3) $ 23 $ (5) $ 9 $ 22 $ 6 $ 5 $ (6)
Add: Income tax expense 4 1 8 2 4 10 6 7 4
Add: Depreciation, amortization and impairments 9 7 16 14 7 33 31 31 31
Add: Interest income, net and other (3) 2 (3) 3 - 2 3 7 8
EBITDA from equity investments $ 24 $ 7 $ 44 $ 14 $ 20 $ 67 $ 46 $ 50 $ 37
Note: U.S. Dollars in millions
©2021 Scientific Games. All Rights Reserved | 25Legal
CLUEDO and all related characters are trademarks of Hasbro and are used with permission. © 2021 Hasbro. All Rights Reserved. Licensed
by Hasbro.
The MONOPOLY name and logo, the distinctive design of the game board, the four corner squares, the MR. MONOPOLY name and
character, as well as each of the distinctive elements of the board, cards, and the playing pieces are trademarks of Hasbro for its property
trading game and game equipment and are used with permission. © 2021 Hasbro. All Rights Reserved. Licensed by Hasbro.
WILLY WONKA & THE CHOCOLATE FACTORY and all related characters and elements © & ™ Warner Bros. Entertainment Inc. (s21)
All ® notices signify marks registered in the United States. © 2021 Scientific Games Corporation. All Rights Reserved.
©2021 Scientific Games. All Rights Reserved | 26You can also read